Economic Weekly 30/2025, August 1, 2025
Published: 01/08/2025
Table of contents
EU-US Agreement Reduces Economic Cost of US Tariffs
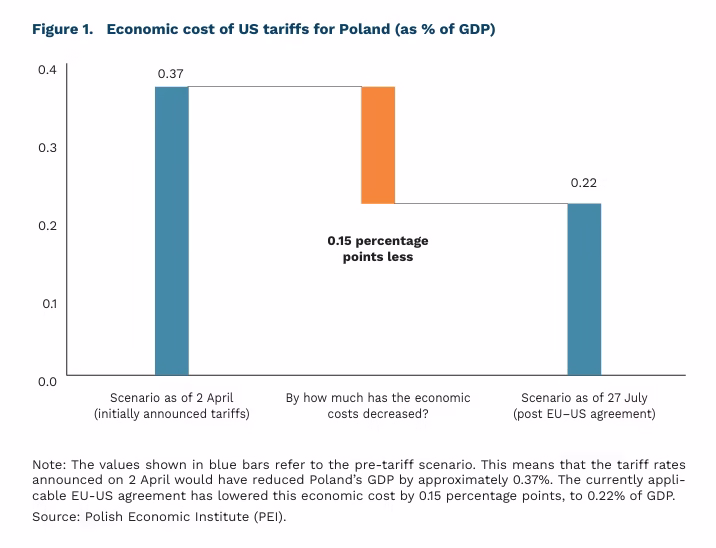
0.37% to 0.22% of GDP estimated reduction in the economic cost of US tariffs for Poland between 2 April and 27 July 2025, according to PEI
0.58% to 0.31% drop in export losses for the median Polish sector compared to the April tariff scenario
0.58% to 0.31% drop in export losses for the median Polish sector compared to the April tariff scenario
The European Commission has negotiated a trade agreement with the United States that will reduce tariffs on most EU exports to the US to 15%. The deal also includes investment packages and commitments on energy imports. According to the Polish Economic Institute (PEI), the economic cost of US tariffs for Poland has clearly declined compared to the rates announced on 2 April 2025.
Which tariffs will the EU-US agreement reduce? Most EU exports to the US will now face a 15% tariff, down from 20% announced in April (and from 50% and 30% considered by Donald Trump in May and July). Notably, tariffs on automotive exports will fall from 27.5% to 15%. The agreement also provides for mutually zero tariffs on selected critical goods such as aircraft, selected chemicals, generic medicines, semiconductors, some agricultural products, and raw materials. The full list of exemptions has yet to be disclosed. Under the agreement, US exports to the EU will not be subject to tariffs.
Which products were excluded from the agreement? Tariffs on exports of steel and aluminium will rise from 25% to 50%. These products are not covered by the EU-US agreement. The tariff hike stems from the United States’ June decision to impose a 50% global duty on steel and aluminium under Section 232 – a provision allowing the US President to apply tariffs on national security grounds. Ongoing Section 232 investigations are also examining imports of pharmaceuticals and semiconductors. These may lead to future agreements, potentially involving tariff reductions in exchange for export quotas. The United Kingdom has already concluded a similar agreement in the metals sector (link).
What is the economic cost of US tariffs? Most countries – including the United States – stand to lose from the ongoing trade conflict. The Polish Economic Institute has assessed the economic cost of US tariffs under two scenarios: based on the rates announced on 2 April and those agreed on 27 July.
- Poland’s GDP loss will be limited. The estimated economic cost of the tariffs has declined from 0.37% of GDP under the April scenario to 0.22% under the current agreement. This means that the initial tariff package could have cost Poland around PLN 13.5 billion (based on 2024 GDP), while the revised deal reduces this burden by PLN 5.5 billion to approximately PLN 8.0 billion.
- Export losses across most sectors have eased. Under the earlier tariff levels, the median Polish sector was expected to experience a 0.58% decline in export value. That figure has now fallen to 0.31%. The reduction in losses is particularly notable in tariff-sensitive sectors, for example: mining (from 5.0% to 1.1%), food processing (3.5% to 0.1%), automotive (0.9% to 0.1%), and transport and storage (1.0% to 0.3%).
- The metal and chemical industries remain the most exposed to tariff-related risks. Nonetheless, in none of the major sectors is the projected decline in exports expected to exceed 1.5%. We estimate a 1.3% drop in exports of basic metal products, 1.1% in mining, 0.9% in both chemical processing and machinery manufacturing, and 0.8% in the furniture sector.
How did we estimate the impact of tariffs? Our calculations are based on the KITE international trade model, estimated by the Polish Economic Institute and described in the publication Potential Consequences of Changes in US Tariff Policy for the Polish Economy (link). The scenarios, as of 2 April and 27 July 2025, incorporate the full set of announced tariff rates and trade agreements between the US and other global partners. In other words, we account not only for the direct effects of the EU-US agreement but also for indirect impacts resulting from changes to US tariffs on imports from the United Kingdom, China, Canada, and Mexico. The latest scenario does not factor in the proposed zero-tariff regime on selected critical goods between the EU and the US, as the detailed product list has not yet been published. As a result, the actual economic cost to Poland may ultimately prove slightly lower than our current estimates.
Aleksandra Sojka, Marcin Klucznik
A Sharp Increase in US-EU Energy Trade Seems Unlikely
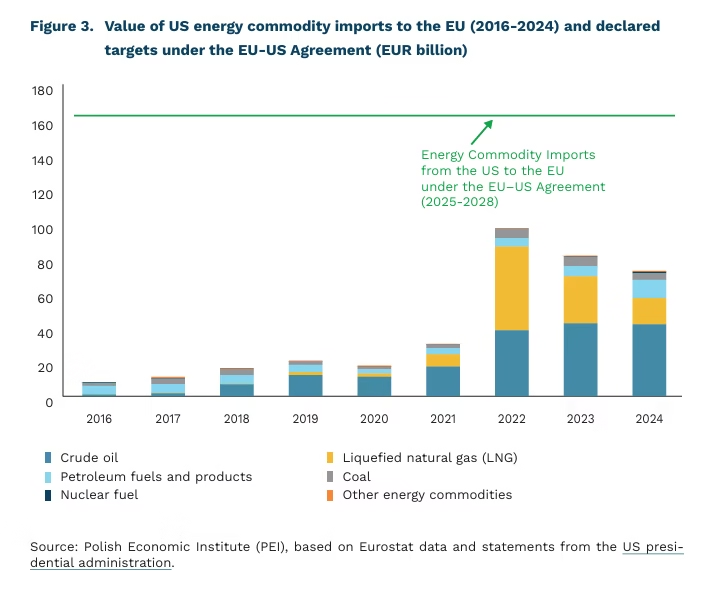
EUR 651 billion target Value of US Energy Commodities Imported by the EU (2025-2028), as Declared in the EU-US Agreement
EUR 72 billion EU Imports of US Energy Products (2024)
EUR 22 billion EU Imports of Russian Energy Products (2024)
The joint EU-US statement on the tariff agreement also includes a declaration to deepen bilateral cooperation in the energy sector. According to the US administration, one outcome of the deal is the EU’s commitment to increase imports of US energy commodities to USD 750 billion (EUR 651 billion) over 2025-2028 – equivalent to around EUR 162.8 billion annually. This would mark a dramatic reversal of the 2022-2025 trend, during which EU imports of US energy products, initially boosted by the Russian invasion of Ukraine, declined by an average of 9% per year. To meet the new target, EU imports of US energy would have to more than double from their 2024 level of EUR 72 billion. As noted by Reuters, such a steep increase in US-EU energy trade faces significant practical challenges. Politico analysts suggest that the target may only be achievable if it includes up to EUR 300 billion in nuclear investments currently being undertaken by EU member states using US technology.
In 2024, the EU’s total energy commodity imports from all sources amounted to EUR 375.9 billion, and over EUR 422.5 billion when including refined petroleum products and nuclear fuel. Imports from the United States accounted for 19% of this total, reflecting relatively modest shares in fuels (15%) and crude oil (16%), but stronger positions in gas (20%) and coal (32%). That same year, the total value of US exports of oil, gas, coal, and fuels worldwide reached EUR 318 billion. A significant increase in US exports to the EU would therefore require both sides to terminate or renegotiate several medium- and long-term contracts with third countries.
In theory, instead of redirecting existing deliveries, the United States could expand oil and gas production, as suggested by the drill baby, drill rhetoric popularised by Donald Trump. However, US crude oil output rose by only 2% in January-May 2025 compared to the same period in 2024.
In early 2025, 47% of US oil and gas companies reported reducing the scale of new drilling projects, while only 18% indicated any increase. The sector pointed to the negative impact of higher steel tariffs (32% cited rising costs) as a constraint on expansion. Investor confidence has also been dampened by low energy prices: four times as many firms planned to reduce (46%), rather than increase (11%) capital spending in 2025. Industry representatives indicated that a significant ramp-up in fossil fuel production would only be feasible at a WTI crude price of USD 83/b (compared to USD 66.7/b in July 2025) and domestic gas prices of USD 5.0/MMBTU (currently USD 3.3/MMBTU, or approx. EUR 9.8/MWh). Under these conditions, a rapid expansion of US oil and gas output appears unlikely.
European Commission President Ursula von der Leyen’s suggestion to replace Russian supplies with US energy may be seen as an attempt to make US export targets appear more achievable. In 2024, EU imports of Russian energy and fuel products totalled EUR 21.8 billion. The US-declared target of USD 750 billion (EUR 651 billion) for energy exports to the EU over 2025-2028 would be more than three times the total value of Russian imports since the start of the full-scale invasion of Ukraine in 2022 (EUR 212 billion, according to CREA). In this context, a more realistic scenario might involve a 30% yearon-year increase in US energy deliveries to the EU.
Kamil Lipiński
More EU Budget for Digitalisation
EUR 54.7 billion funding planned by the European Commission for building digital leadership in the EU (2028-2034)
3.1% share of Digital Europe Programme funds secured so far by Polish entities
Between 2021 and 2027, over EUR 200 billion will have been allocated to support digital transformation across the EU. Nearly three-quarters of this amount is sourced from the Recovery and Resilience Facility (RRF), implemented in Poland via the National Recovery Plan, with a further EUR 30 billion channelled through the Cohesion Policy. The combined budget of centrally managed programmes – Horizon Europe, the Digital Europe Programme, and the Connecting Europe Facility (CEF) – totals approximately EUR 27.6 billion (1).
The forthcoming EU financial framework is set to bring a substantial increase in digitalisation funding, particularly via centrally managed programmes. Under the proposed European Competitiveness Fund, up to EUR 54.8 billion is earmarked for the objective of digital leadership. This is complemented by EUR 16.9 billion allocated under the next Horizon Europe programme. Notably, the allocation within the European Competitiveness Fund is over five times greater than the current combined funding under the Digital Europe Programme and CEF. While the digital funding in the upcoming Horizon Europe may seem lower, it refers solely to actions targeting digital leadership; additional digital priorities from previous cycles are not yet quantifiable.
No specific digital spending targets have been set for Member States within national envelopes. However, it is worth noting that, between 2022 and 2024, digital-related spending accounted for 7.8% of expenditure from the European Social Fund, 0.1% from the Common Agricultural Policy, and 11.6% from the Cohesion Policy. According to the proposed regulations, these funds would be integrated into national plans without dedicated mechanisms for each individual objective. Nonetheless, assuming these expenditure shares remain unchanged, approximately EUR 48 billion could be allocated to digital goals by 2034.
Planned central EU funding for digital objectives is expected to increase significantly in the next financial framework, excluding allocations from the Recovery and Resilience Facility. Additional resources are also anticipated through nationally managed programmes, particularly if the current system of EU recommendations and spending negotiations is maintained. This growing emphasis on digitalisation is also reflected rhetorically, with the focus shifting from ‘digital transformation’ to ‘digital leadership’.
A shift in funding from national to centrally managed programmes could improve efficiency, leverage the EU’s scale, and foster stronger cross-border collaboration through project consortia. However, this could present challenges for some Member States. Polish entities, for example, secured only 1% of Horizon 2020 funds and around 1.5% of Horizon Europe funding to date. The performance under the Digital Europe Programme has been stronger, with Polish institutions securing EUR 61.6 million, approximately 3.1% of the total EU allocation so far. The evolving EU budget structure should therefore serve as an incentive to strengthen national capacity for accessing centrally distributed EU funding.
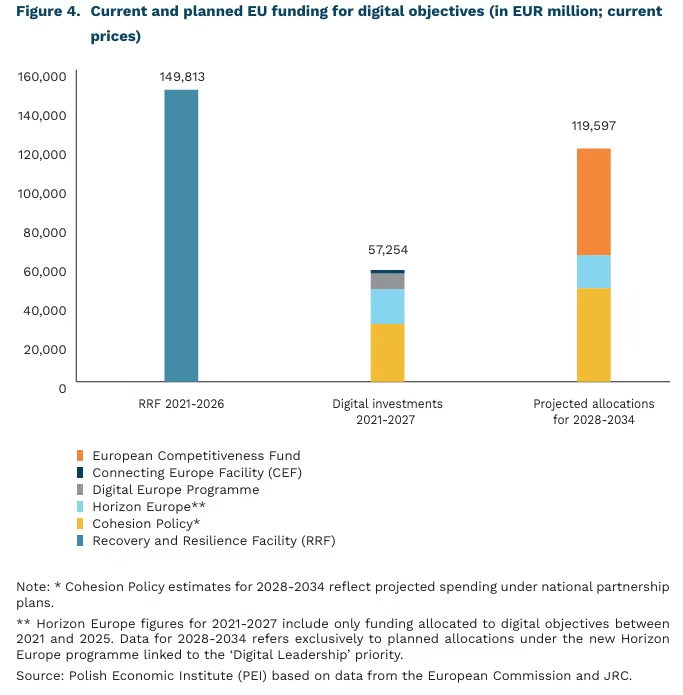
- Data for Horizon Europe cover only spending on digital objectives between 2021 and 2025.
Ignacy Święcicki
Changing the Education Model: A Path to Increasing Women’s Participation in the ICT Sector?
5% ICT specialists as a share of total employment in the EU
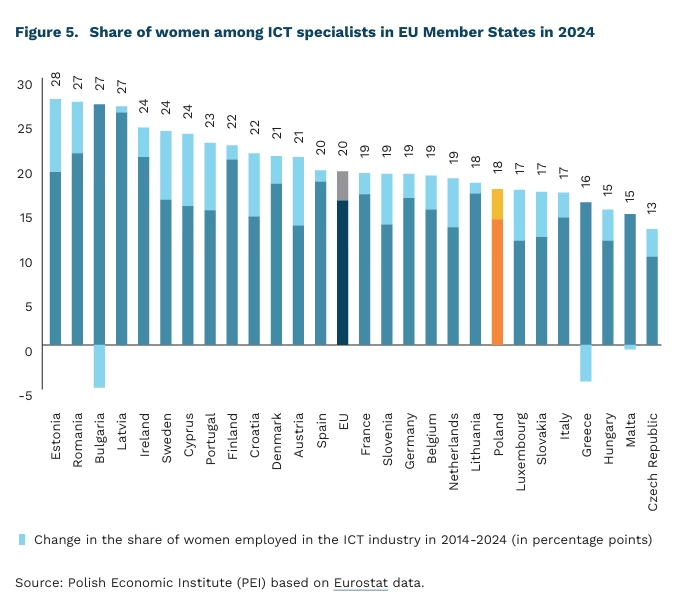
19.5% share of women among ICT specialists in the EU
#1 ranking of computer science among professions most desired by 15-year-old boys in OECD countries
The number of ICT specialists in the EU continues to grow steadily. In 2024, for the first time, their total number exceeded 10 million. Nearly three-quarters of all ICT employment is concentrated in seven countries: Germany (2.27 million), France (1.39 million), Spain (1.02 million), Italy (0.95 million), Poland (0.77 million), the Netherlands (0.68 million), and Sweden (0.45 million). ICT specialists now represent 5% of the EU workforce, up from 3.4% in 2014. In Poland, the share stands at 4.5%, compared to 2.6% a decade earlier.
Men continue to dominate ICT professions across the EU. In 2024, women accounted for just 19.5% of ICT specialists. Progress in reducing the gender gap has been slow – since 2014, the share of women has increased by only 3.3 percentage points. Leading the way are Estonia and Cyprus, with gains of over 8 percentage points. In Poland, women make up 17.5% of ICT specialists, below the EU average, though the rate of improvement – +3.4 pp since 2014 – is broadly in line with the EU trend.
Closing the gender gap in ICT employment across the EU could yield significant economic and social gains. If the share of women increases to around 45% by 2027, EU GDP could rise by an estimated EUR 260-600 billion. Gender-diverse teams are also more likely to create better and more inclusive digital solutions.
The underrepresentation of women in ICT roles largely stems from educational choices made during adolescence. Among the top ten career aspirations of 15-year-old girls in OECD countries, none relate to ICT. Meanwhile, the role of computer specialist has consistently ranked first among boys (7.9% in 2002; 8.7% in 2022). These preferences are reflected in higher education trends: according to RAD-on data, the share of women in ICT-related university programmes in Poland between 2019 and 2023 remained at just 13-15%.
Public policy initiatives at both EU and national levels aim to address this gap by encouraging girls and women to pursue ICT education and careers. At the EU level, these include awareness campaigns, mentoring and networking opportunities, as well as training programmes, internships, and scholarships. In Poland, notable initiatives include the social campaigns Dziewczyny na politechniki! (Girls to Technical Universities!), Dziewczyny do ścisłych! (Girls into STEM!), and the IT for SHE mentoring programme. In May 2025, gender equality task force in ICT was launched, bringing together stakeholders from government, academia, NGOs, and industry.
Effective examples can also be found in countries that have significantly increased female ICT employment in recent years. Estonia’s Unicorn Squad is a network of tech clubs for girls aged 8-14. In Portugal, Technovation Girls Portugal teaches girls aged 8-18 how to use technology to address social challenges. Cyprus’s CCS-Women initiative offers mentoring, workshops, networking events, and showcases of successful women in ICT.
Cezary Przybył
Summer Surge in Waste Generation Could Drive Circular Economy Development
367 kg municipal waste generated per capita in Poland in 2023
PLN 1,100+ annual waste collection fee per capita in Karpacz (2023)
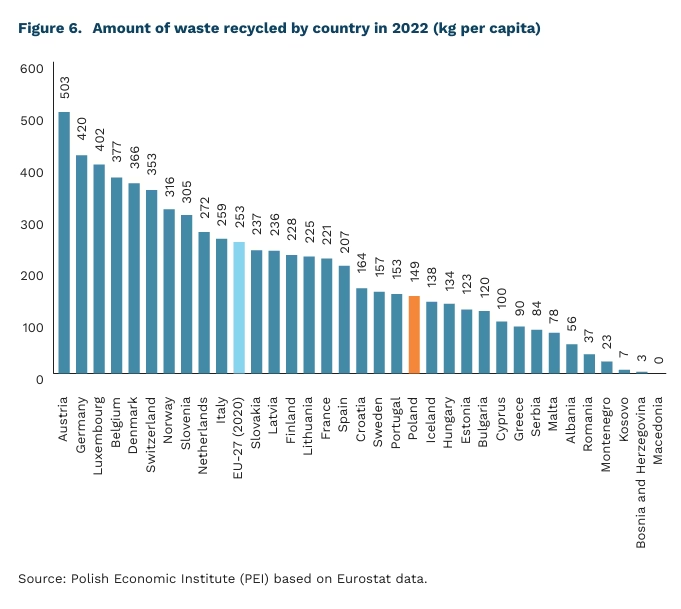
41% share of municipal waste recycled in Poland in 2022
During the summer season, tourist cities and regions across Poland experience a significant increase in municipal waste, driven by a surge in visitor numbers and higher consumption levels. Although Statistics Poland (GUS) does not provide data specifically on tourist-generated waste, its Environmental Protection 2024 report highlights this issue. A clear correlation between the holiday season and increased waste generation in tourist destinations is evident in both local authority reports and industry analyses.
The main indicators of the strain placed on local waste management systems by tourism include more frequent waste collection and rising household charges. For example, in Darłowo, the frequency of waste collection increases several times during the high season. Zakopane estimates that tourists account for more than 25% of total annual waste, with volumes rising by up to 50% during the summer months. This has a direct impact on household charges: in 2023, the national average waste collection fee per person was PLN 752, while in Karpacz it exceeded PLN 1,100. Taking tourist-generated waste into account, Karpacz – home to just over 4,000 residents – recorded 1,247 kg of waste per person. In contrast, in typical non-tourist municipalities, this figure ranges from 200 kg to 340 kg per person.
According to the latest Eurostat data, EU residents generated an average of 511 kg of municipal waste per capita in 2023, of which only 48% was recycled (including material recycling and composting). Poland compares relatively well in this regard: in 2023, 367 kg of municipal waste was generated per capita. In 2022, 365 kg was produced per person in Poland, of which 149 kg was recycled – just under 41%, according to Eurostat.
Transitioning to a circular economy has become a key priority for the development of Poland’s waste management system. Effective waste handling – through selective collection, recycling, and material reuse – is essential not only for the sustainable use of natural resources but also for driving long-term economic growth. The Global Waste Management Outlook 2024 underscores the need to reframe waste not as a burden, but as a valuable resource. In addition to recycling, emphasis should be placed on producing reusable goods and extending product lifespans – principles that should be reflected in local business models. The report calls for a shift from the traditional linear model of ‘take – use – discard’ to a closed-loop system for materials and resources at the city and regional levels. Across Poland, municipalities are increasingly pursuing structural solutions to address waste challenges, including support for innovative recovery investments, digital monitoring of waste flows, and the implementation of economic instruments to reduce waste generation at the source. According to The Circular Economy in Cities and Regions of the European Union (OECD 2025), the circular economy also offers substantial economic and social benefits. By 2030, up to 2.5 million new jobs could be created across the EU in sectors such as recycling, repair, and reuse.
Katarzyna Zybertowicz
Broadcasting films with subtitles instead of voice-over or dubbing improves the level of English proficiency in society
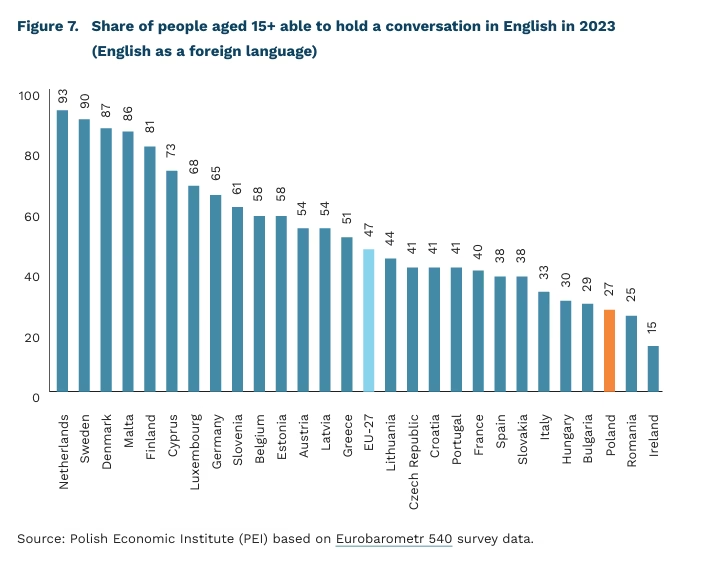
27% Poles aged 15+ declare they can hold a conversation in English
47% EU residents aged 15+ declare they can hold a conversation in English
53% Poles aged 15+ prefer to watch foreign-language films and programmes with subtitles
Proficiency in English is a vital skill in today’s globalised world. It facilitates international cooperation, trade, and access to global culture and information. It also plays a key role in professional life – studies from Poland, Germany, and other EU countries show that individuals with English language skills tend to earn more.
In Poland, 27% of those aged 15 and over say they speak English well enough to hold a conversation, compared to an EU average of 47%. The highest levels of English proficiency are reported in the Netherlands, Sweden, Denmark, and Malta, where over 85% of residents can hold a conversation in English. Among countries where English is not an official language, only Romania reports a lower share than Poland, at 25%.
Differences in foreign language proficiency across societies are often attributed to national education systems. However, recent research shows that informal learning methods can be also effective. A seemingly simple historical decision, whether to broadcast foreign films with subtitles, dubbing, or voice-over, continues to have a significant impact on English language proficiency today.
According to the study, had Poland historically opted for subtitles rather than voiceover, English proficiency in the country could now rival that of Scandinavia. Subtitled content is common in countries such as the Netherlands, Portugal, Romania, the Nordic states, and much of the Balkans. Meanwhile, dubbing or voice-over is the norm in France, Italy, Spain, Germany, and many Central and Eastern European countries. Larger countries often choose dubbing due to their ability to absorb the additional costs, but the study finds that population size does not account for the observed differences in language skills.
Polish preferences are shifting rapidly: today, a majority prefer to watch foreign-language films and programmes with subtitles (53%) rather than dubbing (42%). Back in 2012, nearly 60% favoured dubbing, while just 36% preferred subtitles. Given the educational benefits and lower costs, it may be time to consider aligning audiovisual policy with current public preferences.
Marta Palczyńska