Economic Weekly 33/2025, August 22, 2025
Published: 22/08/2025
Table of contents
Economic Weekly 34_2025_wykres 6
16,000 Number of AI and STEM labs to be established in Polish schools by the end of the 2025/2026 school year
59% Share of PISA 2022 students attending schools without problems accessing digital resources
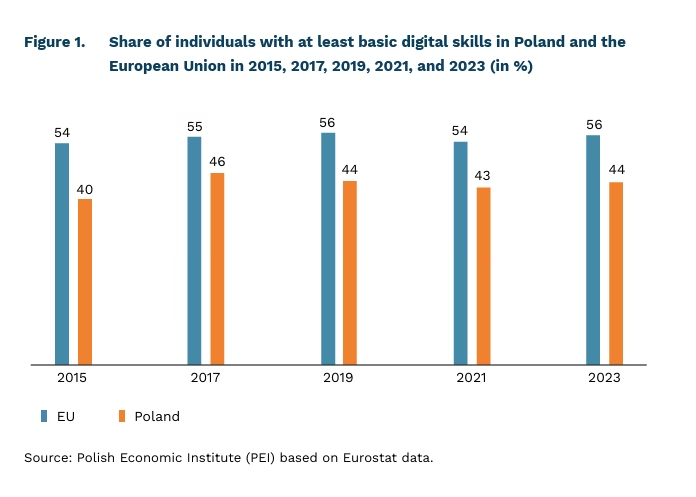
44% Share of individuals aged 16–74 with at least basic digital skills in 2023
By the end of the 2025/2026 school year, 16,000 artificial intelligence (AI) laboratories and STEM (science, technology, engineering, and mathematics) labs will be introduced in primary and secondary schools. The initiative, announced by the Ministry of Digital Affairs, is part of the digital transformation of education and is financed through the National Recovery and Resilience Plan and the state budget. Its goal is to strengthen the digital competences of students and teachers, improve preparedness for the challenges of the modern labour market, and narrow the gap with other European Union countries.
According to PISA 2022, school principals of institutions attended by 59% of surveyed students reported no difficulties in accessing digital resources. However, 52% of students studied in schools with low-quality equipment, highlighting significant disparities in provision. ICT resources were used mainly in computer science classes, less often in mathematics and science. In these subjects, a larger proportion of Polish students reported not using digital tools than their peers in most other participating countries. While the majority of Polish students evaluated school ICT resources and teachers’ digital competences positively, their ratings were below the international average. The lowest scores were recorded for the attractiveness of learning with ICT resources, where Poland lagged behind by up to 20 percentage points compared with other countries.
Investments in AI and STEM labs are aligned with European Union priorities. Under the Union of Skills, the European Commission set the target that by 2030 the share of individuals with low proficiency in reading, mathematics, science, and digital skills should fall below 15%. Digital skills remain one of the key challenges for Poland. In 2023, only 44% of people aged 16–74 had at least basic digital competences (EU average – 56%), according to the Digital Decade 2025 Country Report. Poland slightly exceeds the EU average only in information and data literacy (82.1% and 81.7%, respectively), but performs significantly worse in digital security (54% and 70%, respectively).
Polish schools need modern infrastructure and sustained investment in the competences of both students and teachers. AI laboratories and STEM classrooms will enable young people to navigate a world increasingly shaped by technology, artificial intelligence, and innovation. This is a crucial step towards ensuring equal educational opportunities, narrowing the gap with the European Union, and preparing future generations for the labour market. These initiatives support the development of future-oriented skills such as critical thinking, problem-solving, collaboration, and adaptive learning. Introducing new tools into schools is not only an investment in education but also in the long-term competitiveness of the Polish economy.
Aleksandra Wejt-Knyżewska
Sharp Increase in Demand for Housing Loans in Poland
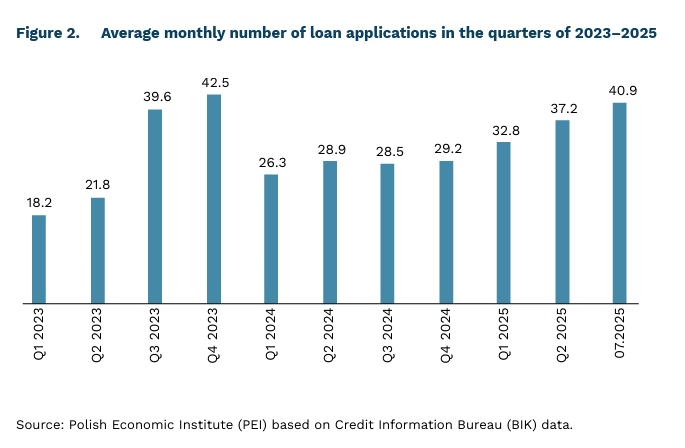
40,400 Number of individuals who applied for a housing loan in July 2025
33.7% Year-on-year increase in the number of loan applications in July 2025
1.7% Year-on-year increase in transaction prices of secondary market apartments in the seven largest cities
In July 2025, demand for housing loans rose sharply. According to data from the Credit Information Bureau (BIK), 40,400 individuals applied for a mortgage loan, an increase of 33.7% compared with the previous year. The BIK demand index, which adjusts for the number of working days, shows an even higher year-on-year growth of 45.5%. On a monthly basis, the number of loan applications increased by 9.3% compared with June 2025.Such a high number of applications has not been recorded since the third quarter of 2021, when low interest rates prevailed, except for the fourth quarter of 2023, when demand was artificially boosted by the “Safe Loan 2%” programme. In the coming months, the number of applications is likely to remain at a similar level or continue to grow.
The increase in demand for housing loans stems from three main factors that have boosted household credit capacity.
- First, in 2025 the Monetary Policy Council lowered the reference rate twice, by 50 basis points in May and by another 25 basis points in July. These were the first cuts after nineteen months of stable rates, which may have encouraged many borrowers to apply for a mortgage. Moreover, with inflation at 3.1% in July 2025 and projections of low inflation until the end of the year (in line with the National Bank of Poland’s inflation target), markets expect further rate reductions – potentially down to 4.5% by year-end.
- Second, housing prices are rising more slowly than in previous quarters and are even declining in some cities. According to transaction price data from the National Bank of Poland, in the second quarter of 2025 prices in the secondary market of the seven largest cities1 rose by 1.7% year on year, while in the ten other regional capitals they increased by 4.6%. In the primary market, prices rose by 2.2% and 3.7%, respectively. By contrast, in mid-2024 secondary market prices were increasing by almost 20%. It should be noted that the Q2 2025 data do not yet reflect the impact of the May rate cut, as they cover the period from March to May.
- Third, wages are rising in both nominal and real terms. In the first half of 2025, the average gross wage in the enterprise sector (companies with at least ten employees) was 8.7% higher than a year earlier. With inflation only slightly above the NBP’s target, the real purchasing power of wages increased by 4.2% year on year in the first half of 2025.
Most banks confirm rising demand for mortgage loans. An NBP survey conducted among 23 banks, representing around 90% of the market, showed that 74% reported a year-onyear increase in the number of applications. At PKO BP, the largest bank in Poland, the value of the mortgage loan portfolio at the end of the first half of 2025 was 9.9% higher than a year earlier, while new sales in the second quarter reached PLN 7 billion, marking a 48% year-on-year increase.
Tomasz Mądry
Oil and Cars as Poland’s Main Import Hits in the First Half of 2025
+5.3% Year-on-year growth in the value of Poland’s imports in the first half of 2025
+34% Year-on-year increase in imports of computers and other data storage devices in the first half of 2025
39% Share of imports in the first half of 2025 originating from Germany, China, and the United States
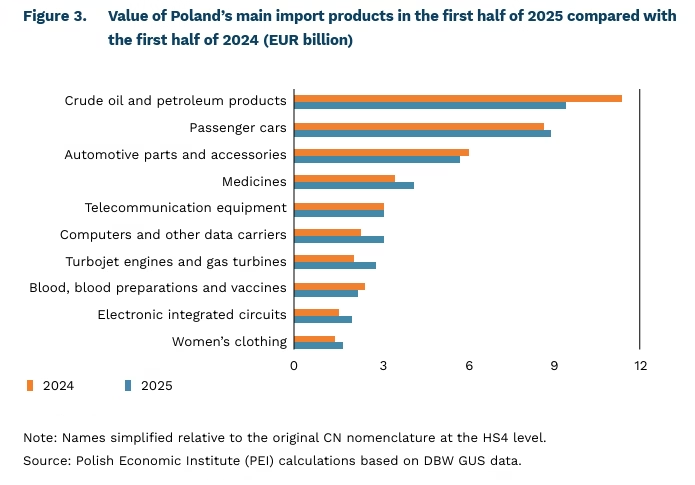
In the first half of 2025, the value of Poland’s imports reached EUR 182 billion, an increase of 5.3% compared with the same period in 2024. Import growth outpaced exports, which rose by 1.6%. Poland recorded a trade surplus only in June, while the trade balance had remained negative since November 2024.
Fuels, passenger cars, and parts remain Poland’s main import categories. Imports of crude oil and derivatives amounted to EUR 9.4 billion in the first half of 2025, representing 5.2% of total imports. This was 17% lower than a year earlier, mainly due to price effects, alongside a 6.5% year-on-year decline in volume. Imports of passenger cars, by contrast, rose by 3.1% year on year to nearly EUR 9 billion, driven in part by a 4.4% increase in volumes. Imports of car parts and accessories fell by 5.5%, with their value amounting to EUR 5.75 billion. Taken together, these three categories accounted for 13% of the country’s total imports.
Imports of medicines, computers, and other data storage devices rose sharply in the f irst half of 2025. The value of medicine imports increased by 18.1% year on year, reaching EUR 4.17 billion. Imports of computers and data storage devices surged by 34%, while imports of telecommunication equipment remained relatively stable at EUR 3.13 billion, despite an 8.7% decline in volumes.
Germany (20% of total import value) and China (14.7%) remained Poland’s leading import partners in the first half of 2025, together accounting for more than one-third of total imports. Imports from China rose by 16% year on year – one of the highest growth rates after South Korea, Vietnam, and Denmark – while imports from Germany increased by just 2%. The import structure in both cases was highly diversified, with the largest product categories accounting for no more than 2–4% of total value. From Germany, imports were dominated by petroleum products and automotive goods, whereas from China the main items were electronics such as smartphones and laptops. Since 2024, the United States has been Poland’s third most important source of imports, with a 5% share of total value. Unlike Germany and China, the structure of U.S. imports is more concentrated: three categories dominate: turbojet engines and parts (16.4%), natural gas(2) (around 13%, more than doubling in value year on year), and petroleum products (7.6%). (
2. Data on natural gas imports are not published by Statistics Poland (GUS), but according to U.S. data natural gas accounted for 12.2% of total exports to Poland.
Piotr Palac
Developed Countries Continue to Attract the Majority of Investment in the Digital Economy
USD 360 billion Global value of new digital economy investments in 2024
40% Share of new global digital economy investments attracted by developing countries between 2020 and 2024
USD 39 billion Investment in ICT infrastructure in developed countries between 2020 and 2024
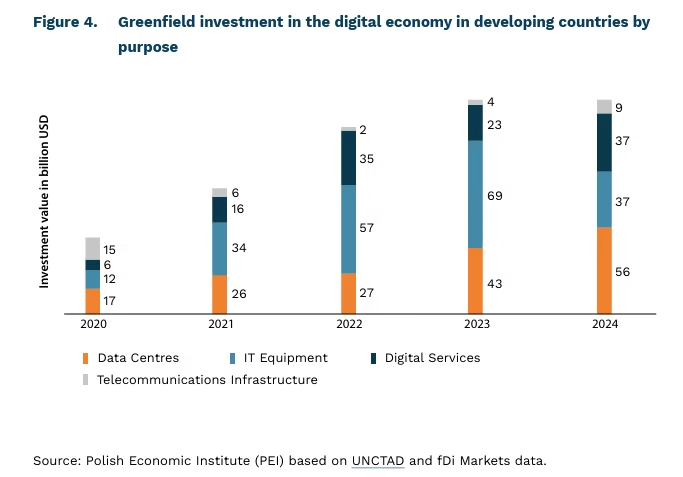
In 2024, announced greenfield foreign direct investment (FDI) in the digital economy worldwide reached USD 360 billion. In earlier years, the levels were considerably lower even in the record year of 2022, they totalled USD 302 billion. The share of digital economy projects in overall FDI increased by 10 percentage points year on year to 28%. Between 2020 and 2024, global investment in the sector amounted to USD 1.313 trillion, representing about one-quarter of all FDI.
Developing countries captured USD 531 billion of this total, or roughly 40% of global digital economy investment during 2020–2024. More than 60% of these flows were concentrated in Southeast Asia, including India, Malaysia, Indonesia, Singapore, Vietnam, and China. In 2024 alone, greenfield investment in digital services reached USD 37 billion – five times higher than in 2020 – while investment in data centres tripled to USD 56 billion. Between 2020 and 2024, developing Asian economies attracted more than 35% of global greenfield investment in digital services, signalling a shift towards higher-value segments such as artificial intelligence and fintech products.
Between 2020 and 2024, the majority of digital economy FDI originated in developed economies. One-third of projects in developing countries – worth USD 193 billion – came from the United States. At the same time, a growing share of greenfield FDI in the “Global South” has been driven by other economies in the region, particularly China and Taiwan. Between 2022 and 2024, mutual greenfield FDI accounted for 21% of all such projects, while in the digital economy the share was as high as 40%.
Developed economies also remained the principal destination for new ICT infrastructure investment. Between 2020 and 2024, they attracted USD 39 billion, more than half of global funding for this segment. Developing economies received USD 36 billion, of which USD 14 billion went to emerging Asian and Oceanian countries, USD 12 billion to Latin America and the Caribbean, and USD 10 billion to Africa. European firms were the leading investors in ICT infrastructure in developing countries, responsible for 26% of total projects. Telecommunications accounted for as much as 79% of ICT infrastructure investment in developing economies.
Piotr Palac
Agrivoltaics Hold Significant Development Potential in Polish Farms
180 GW Potential installed capacity of agrivoltaic systems in Central European countries (Poland, Slovakia, Czechia, Hungary)
2 Number of agrivoltaic installations currently operating in Poland
10.2 GW Installed capacity of agrivoltaic systems in the United States
Ground-mounted photovoltaic farms are becoming an increasingly common source of solar power generation in Poland. According to data from the Energy Market Agency (ARE), their installed capacity(3) reached 2.8 GW at the end of June 2025, accounting for 12% of the country’s total solar PV capacity. Although the potential for further development remains high, expansion is constrained by barriers such as limited land availability for new installations. Over time, this is likely to push developers towards alternative models of photovoltaic systems, with agrivoltaics emerging as one of the most promising solutions.
Agrivoltaics is an increasingly popular model of solar development in which photovoltaic installations are placed directly on agricultural land. This approach allows crops to be cultivated and/or livestock to be grazed alongside PV structures, addressing the challenge of competition for land between renewable energy and farming.
A major benefit of agrivoltaic systems is their potential to provide farmers with an additional source of income through the sale of generated electricity. They can also support the cultivation of shade-tolerant crops, enable the use of low-yield land (including wasteland), and in some cases contribute to water savings and improved soil quality. At the national level, agrivoltaics can strengthen Poland’s many local agricultural economies while supporting the decarbonisation of farming.
According to SolarPower Europe, there are currently two agrivoltaic installations in Poland – one near Zgorzelec and another in the vicinity of Wielka Wieś4 – with a combined capacity of less than 50 MW (as of May 2024). For comparison, Europe has more than 200 such projects with a total capacity exceeding 2.8 GW, while in the United States there are over 600 with more than 10 GW of installed capacity. Ember estimates the potential installed capacity of agrivoltaics in Central Europe (Poland, Czechia, Slovakia, and Hungary) at 180 GW.
Despite this potential, agrivoltaics in Poland faces several barriers. These include the absence of regulations tailored to such installations and higher investment costs compared with conventional ground-mounted photovoltaic farms. Additional obstacles include the absence of an assessment of Poland’s agrivoltaic potential and a national plan for reducing emissions in agriculture.
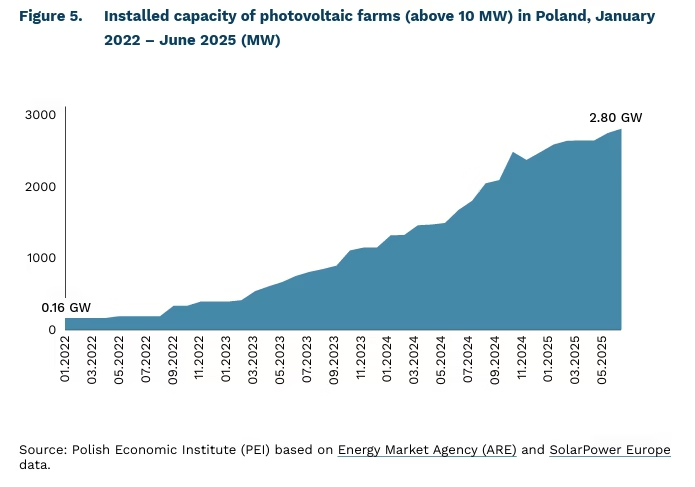
3. Data refer to photovoltaic installations with a capacity above 10 MW.
4. The first is dedicated to the cultivation of wild garlic, while the second operates as a bee apiary.
Wojciech Żelisko
Macroeconomic Effects of Higher Defence Spending in the EU
+0.1 pp Projected annual boost to euro area GDP growth in 2026–2027 from higher defence spending (ECB)
Higher defence expenditure is expected to support Europe’s economic growth. According to the European Central Bank (EBC), additional outlays will raise the annual growth rate of the euro area economy by 0.1 percentage points in 2026–2027. The effect on HICP inflation is projected to remain limited, given the absence of a direct link to the prices of goods included in the inflation basket. In the most optimistic scenario, GDP growth in 2027 could increase by 0.4–0.6 percentage points, assuming a stronger focus on investment and full debt financing. While debt financing dampens demand less in the short term than rapid tax increases, it eventually raises the cost of debt servicing. The macroeconomic impact of defence spending therefore depends on the state of the business cycle and on whether the economy has sufficient capacity to translate higher expenditure into real output.
Research indicates that additional defence spending does not always contribute to GDP growth. Redirecting budget resources from other sectors to defence can weigh on economic development. Growth may also be constrained by a high share of imports and a tight labour market, where available jobs outnumber unemployed workers. For the European Union, it is therefore crucial that as much procurement as possible takes place within the single market. Another challenge is the fragmentation of demand at the EU level, which reduces spending efficiency. Joint procurement and coordinated supply chains could provide a relatively straightforward way to optimise expenditure and enhance economic growth.
Defence spending can support growth and productivity, but only if programmes are well designed. The most important condition is that spending takes an investment-oriented form, directed towards modernisation and infrastructure development. Lasting economic effects occur when, alongside equipment purchases, investment also builds workforce skills (such as engineering and programming) and research and development outcomes have civilian applications. Such projects generate positive spillovers, raising productivity beyond the defence sector and providing a stronger stimulus for the wider economy. From this perspective, the efficiency and prioritisation of spending are as important as its scale – well-designed investment programmes deliver the greatest benefits.
Piotr Kamiński
Playing at Home Helps Win Basketball Games
With EuroBasket – the European Basketball Championship hosted by Poland – beginning at the end of August, we take a closer look at whether athletes perform better when playing at home.
A meta-analysis of 40 academic studies confirms that home-court advantage significantly increases the likelihood of victory in professional basketball. The effect is evident in both U.S. and European leagues, though its magnitude and causes differ. It tends to be stronger at lower levels of competition and among less experienced players, and it also varies between European countries. Match context matters: home advantage is less pronounced in playoff games than during the regular season. The effect also differs by position – point guards and shooting guards benefit more from home games than forwards and centres.
In the NBA, historical data show that home teams have won about 63% of games – slightly more than in American hockey but less than in soccer. In the EuroLeague, the share of home wins is even higher, at around 66 %.
Home-court advantage is driven by several factors:
- crowd support, which plays a greater role in European than in American club competitions;
- familiarity with the arena, such as background colours, distances, and acoustics;
- pressure on referees, who under intense crowd noise may subconsciously shy away from unfavourable calls against the home team;
- and the absence of travel, allowing players to prepare at home rather than in hotels.
The pandemic also altered the dynamics of home advantage. During the months of games played without spectators, its strength diminished. An analysis of tens of thousands of matches from ten European national leagues found that home-court advantage fell by 5 percentage points in post-pandemic seasons.
For international tournaments such as the World and European Championships, evidence is scarce. Researchers suggest that home advantage in national team competitions is often weaker, or even neutralised. Matches are typically played in arenas where neither the visiting side nor most home players normally compete. Tournament conditions also reduce travel demands, as teams spend weeks in one location and can train in the same venues where they play. For these reasons, Poland should not expect its home arenas to provide a decisive advantage in def
Łukasz Baszczak