Economic Weekly 36/2025, September 12, 2025
Published: 12/09/2025
Table of contents
European Exporters to Benefit from the EU–Mexico Agreement
1st Mexico’s rank among EU export destinations in Latin America in 2024
Approx. 9% share of Mexico’s imports supplied by the EU in 2024
15% share of EU foreign direct investment (FDI) in Mexico in 2024
On 3 September 2025, the European Commission approved the modernised EU–Mexico Global Agreement, alongside the deal with Mercosur. Talks to update one of the EU’s oldest trade accords, originally signed in 2000, began in 2016 and concluded in early 2025. The agreement now awaits ratification by the EU Council and the European Parliament. The closer partnership with Mexico reflects the rising importance of services, particularly digital services, which were absent from the 2000 agreement, as well as the EU’s strategic goal of diversifying its trade partners. It is also a response to the protectionist stance of the United States and China’s expanding presence across Latin America. The modernised agreement lifts restrictions in agri-food trade, services, and public procurement, while adding new provisions on digital trade and data protection.
The EU–Mexico agreement will deliver clear benefits for European farmers. Mexico is a net importer of food products from the EU, recording a trade deficit of USD 643 million in 2024. Mexican agri-food exports go mainly to the United States (81% w 2024). The previous EU–Mexico agreement focused largely on non-agricultural goods. The updated version eliminates 45% tariffs on European eggs and pork, as well as 20% tariffs on pasta, chocolate and confectionery, blue cheese, potatoes, apples, and canned peaches. It also introduces duty-free quotas for milk (50,000 tonnes), dairy products (13,000 tonnes), beef (30,000 tonnes), and chicken legs (20,000 tonnes), which will be phased in gradually. Import procedures will be simplified, and protection against imitation extended to 568 European food and drink products.
The modernised agreement also secures better access to Mexican critical raw materials. Mexico is a key supplier of fluorspar (one-third of global deliveries to the EU), manganese, and copper. In 2024, it accounted for 11% of global strontium production, 4% of baryte, 1% of antimony, 0.2% of phosphate rock, 0.1% of natural graphite, and smaller shares of coking coal, feldspar, and lithium.
For Mexico, the agreement is an opportunity to attract additional European investment. The European Union is the second largest source of foreign direct investment in Mexico after the US, accounting for 15% of total FDI in the country in 2024. EU FDI in Mexico amounted to USD 5.7 billion, mostly from Germany and the Netherlands. Under the new agreement, Mexico is required to create more favourable conditions for European investors, aligning with President Claudia Sheinbaum’s Plan México.
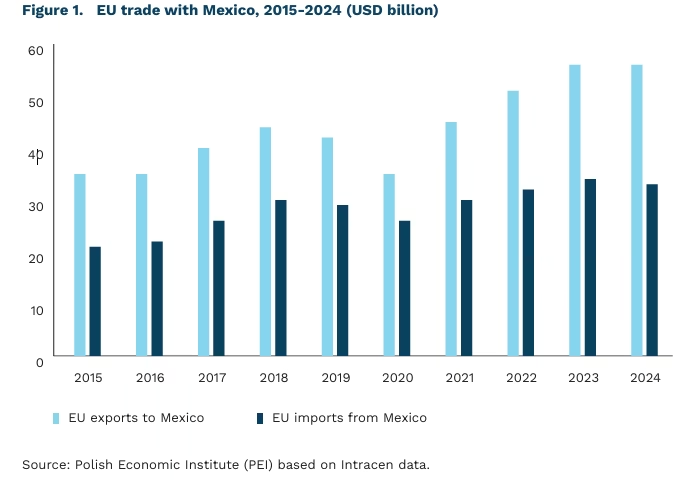
Mexico is already a major market for European goods. It is the largest buyer of EU products in Latin America and the eighth worldwide. For years, EU exports have represented approx. 9% of Mexico’s total imports. In 2024, EU exports to Mexico reached approx. EUR 52 billion (Intracen data), mainly from Germany and Spain and concentrated in industrial goods. EU imports from Mexico, by contrast, were more than one-third lower at approx. EUR 31 billion. For Poland, Mexico is likewise the most important Latin American export market, although its share is modest at approx. 0.3% of total Polish exports. Even so, stronger EU–Mexico relations are indirectly important for Poland through its close links with German and US markets (via Mexico) and through the opening of Mexico’s agri-food market.
Katarzyna Sierocińska
Shanghai Cooperation Organisation Could Reshape the Balance of Power in the Global Internet and Technology
77% share of the population in SCO member states currently using the internet
4 times number of internet users in SCO countries compared with Western countries
USD 130 billion AI investment by China and India in 2024, equal to 28% of US investment
The Shanghai Cooperation Organisation (SCO) summit, held in Tianjin, China, and concluded on 1 September, highlighted closer alignment between China, Russia, and India. Beyond geopolitics, the organisation’s growing role could have far-reaching implications for the global digital economy. The final declaration included a pledge to jointly advance artificial intelligence, including the establishment of a new institution dedicated to AI research and promotion.
The 10 SCO member states account for roughly 3.4 billion people, of whom 77% are already online. In the context of existing and widening digital divides, this bloc represents more than three times the number of current and potential internet users in all Western countries combined(1). When the 14 observer states that also attended the Tianjin summit, including Indonesia, Turkey, and Malaysia, are taken into account, the population represented is four times larger than that of the West.
So far, investment in advanced technologies outside of China has not been a hallmark of SCO countries. This picture, however, is changing rapidly. Among the world’s 2,000 companies with the highest R&D spending, 541 now come from countries represented at the Tianjin summit, up from 433 five years ago, though this increase is entirely driven by Chinese firms. In terms of AI spending, the US invested approx. USD 471 billion, compared with USD 119 billion in China and USD 11 billion in India.
Demographic change and the economic development of these countries could radically reshape the current balance of power in the global internet and technology. As the oft-repeated mantra goes, data is today’s most valuable resource, and large populations combined with technologically advanced societies provide vast reserves of this commodity. Still, joint meetings and leaders’ declarations do not guarantee smooth cooperation in the digital sphere. Not long ago, India blocked Chinese apps for its users on security grounds. Yet shifting geopolitics and intensifying rivalry among major powers may draw Delhi closer to solutions promoted by Beijing.
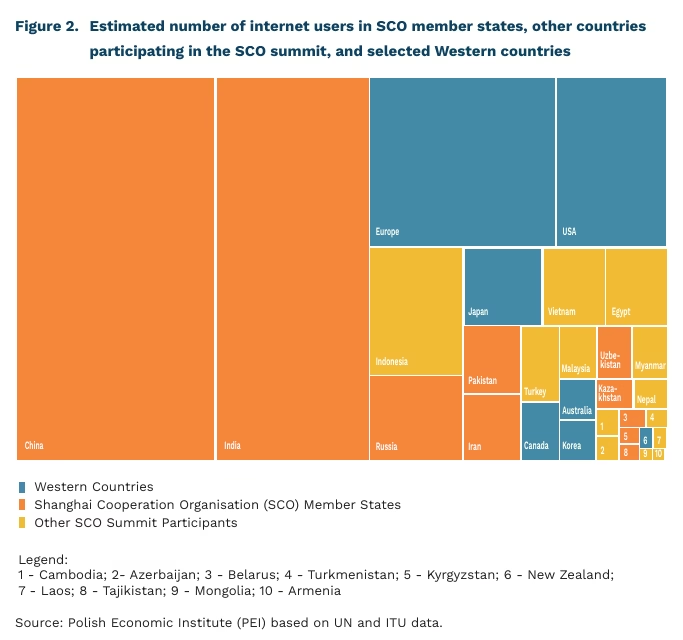
- This bloc includes the US, European countries (excluding Turkey and Russia), Japan, Canada, South Korea, Australia, and New Zealand.
Ignacy Święcicki
Business Barriers Are Becoming Less Burdensome for Enterprises
3.18 average rating of business barriers in September 2025
51% share of firms reporting labour shortages in September 2025
-9 pp. month-on-month decline in the share of firms reporting payment backlogs in September 2025
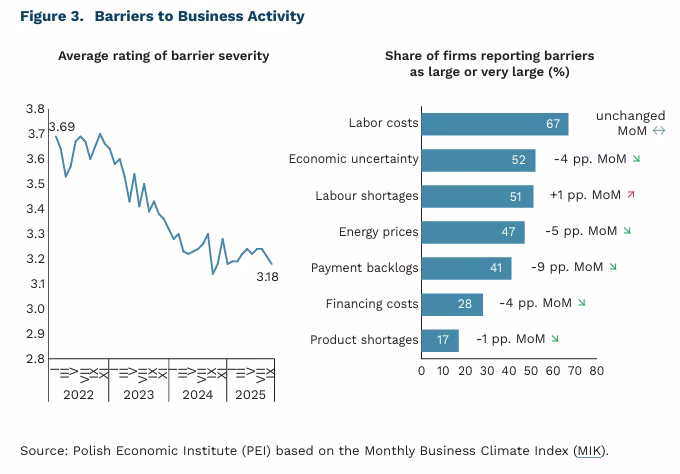
The average rating of business barriers stood at 3.18 in September 2025, according to the Monthly Business Climate Index (MIK) survey conducted by the Polish Economic Institute. This is the lowest value recorded in 2025 and the second-lowest since measurements began (after 3.14 in September 2024). In January 2022, the index stood as high as 3.69. September also marked the third consecutive month of decline in the average rating of barriers. Perceptions of business obstacles vary by firm size and sector. In September, the highest ratings came from large enterprises (3.46) as well as manufacturers (3.38) and firms in the transport, freight and logistics sector (3.34). By contrast, barriers were perceived as least burdensome by small firms (3.06) and by service providers (3.09).
For the past two years, the main barrier to business activity has been labour costs, cited by two-thirds of enterprises in September. The second most common obstacle was economic uncertainty (reported by 52% of firms), followed by labour shortages (51%). This latter barrier has become increasingly burdensome in recent months and is now perceived as more disruptive than rising energy prices (47%).
In September 2025, compared with the previous month, the share of firms reporting most business barriers declined. The steepest month-on-month decreases were in complaints about payment backlogs (-9 pp.) and rising energy prices (-5 pp.). Noticeably fewer firms also cited higher financing costs (-4 pp.), while slightly fewer pointed to product shortages (-1 pp.). The only barrier to edge up month-on-month was labour shortages (+1 pp.), while the share of firms reporting rising labour costs remained unchanged.
Labour shortages are becoming an increasingly significant barrier to business operations. Poland’s unemployment rate is among the lowest in the EU, yet the pool of available workers is shrinking. Poland is also one of the fastest-ageing countries in the EU, meaning that the workforce will contract further in the coming years – partly due to retirements, and partly because younger people are increasingly reluctant to take up manual, care-related, or craft professions. At the same time, discrimination against older workers and people with disabilities remains evident. To prevent labour market strains, it will be essential to activate excluded groups, increase investment in automation and technology, and draw on foreign labour resources.
Anna Szymańska
Poland Has One of the Largest Gender Gaps in Life Expectancy in the EU
7.5 years life expectancy gap between women and men in Poland in 2023
5.3 years average life expectancy gap between women and men in the EU in 2023
9.6 years life expectancy gap at age 30 between women and men with lower secondary education in Poland in 2022
5.6 years life expectancy gap at age 30 between women and men with higher education in Poland in 2022
On average, women live longer than men – a phenomenon observed in all developed 7.5 years life expectancy gap between women and men in Poland in 2023 5.3 years average life expectancy gap between women and men in the EU in 2023 9.6 years life expectancy gap at age 30 between women and men with lower secondary education in Poland in 2022 5.6 years life expectancy gap at age 30 between women and men with higher education in Poland in 2022 PEI Economic Weekly September 12, 2025 countries since the end of World War I. The gender gap in life expectancy widened steadily across the Western world until the 1970s, when it began to narrow. In 2023, women’s life expectancy exceeded 80 years in all European countries except Bulgaria and Hungary, and often approached 85 years. For men, the range was 72 to 82 years.
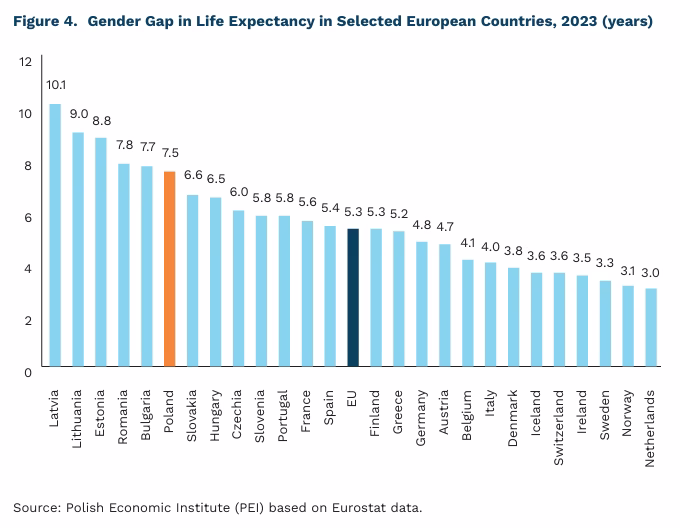
In Central and Eastern Europe, the gender gap in life expectancy is markedly wider than in Western Europe. According to Eurostat data, in 2023 the largest disparities were recorded in the Baltic states – over 10 years in Latvia, and around 9 years in Lithuania and Estonia. Poland ranked sixth in Europe with a gap of 7.5 years. For comparison, the EU average was 5.3 years, and no Western European country exceeded 6 years. Leaders such as the Netherlands and Norway recorded differences of only 3 years.
A cross-country analysis of five Western European and five Central and Eastern European states points to three main drivers of the gender gap in life expectancy: cancer, heart disease, and external factors. External factors include workplace injuries, violence, accidents, and suicides. The authors note that in Poland, unlike in the other countries studied, cancers play only a minor role in explaining the gap. External factors also include excessive alcohol consumption and smoking, which increase the prevalence of heart disease compared with abstainers and non-smokers.
The National Institute of Public Health confirms these findings and stresses that educational attainment is another key determinant of life expectancy. In 2022, the gender gap in life expectancy at age 30 was 9.6 years among people with lower secondary education and 5.6 years among those with higher education. The Institute also highlights the role of alcohol: in 2022, male mortality in Poland from alcohol-related health problems was more than twice as high (+114%) as the EU-27 average, while female mortality was +89% higher. Moreover, in 2023, suicide – the second most common cause of death among men aged 15-44 – accounted for more potential years of life lost than lung cancer, cerebrovascular disease, or heart attacks.
Looking ahead, the gender gap is likely to widen. In Poland, half of women aged 19-34 pursue higher education, compared with only around 30% of men. This is one of the largest gender gaps in education in Europe and, as the studies cited above show, higher education is one of the most important factors influencing life expectancy differences between women and men.
Tomasz Mądry
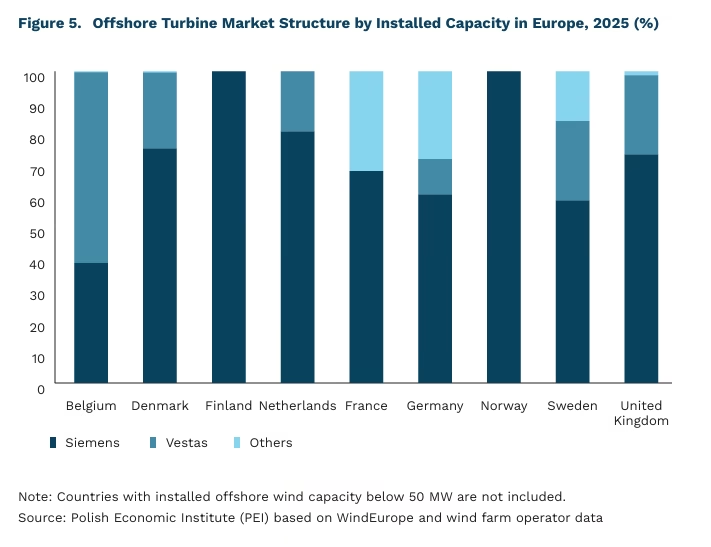
European Offshore Wind Still Beyond the Reach of Chinese Manufacturers
90% combined share of Siemens (Germany) and Vestas (Denmark) in Europe’s installed offshore wind capacity in 2025
71% China’s share of new global offshore wind capacity additions in 2024
In 2025, two European turbine manufacturers, Siemens (Germany) and Vestas (Denmark), together account for 90% of installed offshore wind capacity in Europe. Their market share across individual European offshore markets ranges from 68% to 100%, while non-European manufacturers remain marginal, with less than 1%. The largest offshore wind capacities are found in the United Kingdom (13 GW), Germany (8.1 GW), and the Netherlands (3.8 GW). Denmark, meanwhile, recorded the highest share of offshore wind in its energy mix (26%) in 2024.
Offshore wind farms remain one of the few areas of the energy transition where Europe maintains a competitive edge over China. Nevertheless, China accounted for 71% (76.3 GW) of new global offshore capacity in 2024. For the first time, Chinese turbine manufacturers (Goldwind, Envision, Mingyang, and Windey) held the top four positions in the global supplier ranking. Chinese producers offer turbines at 40-50% lower prices than their European rivals and allow developers to defer payments. In 2024, the European Commission launched an anti-dumping investigation into Chinese wind turbine suppliers operating in EU markets to assess whether state subsidies were undermining the competitiveness, and ultimately the independence, of Europe’s energy sector.
Poland’s Offshore Wind Development Programme foresees 5.9 GW of installed capacity by 2030, spread across seven projects, five of which have already secured a final investment decision (FID). Offshore wind is one of the key projects of Poland’s energy transition. The country also manufactures components for offshore wind farms, including nacelles, subsea cables, and substations. According to the sectoral agreement, local content in the first-phase projects should amount to 20-30%, which is important for the development of the domestic industry in this field. At the EU level, protecting the offshore turbine market from potential dumping practices by Chinese producers will be crucial for both competitiveness and energy security.
Marianna Sobkiewicz
Convergence in Central and Eastern Europe Driven by Stronger Growth, but Innovation Gap Persists
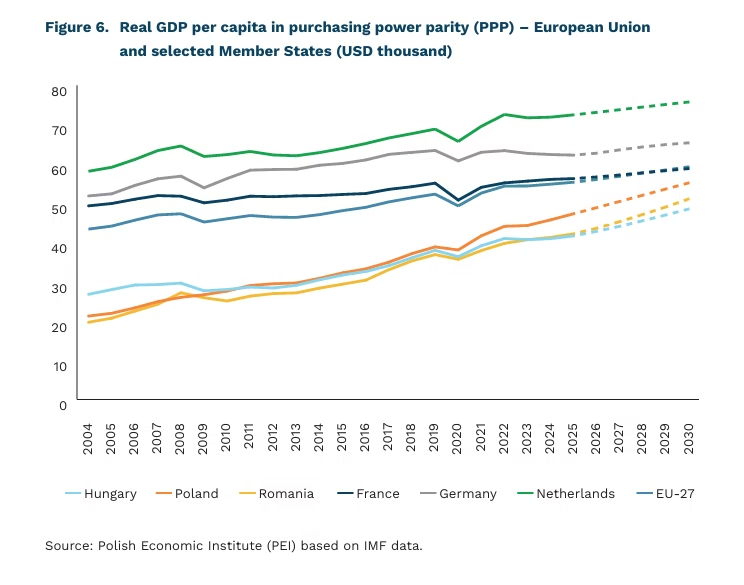
Central and Eastern European (CEE-11)(2) countries have experienced a steady process of convergence. Between 2004 and 2024, they recorded an average annual GDP growth rate of 3.2% – more than three times higher than in the rest of the EU (1.2%) – with productivity gains accounting for 45% of the contribution to GDP growth. According to the SGH (Warsaw School of Economics) Report, there are three possible development paths for the CEE-11 economies. In the positive scenario, GDP per capita in purchasing power parity terms would exceed the income level of other European countries by 2%, with Romania and Lithuania performing best, while Poland would close its income gap with Western Europe. In the baseline scenario, only Lithuania would surpass the Western European average, while Poland would reduce its development gap to around 10%. The cautionary scenario points to a reversal of the convergence trend and renewed divergence in development levels.
A critical long-term factor for the region remains investment in research and development (R&D). Spending levels in the CEE-11 are significantly lower than in Western Europe, and there are few signs of the gap closing quickly. For comparison, in 2023 average EU R&D expenditure amounted to 2.2% of GDP, compared with 3.5% in the US, 3.4% in Japan, 5% in South Korea, and 2,6% in China. As Mario Draghi has emphasised, research and innovation should form the foundation of EU policy, given their importance for knowledge creation, problem-solving, and strengthening economic competitiveness.
To enhance the EU’s competitiveness, other measures are also being undertaken in line with the recommendations of the Draghi Report. One year after its publication, of the 383 recommendations proposed, only 11.2% have been implemented, 20,1% partially implemented, and 46% are in progress. The greatest progress has been recorded in the areas of critical raw materials (33.4%) and transport (26.8%), driven mainly by supply chain security and the shift towards electric vehicles. By contrast, reforms related to energy and digitalisation lag behind, and no sector has yet crossed the threshold of majority implementation. Delays in implementing reforms may prove particularly damaging for Central and Eastern European countries, which are already facing greater lags than Western Europe in digitalisation, energy transition, and innovation development. As a result, there is an increasing risk that development disparities within the Union will not only persist but may even deepen, undermining the cohesion of the EU and its ability to compete with major global economic rivals.
2. The CEE-11 countries are: Poland, Bulgaria, Croatia, Czechia, Estonia, Lithuania, Latvia, Romania, Slovakia, Slovenia, and Hungary.
Piotr Kamiński
The Four-Day Workweek in the Netherlands Functions Without Special Mandate
32.1 average weekly working hours of Dutch employees in 2024 (lowest in the EU)
78% share of the total female workforce in the Netherlands who work part time
EUR 57 average gross value added per hour worked in the Netherlands (third-highest in the EU)
While many countries are piloting shorter workweeks through local initiatives and legislation, in the Netherlands the four-day workweek has become common practice without the need for specific legal regulation.
According to Eurostat, in 2024 Dutch employees aged 20-64 worked an average of EUR 32.1 per week, effectively equivalent to four eight-hour days. This is the shortest average workweek in the EU – more than 10 hours fewer than the 42.9 hours worked by full-time employees in the United States in 2024 (and 44.1 hours in 2019). Eurostat data also show that over one-third of EU employees still work an average of 40-45 hours per week. In Poland, the average is 38.9 hours per week.
As with many social changes in the Netherlands, the shorter workweek emerged from evolving norms rather than legislation. A key turning point was the entry of women into the labour market in the 1980s. Before then, the traditional model assumed men were the sole breadwinners, often working 40 or more hours a week.
Over time, women’s participation reshaped household income structures and even inf luenced tax policy. The so-called “one-and-a-half job model” became widespread, with one partner working full-time and the other part-time. Specially designed tax breaks and social benefits supported the spread of this model among both men and women. 62% of the Netherlands’ total workforce and as many as 78% of total female workforce works part time.
Researchers highlight that this cultural shift not only benefited families but also boosted overall employment, as it enabled a larger share of the population to work. When parttime employment began to spread, the unemployment rate stood at around 7% (7.3% in 1991). By 2001 it had dropped to just 2.1% and has remained low since. Flexible working arrangements also supported work-life balance, reducing the risk of people leaving the labour market altogether.
The Dutch model has also proved conducive to productivity. With gross value added of EUR 57 per hour worked, the Netherlands ranks third in the EU, behind only Denmark and Ireland.
Social origins of the shorter workweek in the Netherlands as well as the norms that made it possible, yet have taken decades to develop, suggest that legal changes in themselves might not be sufficient to reap the economic benefits of reduced work hours. What is also needed are expectation adjustments of both employees and employers, and those take much longer than changes of regulations.
Agnieszka Wincewicz-Price