Economic Weekly 39/2025, October 3, 2025
Published: 03/10/2025
Table of contents
Poland among EU leaders in economic growth
24.9% real GDP growth in Poland since Q1 2018
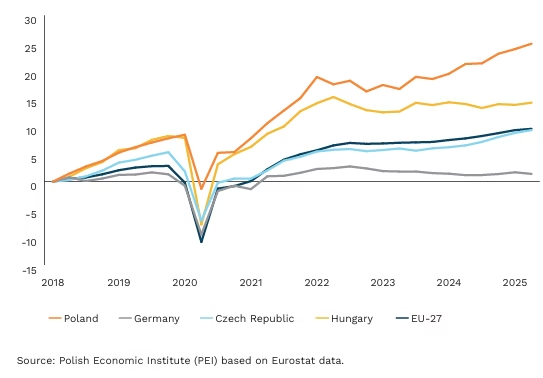
The last seven years have been a period of exceptional acceleration for the Polish economy. Poland has emerged as one of the EU’s growth leaders, outpaced only by a few small and specific economies, and has clearly outdistanced the largest countries of the region as well as the euro area as a whole.
Poland as an EU growth leader – real GDP increase since 2018. From Q1 2018 to Q2 2025, Poland’s real GDP grew by around 24.9%. This places Poland among the fastest-growing economies in the EU. Over the same period, growth in Germany was only 1.4%, while in the Czech Republic and Hungary it reached around 9-10%. This disparity illustrates how far Poland has pulled ahead of many regional peers.
Pandemic response – quick rebound and resilience. The COVID-19 pandemic strongly affected the Polish economy, but the scale of decline was relatively milder than in most EU countries. In Q2 2020, Poland’s real GDP fell by around 8.2% y/y, compared with an average decline of 13.1% across the EU and 10.7% in Germany. Already a year later, Poland recorded a return to positive growth, and by mid-2021 the level of real GDP had already surpassed its pre-pandemic value. For many euro area economies, the path to recovery proved significantly longer.
External pressures did not break the trend. The war in Ukraine and the energy crisis triggered strong tensions across the European Union, and Poland was no exception. High energy prices, geopolitical uncertainty and trade disruptions weighed on growth dynamics. Despite these challenges, Poland avoided recession – in 2023, real GDP increased by 0.2%, compared with the EU average of 0.4%. Although growth was markedly slower than in previous years, the economy remained stable and continued on a growth trajectory.
Multiple drivers of growth – industry, wages, investment… and reshoring. Growth has been multi-faceted: industry has remained a strong pillar, while rising wages have supported demand. Over seven years, the average monthly wage in the enterprise sector increased by nearly 90% (from PLN 4,699.96 in Q1 2018 to PLN 8,918.94 in Q2 2025). This wage growth strengthened domestic consumption and improved household conditions. At the same time, investment outlays expanded production capacity and stimulated modernisation, providing solid foundations for growth. In the years following the pandemic, reshoring – relocating parts of supply chains closer to sales markets – offered an additional boost, with Poland increasingly serving as Europe’s stable production base. In 2022-2023, industrial greenfield foreign direct investment (FDI) to Poland were around 45% higher than before the pandemic, and in 2023 alone, 229 new FDI projects were implemented.
Sebastian Sajnóg
Poland’s Energy Transition Is Advancing Faster Than Expected Seven Years Ago
38-fold increase in installed photovoltaic capacity between 2018 and mid-2025
24 p.p. decline in coal’s share of electricity generation
13% reduction in Poland’s emissions under the EU ETS (from 424 Mt CO₂e to 374 Mt CO₂e) between 2018 and 2024
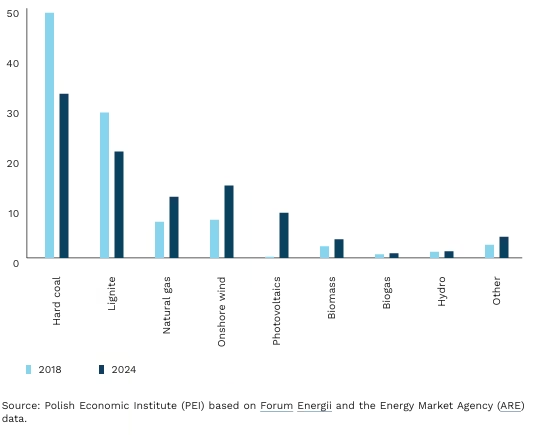
In 2018, renewables accounted for just 12.7% of electricity generation in Poland, compared to 29.4% in 2025. The share of hard coal in the energy mix declined from nearly 50% to 32%, while lignite fell from nearly 30% to 21%. Over the past seven years, solar PV capacity grew at an unprecedented pace – from 600 MW at the end of 2018 to 23 GW in July 2025. This rapid expansion even outpaced the government’s Polish Energy Policy 2040, which had projected only 5 GW by 2025.
The last seven years also saw significant progress in Poland’s nuclear programme. In 2020, the government adopted the Polish Nuclear Power Programme, a strategic roadmap for the first nuclear power plant. In 2021, the company PGE EJ 1 was renamed Polskie Elektrownie Jądrowe (Polish Nuclear Power Plants), with the State Treasury becoming the sole shareholder after acquiring stakes from PGE, KGHM, Tauron and Enea. The selected contractor (Bechtel–Westinghouse consortium) is preparing for construction to start in 2028, with the first reactor scheduled for operation in 2036. In parallel, investments in SMRs (Small Modular Reactors) are advancing: Orlen Synthos Green Energy holds fundamental decisions for six sites expected to host BWRX-300 reactors in the early 2030s.
Low-emission transport has also grown rapidly. By the end of June 2025, nearly 180,000 electric passenger cars were registered in Poland (approx. 90,000 fully electric BEVs and 90,000 plug-in hybrid PHEVs), up from just 2,500 at the end of 2018. In addition, around 10,000 electric delivery trucks and heavy vehicles and 1,500 low-emission buses (including about 100 hydrogen buses) are on the roads. Demand for hybrids has surged as well – in 2024, 250,000 new hybrid cars were registered, 11 times more than in 2018. Still, Poland remains an EU laggard in this field: only 5.7% of new car sales in 2024 were BEVs or PHEVs, compared to the EU average of 21% and as much as 92% in Norway.
Looking ahead, the trajectory and pace of further decarbonisation remains uncertain. Current climate policies reduced emissions from 424 million tonnes CO₂e in 2018 to 374 million tonnes in 2024 (-13%). According to the WAM (With Additional Measures) scenario of the National Energy and Climate Plan, the share of renewables in electricity generation is expected to reach 51.8% by 2030, driven primarily by further expansion of onshore wind and solar PV, alongside the gradual commissioning of offshore wind farms.
Adam Juszczak
Dynamic Growth in the 65+ Population in Poland
+5.6 p.p. increase in the share of people aged 65+ in Poland’s population between 2014 and 2024 (Eurostat)
20.6% share of people aged 65+ in Poland’s population in 2024 (Statistics Poland – GUS)
32.6% projected share of people aged 65+ in Poland’s population in 2060 (Statistics Poland – GUS)
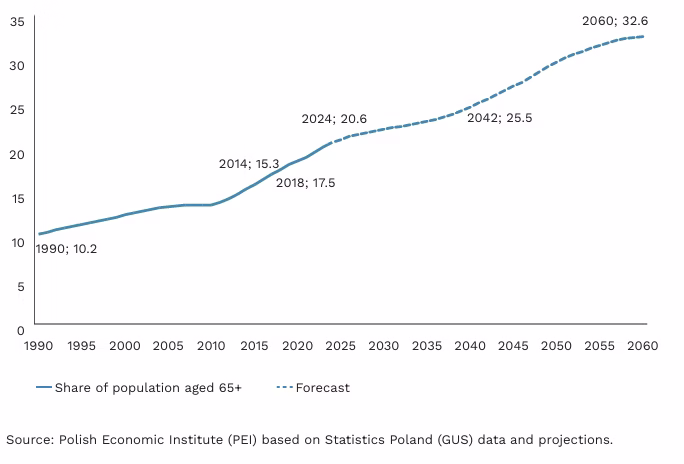
Between 2014 and 2024, Poland recorded the fastest increase in the share of older people in the EU, according to Eurostat(1). During this period, the proportion of those aged 65+ rose by 5.6 p.p. (compared with 4.9 p.p. in Slovakia and 4.5 p.p. in Croatia). The smallest changes were observed in Malta (+0.8 p.p.), Luxembourg (+0.9 p.p.) and Sweden (+1.2 p.p.). The highest share of older people in 2024 was recorded in Italy (24.3%) and Portugal (24.1%), while the lowest was in Luxembourg (15%) and Ireland (15.5%). According to Statistics Poland, 15.3% of Poles were over 65 in 2014, rising to 20.6% in 2024. Projections suggest that by 2060 nearly one in three Poles will be aged 65 or above.
The Polish Economic Institute has repeatedly analysed the implications of population ageing, particularly in the context of the labour market. Reports have emphasised the need to harness the potential of older people for economic development, while also addressing challenges such as limited access to public transport, health and digital exclusion. In 2021, PEI confirmed the existence of age discrimination in the Polish labour market. Moreover, we examined the scale and nature of entrepreneurship among people aged 50+.
We analyse demographic issues comprehensively – on the one hand, encouraging fuller use of the potential of older people, and on the other, addressing topics related to fertility and the integration of immigrants, which can support an ageing economy. We have described the situation of parents in the labour market, identified in the academic literature as one of the key factors influencing decisions about having children. In this year’s report, we highlighted less obvious causes of low fertility – the desire to have children depends on satisfaction with the division of household responsibilities. We have also examined the phenomenon of discrimination against mothers returning to work and against refugees from Ukraine in the labour market. In addition, we have discussed the entrepreneurship of Ukrainians in Poland and the situation and prospects for employing foreigners in shortage occupations.
The consequences of an ageing population include not only changes in the structure of the labour market, but also a growing demand for systemic solutions in long-term care. An OECD analysis identifies four models of such systems: (1) universal, decentralised, financed mainly from public funds, offering a high standard of services; (2) centralised, with a significant role for the private sector and less frequent use of income criteria; (3) decentralised, where access to benefits is conditional on strict income criteria, and most of the burden of care falls on the family; (4) systems with the most limited public support, low service quality standards, and a dominant role for the family as the primary source of care. In this classification, Poland belongs to the last group. In the face of an ageing population, it is therefore essential to create systemic support for seniors and their families, drawing on proven solutions already in place in other countries (2).
- According to Eurostat, the share of people aged 65+ in Poland’s population increased from 14.9% in 2014 to 20.5% in 2024. The 2024 figure is provisional and based on estimates.
- The following countries were classified into the respective groups: (1) Austria, Belgium, Denmark, Finland, France, Sweden; (2) Germany, Iceland, Japan, Luxembourg, Malta, the Netherlands, Slovenia, the United Kingdom; (3) Canada, Estonia, Hungary, Ireland, Italy, Latvia, the United States; (4) the Czech Republic, Croatia, Greece, Lithuania, Spain, Poland, Portugal, Slovakia.
Iga Rozbicka
More Foreigners in the Polish Social Security System
2-fold increase in the number of foreigners registered for pension and disability insurance, 2018-2025
5-fold increase in the number of foreigners insured as self-employed, 2018-2025
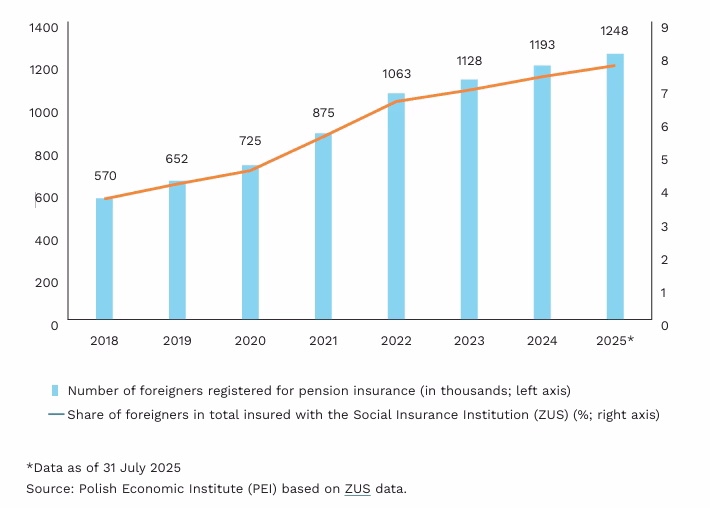
In the past seven years, Poland has seen major changes linked to the growing presence of foreigners both in the labour market and in the social security system. The number of foreigners registered for pension and disability insurance more than doubled, from 570,000 in 2018 to 1.2 million in 2025. As a result, the share of foreigners in the total number of insured persons rose from 3.6% in 2018 to 7.7% in 2025. The sharpest increases were recorded in 2021-2022, when the number of insured foreigners grew year-on-year by as much as 21%. At the same time, the number of foreigners insured as self-employed rose significantly – from 17,800 at the end of 2018 to 83,200 in June 2025, a nearly fivefold increase. In 2025, these persons accounted for 6.9% of all insured foreigners.
The citizenship structure of insured foreigners in Poland is also changing. The share of EU citizens declined from 6.3% in 2018 to 3.4% in 2024, while the share of non-EU citizens rose to 96.6% of all registered. The fastest growth was recorded among Colombian citizens, where the number of insured persons increased 75-fold compared to 2018, due to a low base that year. Nevertheless, the largest groups of foreigners covered by pension and disability insurance remain Ukrainians (818,000) and Belarusians (136,000).
Foreigners’ presence is increasingly visible in the structure of funds accumulated in the social security system. In September 2018, foreigners’ accounts and sub-accounts at ZUS held a total of PLN 12.9 billion, which accounted for just 0.45% of all funds accumulated in the system. At that time, the number of foreigners’ accounts stood at 1.5 million, representing 5.8% of all insured persons’ accounts. Since then, this scale has changed significantly. By the end of 2024, the number of foreigners’ accounts had nearly tripled (to 4.2 million), amounting to 13.8% of all accounts maintained by ZUS. The accounts include both persons currently insured and those who had previously worked in Poland. The amount recorded on foreigners’ accounts and sub-accounts reached PLN 73.3 billion, corresponding to 1.62% of all funds recorded in insured persons’ accounts.
The importance of foreigners for the financial stability of the Social Insurance Fund (SIF) is steadily increasing. In 2018, annual contributions to pension and disability insurance paid for foreigners amounted to PLN 4.3 billion, accounting for 2.6% of total SIF revenues. Six years later, in 2024, this figure had risen to PLN 18.5 billion nearly 6% of all contributions. At the same time, the average monthly contribution base for foreigners, although still lower than for Poles, has been gradually increasing. In December 2018, it amounted to PLN 2,700, while by December 2024 it had already reached PLN 5,300 (compared to PLN 3,700 and PLN 6,400, respectively, for all insured persons).
Dominika Prudło
Seven Years Since the Introduction of Tariffs on Steel and Aluminium during Donald Trump’s First Term
25% and 10% tariff rates imposed by Trump in March 2018 on steel and aluminium, respectively
5.8% growth in employment in steel and iron production between 2017 and 2019
84.5% peak capacity utilisation rate in iron and steel products prior to the pandemic
v
This year marks seven years since the introduction of the first tariffs during Donald Trump’s first presidential term. This decision symbolised the end of an era in international trade and the beginning of a rise in protectionism, or even a neo-mercantilist approach to trade by the United States. In March 2018, a 25% tariff on steel and a 10% tariff on aluminium were introduced. This was the first use of Section 232 of the US Trade Act since 1986, invoked under the pretext of national security, with the aim of boosting domestic production and employment in these sectors. The next stage of tariff measures targeted China, establishing a bipartisan line of assertive policy towards Beijing. Trump’s second term brought a significant intensification of protectionism, covering virtually all countries and nearly all industrial sectors.
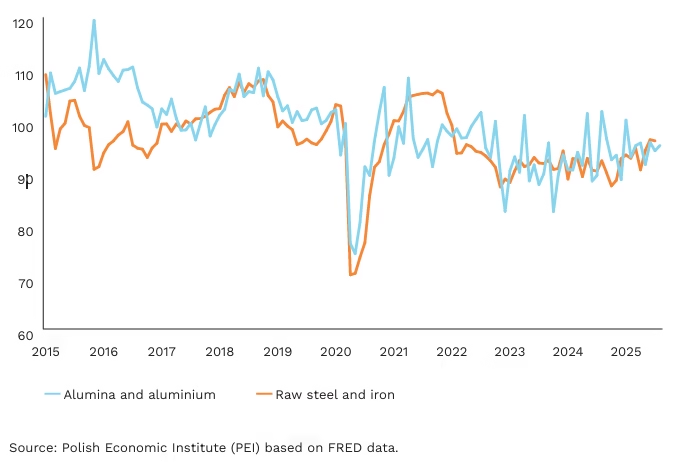
The introduction of tariffs resulted in moderate increases in employment and production in the steel and aluminium sectors. Between 2017 and 2019, employment in steel and iron production grew by 5.8%, while in alumina and aluminium production it rose by 4.7%, slightly more than in industry overall (3%). Over the same period, the production index for alumina and aluminium rose from 101 in January 2017 to 104 in January 2019. The raw steel production index was 99.5 in January 2017, peaked at 108 in October 2018, but fell to 98.9 by January 2019. Immediately prior to the pandemic, it rose again to 103. For these indices, 2017 = 100.
Tariffs, however, led to a moderate decline in the production of goods made from raw steel. Despite increases in steel output, the index of fabricated steel and iron products fell from 100 in January 2017 to 96 in January 2019. Higher tariffs raised the price of raw steel, which in turn depressed production in industries using it as an input. For example, the producer price index for steel wires and stainless steel rose from 84.8 in January 2017 to 115 in January 2019 (base period 2010 = 100). The costs resulting from higher steel and aluminium prices, combined with retaliatory tariffs, outweighed the positive effects of trade protection in the sectors most exposed to competition, leading to declines in sectoral employment and overall exports. Consumers also bore the costs of the trade war, which by the end of 2018 amounted to USD 1.4 billion per month.
Tariffs contributed to higher capacity utilisation. The capacity utilisation index rose from 74% in January 2018 to 81% in October of the same year. After a decline, it rebounded, reaching 84.5% a month before the outbreak of the pandemic. A long-term assessment of the tariffs’ impact is difficult, given the pandemic’s effects on production and employment. The index recovered to 83% in October 2021 but later declined to pre-tariff levels. During his second term, Trump raised tariffs on steel and aluminium to 50% and significantly expanded their application to other sectors and countries. The effective tariff rate reached around 17.4%. Trump has since announced plans to extend tariffs to additional sectors, including pharmaceuticals and machinery.
Marek Wąsiński, Michał Kowalski
The Frequency of “AI” Searches Online Has Increased Dozens of Times Over the Past Seven Years
100 frequency of “AI” searches in September 2025 (Google Trends)
94 frequency of “5G” searches in September 2025 (Google Trends)
80 frequency of “cybersecurity” searches in September 2025 (Google Trends)
ChatGPT, a symbol of the most significant digital technology shift of recent years, summarized these changes as follows: “Over the past seven years, digital technologies have gained importance and become widespread both in Poland and worldwide. Artificial intelligence has moved from the experimental phase to broad application in business, education, and administration. 5G networks, cloud computing, and process automation have developed. Awareness of cybersecurity and data privacy has also grown. In Poland, we observe the dynamic development of digital infrastructure and the increasing use of new technologies by companies and public institutions”(3).
This AI-generated text offers an accurate summary of the key changes in digital technologies over the past seven years. Data from Google Trends confirm the public’s strong interest in the topics highlighted by ChatGPT.
Search activity related to AI rose sharply, from 6 points in January 2018 to 100 points in September 2025 on the Google Trends scale. In the same period, searches for 5G increased from 4 to 94 points, and cybersecurity from 6 to 80 points. Among the analysed technologies, robotization was the most popular in 2018 (peaking at 56 points in December 2018). In 2018, Gartner projected that the global business value derived from AI would reach USD 3.9 trillion by 2022. Gartner also estimates that spending on GenAI will reach USD 643.86 billion in 2025, a 76% increase compared to 2024. At the end of 2017, mobile technologies and services accounted for 3% of Europe’s GDP, compared with around 5% today. The value of the robotic process automation (RPA) market was estimated at USD 3.8 billion in 2024 and is expected to reach USD 30.85 billion by 2030, with an average annual growth rate of 44% in 2025-2030.
However, some technologies were omitted from ChatGPT’s summary, such as blockchain, the metaverse, and autonomous vehicles, which also attracted considerable attention in recent years. These topics, however, have already passed their peak of popularity – blockchain in 2018 and the metaverse in 2022. Only autonomous vehicles maintain relatively stable levels of interest, though expectations for their widespread adoption have been pushed far into the future.
In recent years, interest in digital technologies has grown. AI, 5G, cybersecurity, and robotization have seen significant increases in popularity on Google Trends. By contrast, blockchain and the metaverse, once highly popular, have – according to Gartner’s model – moved past the peak of fascination and are now developing mainly on the basis of proven solutions. Autonomous vehicles remain of interest, though their broad adoption continues to be a challenge for the coming years.
3. Chat GPT-4o, free version, OpenAI.
Magdalena Lesiak
Growth of Trading Companies Despite Challenging Conditions
8.1% → 11.4% share of investment outlays in trade within total investment in the economy (2018 vs. H1 2025)
39.9% → 42.2% share of trading companies investing in machinery, technical equipment and tools in 2023 compared with 2018
+33.3% increase in the number of large-format stores in 2023 compared with 2018
In the first two quarters of 2025, enterprises in the trade sector incurred investment outlays of nearly PLN 10 billion, i.e. 3.2% more than in the same period of 2024, according to Statistics Poland (GUS). At the same time, total investment outlays in the Polish economy amounted to PLN 87.1 billion, 1.2% less than in the corresponding period of 2024. In H1 2025, trade sector investments accounted for 11.4% of all investment in the Polish economy, comparable to outlays in the electricity, gas and steam generation and supply sector (also 11.4%) and in transport and storage (11.7%).
Between 2018 and 2023, trading companies mainly invested in machinery, technical equipment and tools (42.2% in 2023 compared with 39.9% in 2018, GUS data). Rapid technological progress and the need to reduce costs encouraged companies to replace older devices with more efficient ones and to purchase environmentally friendly technologies.
Expenditure on buildings and structures was linked to business expansion, i.e. the opening of new retail outlets and warehouses. Wholesale enterprises increased their share of investment outlays allocated to buildings and structures (from 33.2% in 2018 to 34.5% in 2023), while in retail companies this share declined (from 49.4% to 44.9%). Wholesale investment in transport equipment rose (from 21.3% to 23.7%), while in retail it fell (from 8.9% to 6.4%), with retailers relying more on deliveries from distribution centres.
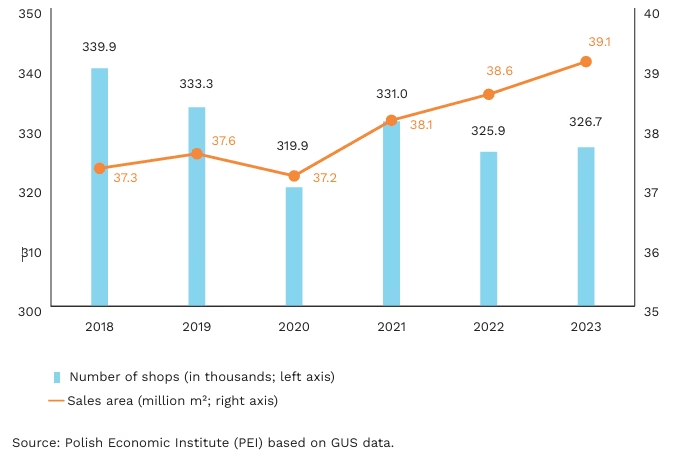
Investment activity translated into a larger sales area, which reached 39,102.6 thousand m² in 2023, an increase of 4.8% compared with 2018 (GUS). At the same time, the number of retail outlets declined. At the end of 2023, the number of shops was estimated at 326,662, i.e. 3.9% (13.2 thousand) fewer than in 2018. The sharpest declines were recorded among the smallest shops (up to 99 m², -5.2%) and small shops (100-399 m², -8.6%). By contrast, the number of large-format stores (400-2499 m²) grew strongly (+33.3%).
Dynamic qualitative changes are also taking place in e-commerce. In 2018, online sales were estimated at about 5% of total retail sales in Poland. The uncertainty and temporary closures of physical outlets during the COVID-19 pandemic accelerated the growth of the e-commerce market in 2020-2021, pushing its share to 13% of total retail sales in 2021 (PwC). Since then, the share of online sales in total retail has gradually declined (according to GUS, it was 8.1% in August 2025 compared with 8.6% in July). This reflects e-commerce’s entry into a new phase, where further growth requires investment in efficient logistics, service personalisation, and enhanced customer experience.
The pandemic, the war in Ukraine, the slowdown of the European economy, and global trade tensions have generally not created favourable conditions for bold investment decisions in trade, a sector highly sensitive to socio-political and economic shocks. Nevertheless, both retail and wholesale trade are undergoing qualitative transformation. Key investment areas include digital transformation, IT modernisation, and applications of artificial intelligence (AI), aimed at modernising and expanding sales in an already saturated market.
Urszula Kłosiewicz-Górecka