Economic Weekly 47/2025, November 28, 2025
Published: 28/11/2025
Table of contents
Poland Among the Top Performers in the Digital Resilience Index (EDRIX)
9th place Poland’s position in the EU with a score of 5.98 in the EDRIX
7.8 EDRIX score for Germany, the top performer
2.76 score for Malta, which ranks last in the EDRIX
Germany (7.8), the Czech Republic (6.89) and Sweden (6.8) occupy the top positions in the European Digital Resilience Index (EDRIX), a metric assessing a country’s capacity to independently develop, deploy and use technology. Poland, with a score of 5.98, ranks 9th and performs above the European average of 5.17. Malta, with a score of 2.76, closes the ranking.
The EDRIX index ranges from 0 to 10 and represents the average of five normalised components: public policy, developer ecosystem, bottom-up implementation, and digital resilience of both the private and public sectors (1). Published for the first time in September 2025, EDRIX is a diagnostic tool intended to reveal structural strengths and weaknesses of European countries in the field of digital sovereignty.
An analysis of country-specific scores across all five components shows that there is no single overall leader – rather, different countries lead in different pillars. The leaders in public policy, demonstrating the highest strategic maturity, are Germany, Sweden, France and the Netherlands. Estonia, the Netherlands and Luxembourg have the strongest technological base and developer communities. Finland, Germany and Poland are champions of bottom-up implementation. The highest levels of independence of both private and public institutions from non-EU technologies are found in the Czech Republic, Austria, Hungary and Germany.
Poland demonstrates strong fundamentals in bottom-up implementation (7.40) – measured by the share of desktop computers running Linux and the combined market share of open-source browsers on desktop devices – as well as solid digital resilience of the private sector (7.54) and public sector (7.97). However, Poland shows a distinct gap in public policy (5.00) and, in particular, the developer ecosystem (1.99), which reflects the domestic capacity to create and maintain technological solutions. This latter component is measured using two indicators: the size of the national developer community (GitHub) relative to population size, and the number of sovereign technological solutions listed in the EuroStack Directory. Germany, the overall leader, has a strong national strategy (10) and dominates bottom-up implementation (9.43), but scores relatively low in the availability of highly skilled workers (3.51). The Czech Republic leads two pillars – digital resilience of the private and public sectors (10) – yet, like Poland and Germany, scores poorly (2.83) in the area of technology creation and maintenance.
The EDRIX analysis indicates that there is no single formula for achieving digital autonomy. The index not only reflects the overall level of digital sovereignty of individual countries but also helps identify their strengths and weaknesses across its five components. Given its recent publication (September 2025), EDRIX should be viewed as a tool still under development. Moreover, some indicators, such as the number of sovereign technological solutions in the EuroStack Directory, may currently reflect the activity of countries that have already been engaged in European digital sovereignty initiatives.
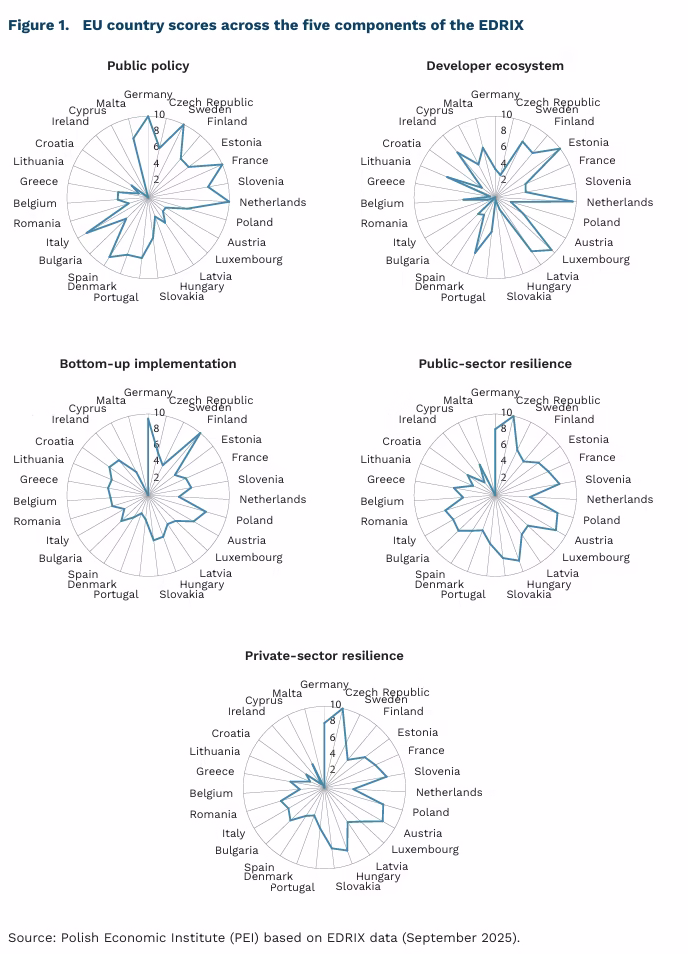
- The score set for each pillar is normalised across all 27 EU member states to a common scale from 0 to 10 (with the highest-scoring country assigned the value of 10). In addition to the EDRIX index, there is also the EOTRIX index (the European Open Technology Readiness Index), which is calculated as the average of three normalised pillars: public policy, the developer ecosystem and bottom-up implementation.
Magdalena Lesiak
The EU Seeks Partners in the Pacific to Defend Free Trade
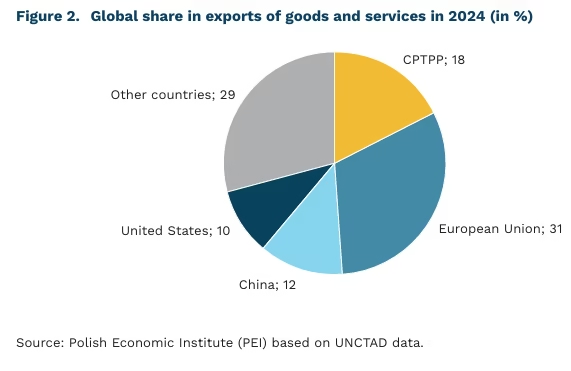
<strong>15.8%</strong> the EU’s share in global trade in 2024
<strong>41%</strong> combined global share of EU and CPTPP countries in exports of goods and services in 2024
<strong>18% and 10%</strong> global shares of China and the United States, respectively, in exports of goods and services in 2024
The European Union is responding to shifts in the global trade order. On 20 November this year, representatives of the EU and the twelve members of the Comprehensive and Progressive Agreement for Trans-Pacific Partnership (CPTPP) met in Melbourne to discuss mutual trade and investment. The CPTPP is the renegotiated version of the Trans-Pacific Partnership (TPP), from which the United States withdrew just before its entry into force in 2017. It brings together 12 countries of the region, including Japan, Chile, Australia and Canada, and regulates free trade conditions among its members.
Both the EU and CPTPP countries are committed to safeguarding free trade. In their joint statement, they expressed opposition to practices that ‘distort trade and investment, impact the resilience of supply chains, and contribute to excess capacity’. This wording is understood as criticism directed at both the United States and China. Participants also emphasised the need to reform the World Trade Organization (WTO) and to strengthen the multilateral rules-based trading system.
The cooperation is meant primarily to support policy coordination. The EU currently has free trade agreements with nine of the twelve CPTPP member states. The talks may lead to deeper collaboration in diversifying import sources and ensuring supply chain security, in the area of digital trade, and in undertaking joint initiatives to reform the World Trade Organization. Unlike the United States and China, the EU continues to seek opportunities and take steps to maintain and strengthen a rules-based multilateral trading system.
Michał Kowalski
The Extractive Industry Refocuses on Offshore Oil and Gas Reserves
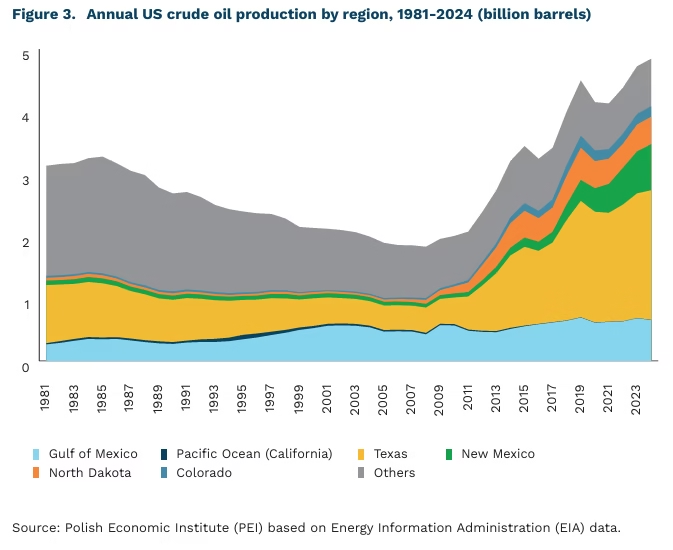
<strong>14%</strong> share of US oil production originating from offshore sources in 2024
<strong>85%</strong> share of offshore reserves in all newly discovered global oil and gas fields in 2024
The Donald Trump administration has proposed a significant expansion of oil and natural gas extraction licences in US offshore waters. The plan by <a href=”https://www.doi.gov/pressreleases/interior-launches-expansive-11th-national-offshore-leasing-program-advance-us-energy”>the Department of the Interior</a> includes 34 potential lease sales across US continental shelf areas: 21 off Alaska, 7 in the Gulf of Mexico and 6 along the Pacific coast. Offshore crude oil production in the United States takes place primarily in the Gulf of Mexico; the Pacific coast plays a marginal role in terms of volume. In 2024, offshore oil output accounted for just <a href=”https://www.eia.gov/dnav/pet/pet_crd_crpdn_adc_mbbl_a.htm”>14%</a> of total US oil production. Of the 658 million barrels extracted offshore in 2024, 654 million came from the Gulf of Mexico. Offshore natural gas production accounted for only <a href=”https://www.eia.gov/dnav/ng/ng_prod_sum_a_EPG0_FGW_mmcf_a.htm”>1%</a> of total US gas output.
According to <a href=”https://www.doi.gov/pressreleases/interior-launches-expansive-11th-national-offshore-leasing-program-advance-us-energy”>the Department of the Interior</a>, the plan to expand offshore extraction reflects the administration’s commitment to ‘restoring American energy dominance’. The proposal has been met with opposition from the governors of <a href=”https://www.reuters.com/business/energy/us-offshore-drilling-proposal-includes-auctions-off-california-coast-2025-11-20/”>California</a> and <a href=”https://www.reuters.com/legal/litigation/florida-republicans-oppose-trump-offshore-oil-leasing-plan-2025-11-21/”>Florida</a>, whose coastal areas would host a substantial portion of the planned offshore expansion. Both state authorities and environmental organisations have criticised the plan due to the risk of oil spills and other adverse impacts on marine ecosystems. Each year, <a href=”https://response.restoration.noaa.gov/oil-and-chemical-spills/oil-spills/largest-oil-spills-affecting-us-waters-1969.html”>more than 150 oil</a> and chemical spills occur in US waters, requiring intervention by the National Oceanic and Atmospheric Administration due to potential risks to the environment or public safety. The most severe environmental disaster of this kind occurred in the Gulf of Mexico in 2010, when an explosion on <a href=”https://www.epa.gov/enforcement/deepwater-horizon-bp-gulf-america-oil-spill”>the Deepwater Horizon</a> drilling platform released 4.9 million barrels of oil into the ocean. As recently as January 2025, then-President <a href=”https://bidenwhitehouse.archives.gov/briefing-room/statements-releases/2025/01/06/fact-sheet-president-biden-protects-atlantic-and-pacific-coasts-from-offshore-oil-and-gas-drilling/”>Joe Biden</a> introduced a ban on new offshore oil and gas drilling along most of the US coastline (approximately 1.4 billion hectares) to protect marine ecosystems and local communities. The new plan by the Trump administration signals a clear departure from this policy.
The extractive industry is increasingly refocusing on offshore deposits. In 2024, more than 9 billion barrels of oil equivalent (boe) in new oil and gas fields were discovered worldwide, of which 8 billion boe were offshore. Nineteen new offshore oil and gas extraction projects commenced production in 2024. Although investment in offshore resources continues to drive the sector, <a href=”https://www.iea.org/reports/world-energy-investment-2025″>the International Energy Agency (IEA)</a> forecasts that global investment in the oil sector will fall by 6% in 2025, largely due to economic uncertainty and low commodity prices. The world’s largest known offshore oil field is Saudi Arabia’s Safaniya field, located in the Persian Gulf. Saudi Arabia is the world’s second-largest oil producer after the United States and produced an average of <a href=”https://www.eia.gov/outlooks/steo/tables/pdf/3dtab.pdf”>9 million barrels per day</a> in 2024. In Norway, one of Europe’s largest oil producers, offshore extraction accounts for 100% of domestic fossil fuel production. A similar situation exists in Brazil, where offshore sources are responsible for 95% of national oil output.
Marianna Sobkiewicz
The Czech National Bank Tests a Cryptocurrency Portfolio
<strong>USD 1 million</strong> the value of the Czech National Bank’s portfolio designated for cryptocurrency investments
The Czech National Bank (CNB) has created a test portfolio of digital assets worth USD 1 million to build practical competencies in the area of cryptocurrencies and tokenisation. The portfolio was established within the CNB Lab innovation unit and – an aspect the bank strongly emphasises – does not form part of the official foreign-exchange reserves.
The structure of the portfolio reflects different types of blockchain-based instruments. The CNB purchased bitcoin, USD-pegged stablecoins, and a tokenised bank deposit recorded on a blockchain. The objective is not to generate profit, but to test the full ‘life cycle’ of digital assets: acquisition, storage, key management, accounting, legal requirements and auditing, as well as operational and cybersecurity risks. The bank has announced that the portfolio will not be actively expanded and that the project will be evaluated after 2-3 years. The CNB views this step as preparation for the future tokenisation of traditional instruments rather than a change in reserve-management strategy. It stresses that the test portfolio is a research experiment, not a reserve investment, and does not imply any intention to include bitcoin in official reserves in the foreseeable future.
The National Bank of Poland (NBP) does not plan to invest in bitcoin or other cryptocurrencies. NBP President Adam Glapiński has stated unequivocally that the bank will under no circumstances consider holding reserves in cryptocurrencies, since reserves must be absolutely safe. The risk factors are clear: bitcoin is characterised by extremely high volatility and a lack of stable value fundamentals. For this reason, the NBP builds the security of its reserves primarily on gold, the US dollar and the euro, rather than on digital assets. In 2025, the bank increased its gold reserves to around 531 tonnes. According to NBP declarations, the goal is to reach a 30-percent share, which implies further increases in the weight of gold within official reserves.
A similar stance is taken by other European policymakers. Christine Lagarde has repeatedly described bitcoin as a highly speculative asset with no intrinsic value, unsuitable for central-bank reserve portfolios. The ECB has also rejected the idea of including bitcoin in EU member states’ reserves, citing the need for reserve assets to remain safe, liquid and transparent.
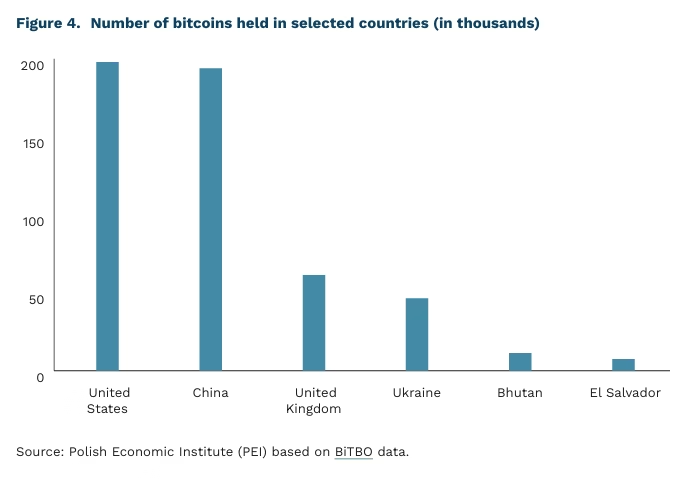
Globally, however, the number of countries with some form of bitcoin exposure is increasing. The United States, Germany and the United Kingdom are among the largest “state holders”, although their holdings primarily result from criminal-case seizures. In the US, a portion of seized bitcoins is intended to be transferred to the Strategic Bitcoin Reserve, established under an executive order issued by President Donald Trump in March 2025. Bhutan is building a BTC portfolio through “green” mining using hydropower, and El Salvador remains the only country systematically purchasing bitcoin on the market as part of its reserve strategy. Ukraine, in turn, uses cryptocurrencies mainly as a channel for wartime donations rather than a traditional reserve asset.
Sebastian Sajnóg, Jakub Ciunel
Ukrainian Pupils Only Partially Offset the Demographic Gap in Polish Schools
<strong>3.1%</strong> share of Ukrainian refugee pupils in all preschools and primary schools in the 2024/2025 school year
<strong>141.1</strong> thousand number of Ukrainian refugee pupils who started preschool and primary school in the 2025/2026 school year
As of 1 September 2024, refugee children from Ukraine became fully subject to compulsory schooling in Poland, meaning they are required to attend Polish educational institutions. In the 2025/2026 school year, a total of 195.2 thousand Ukrainian refugee pupils began their education in Poland, including 26.9 thousand in preschools and 114.3 thousand in primary schools. These figures are almost identical to the previous year, indicating a stabilisation in the number of refugee children in the Polish education system.
In March 2025, Ukrainian refugee children accounted for 3.1% of all pupils in preschools and primary schools, but their distribution across the country varied significantly. Already at the voivodeship level, notable differences emerge: in the Dolnośląskie and Kujawsko-Pomorskie voivodeships the share reached 4.7% and 4.6% respectively, whereas in the Wielkopolskie and Zachodniopomorskie voivodeships it was only 1.5% and 1.3%. The divergence is even more pronounced at the poviat level. In four cities with poviat rights – Legnica, Wrocław, Świnoujście and Gorzów Wielkopolski – the share exceeded 8%, while in 78 poviats it did not reach even 1%. These are mostly peripheral, sparsely urbanised areas with limited employment opportunities, which discourages refugee settlement. The distribution of pupils from Ukraine is therefore highly uneven, shaped largely by urbanisation levels and local labour market structures.
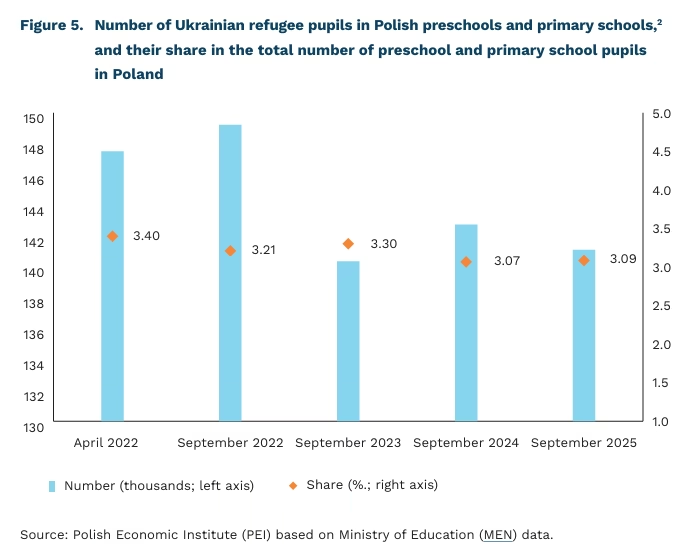
2. Pupils attending preschools, preschool centres, preschool classes within primary schools, early childhood education groups, and primary schools were included.
Dominika Prudło
Corporate Taining Accelerates Immigrant Integration in Host Countries
<strong>Approx. 72%</strong> share of working-age immigrants legally employed in OECD countries in 2024
<strong>2-3</strong> months reduction in annual integration time for immigrants who participate in vocational training
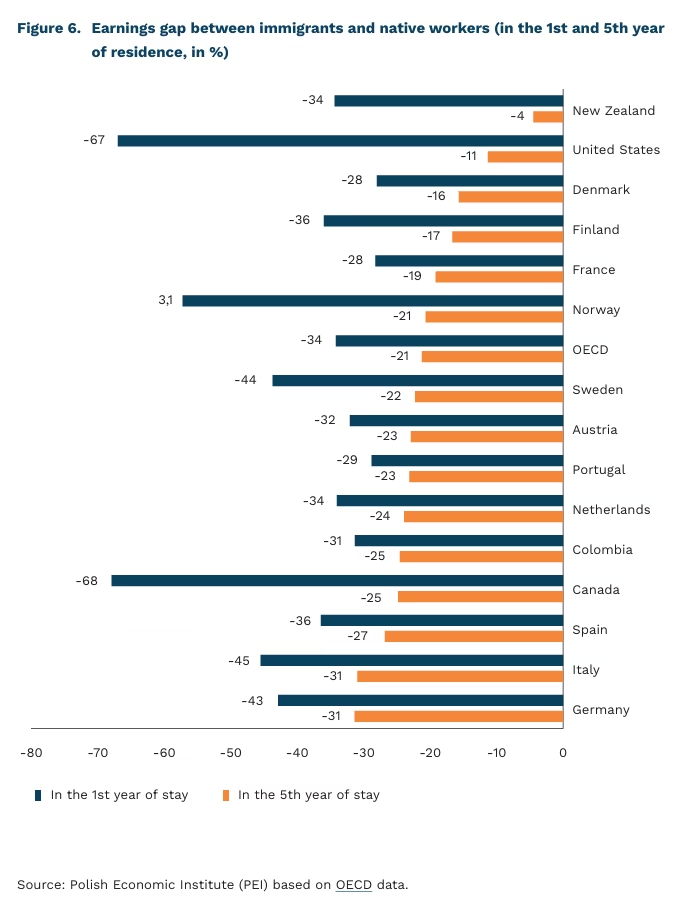
<strong>34%</strong> average earnings gap between foreign-born workers and native workers in their first year of employment in OECD countries
The role of businesses as key actors in migration policy is growing, according to the latest <a href=”https://www.oecd.org/en/publications/international-migration-outlook-2025_ae26c893-en.html”>International Migration Outlook 2025</a>. Although the number of new permanent migrants to OECD countries declined slightly in 2024 (by around 3% compared with the record year 2023, from 6.5 million to 6.3 million) – mainly due to more restrictive immigration policies – employment and labour market participation rates among migrants remain high. In 2024, nearly 72% of working-age migrants were legally employed. Employment provides income but also dignity, stability and a sense of belonging, making employment a cornerstone of integration. As a result, companies are increasingly becoming central actors of this process.
Businesses play an expanding role in supporting immigrant integration. Social adaptation accelerates when employers provide language courses, vocational training, mentoring and competency-development programmes. This finding is supported by <a href=”https://www.oecd.org/en/publications/international-migration-outlook-2025_ae26c893-en/full-report/immigrant-integration-the-role-of-firms_db745b4c.html#boxsection-d1e32328-367e1ca8ab”>panel studies involving employers and employees in 15 OECD countries (covering 2000-2019)</a>. Firms that already employ migrants typically offer intensive onboarding and training programmes (language instruction, vocational and skills training). Employer-provided support reduces integration time by 2-3 months per year. Integration is measured using indicators such as employment rates and promotions during the first year after labour-market entry. Moreover, migrants who receive such training tend to stay longer in the country of destination – a trend confirmed by evidence from <a href=”https://home-affairs.ec.europa.eu/whats-new/publications/oecd-report-germany-status-immigrant-integration_en”>Germany</a> and <a href=”https://www.canada.ca/en/immigration-refugees-citizenship/services/settle-canada/language-skills/classes.html”>Canada</a>.
Despite these improvements, immigrants continue to earn less than native workers. Although comprehensive cross-country data on immigrant wages remain limited, the overall trend shows lower earnings among foreign-born workers. According to OECD data, immigrants initially earn on average 34% less than native-born workers of the same age and gender. This gap partly reflects immigrants’ overrepresentation in low-wage sectors and the incomplete recognition of their qualifications.
Over time, the wage gap narrows as immigrants improve their language skills, acquire new competencies and gain a stronger sense of belonging. In the United States, the earnings gap shrinks by as much as 56 percentage points after five years, and in Canada by 43 percentage points. In EU countries, the pace of convergence is slower: 22 percentage points in Sweden, 14 in Italy, 12 in Germany and 9 in France. This may in part reflect more regulated labour markets and lower overall occupational mobility compared with North America. By providing training and support, businesses contribute not only to career development but also to a sense of belonging, which is a foundation of a well-functioning society.
Katarzyna Zybertowicz
Poland Struggles with Recycling Performance
<strong>7.7%</strong> share of materials used in Poland that came from recycling in 2024
<strong>12.2%</strong> EU average share of recycled materials in 2024
In 2024, only 7.7% of the materials used in Poland’s economy came from recycling – significantly below the EU average of 12.2%. Poland is one of just six member states where this share has declined compared with a decade earlier (since 2015). The Netherlands leads the ranking, with 32.7% of materials coming from secondary sources.
Although the data refer to the use of recycled materials by businesses – a key element of the EU’s transition towards a circular economy – consumer behaviour toward recycling is equally important. These two perspectives converge within the Extended Producer Responsibility (EPR) mechanism, which shifts the real cost of managing packaging waste from municipalities and citizens to companies placing packaged products on the market. As part of Poland’s EPR implementation, a new deposit-return system was introduced, operating partially from October 2025 and planned to be fully implemented by 2028. While it is too early to assess the system’s effectiveness, several factors will determine its future success.
The deposit is part of the product price and refunded to customers when the packaging is returned to the store (e.g. 1 PLN for a glass beer bottle). The new deposit-return system makes it possible to return packaging without presenting a receipt, using dedicated machines located at shops, which means a significant improvement. However, because the deposit is included in the price at the time of purchase, consumers perceive it as an upfront expense. As a result, receiving the deposit back may be interpreted less as getting one’s money back and more as receiving a small financial reward for undertaking the effort of segregation and recycling.
The willingness to make this effort is influenced by both social and individual norms. A social norm encouraging waste segregation and recycling is more effective when such behaviours are easy and require little effort. When sorting waste is simple, deviating from the norm becomes less justifiable. Therefore, the efficiency of the deposit-return system may depend more on factors such as the average distance to the nearest return machine than on the financial incentive itself, especially since the deposit cannot be high, as it must remain part of the product price.
Furthermore, social norms undergo internalisation. Individuals with stronger pro-environmental attitudes are more willing to invest effort in waste sorting and recycling. Internalisation can, in turn, generate a personal norm: the desire to see oneself as environmentally responsible encourages greater engagement. This internalisation process becomes easier when habits are simple to form, for instance, routinely taking empty bottles and packaging when going to the store. The more frequently consumers have items to return and the easier the process, the faster such habits will develop.
As a result, the success of the deposit-return system will depend on expanding the availability of collection points and broadening the system to include additional types of packaging that are not yet accepted by machines. These measures will reduce the time and effort required from consumers, and support the formation of everyday habits of returning various types of bottles and packaging during routine shopping trips, without the need for extensive sorting in advance.
Łukasz Baszczak