Economic Weekly 50/2025, December 19, 2025
Published: 19/12/2025
Table of contents
VAT Gap in Poland Smaller in 2024 than in 2023
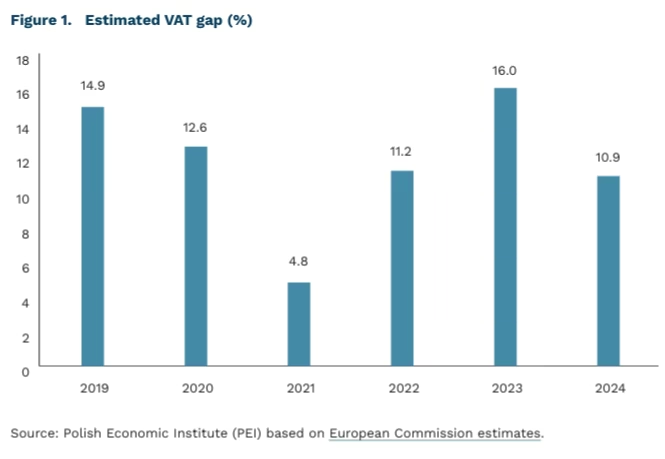
10.9% VAT gap in Poland in 2024 (rapid estimate) as a share of potential VAT revenues, following an increase to 16.0% in 2023
EUR 128 billion VAT gap in the EU in 2023, i.e. 9.5% of potential revenues (VTTL)
The VAT gap in Poland has begun to decline again. The European Commission’s report states that after a sharp increase to 16.0% in 2023 (from 11.2% in 2022), the VAT gap in Poland fell to 10.9% in 2024 according to a rapid estimate. The authors stress that the data for 2024 are preliminary and based on a simplified methodology; therefore, subsequent editions of the report may revise them.
The deterioration in 2023 was strongly linked to the business cycle. In 2023, real GDP growth in Poland slowed to 0.2%, i.e. by 5.0 percentage points less than a year earlier, while real household consumption declined to -0.3%. At the same time, the share of services in the economy increased to 64.4%, and the report indicates that the services sector is characterised by a relatively higher risk of tax non-compliance. An additional factor was the rising number of corporate bankruptcies, which increased the uncollectibility of tax liabilities.
Poland was not an exception in the European Union. In 2023, the VAT gap in the EU increased to EUR 128 billion, i.e. 9.5% of potential revenues, representing a year-on-year deterioration of 1.6 percentage points. The median VAT gap across Member States rose from 7.3% to 8.2%.
The EU map shows wide differences between countries in 2023. The lowest VAT gaps were recorded in Austria (1%), Finland (3%) and Cyprus (3.3%), while the highest were observed in Romania (30%) and Malta (24.2%). In terms of year-on-year changes, the strongest increases affected Ireland (+6 pp), Estonia (+5.1 pp), Hungary (+5 pp) and Poland (+4.8 pp). Significant improvements were noted in Croatia (-3.7 pp), Slovenia (-3.5 pp) and Cyprus (-3 pp).
Data for 2024 suggest an improvement in VAT collection conditions in Poland. The report’s authors point, inter alia, to a 3.2% decline in the number of bankruptcies, which limits losses resulting from taxpayer insolvency. At the same time, the so-called policy gap – the part of the VAT shortfall resulting from decisions on rates and exemptions – is decreasing. In Poland, the VAT policy gap fell from 53.6% in 2022 to 50.8% in 2023 and 49.8% in 2024, representing one of the largest declines in the EU.
The improvement is driven by both cyclical and systemic factors. The authors suggest that the 2024 results may reflect both economic stabilisation and the maturation of changes implemented in recent years in the tax administration and in relations with taxpayers.
The digitalisation of tax settlements remains a key direction for further reduction of the VAT gap. The report’s authors emphasise the importance of e-invoicing, e-reporting and tools such as SAF-T, which shorten the distance between a transaction and risk analysis. An important role is also played by better use of data from payment service providers in cross-border trade and by the development of cashless payments, which strengthen the transactional “trail” and reduce the scope for abuse.
Sebastian Sajnóg
Profitability Of Medium-Sized And Large Enterprises Is Increasing
3.9% net turnover profitability ratio in enterprises in January-September 2025
75% share of enterprises reporting net profit in January-September 2025
111.1 points median value of the Monthly Business Climate Index (MIK) for large enterprises in January-September 2025
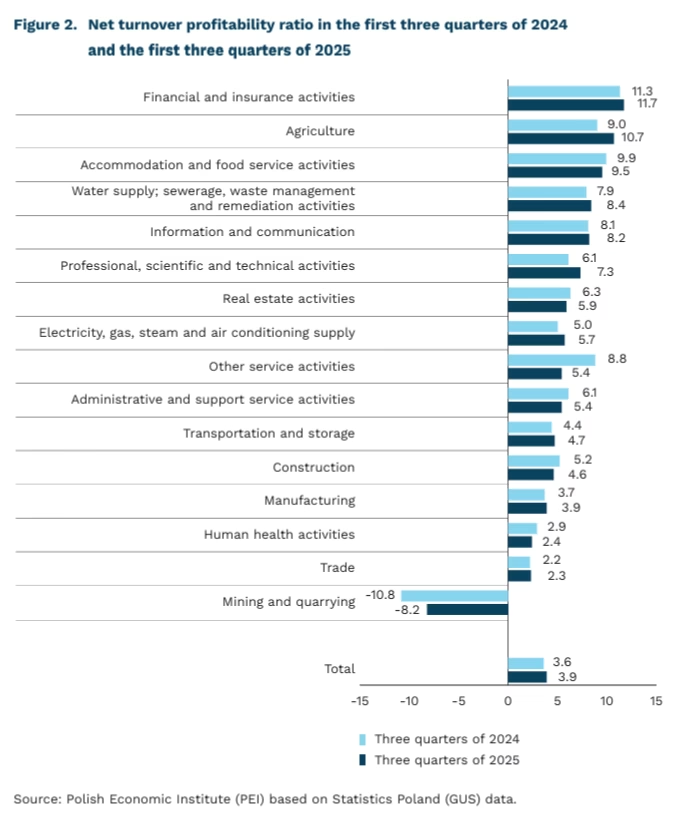
In January-September 2025, the net turnover profitability ratio for enterprises employing at least 50 persons (medium-sized and large) amounted to 3.9% and was higher by 0.3 percentage points than in the corresponding period of 2024, according to Statistics Poland (GUS). The net turnover profitability ratio for medium-sized enterprises stood at 4.2% (the same value as in the corresponding period of 2024), while for large enterprises it reached 3.7% (an increase of 0.3 percentage points). Compared with the first three quarters of 2024, the share of enterprises reporting a net profit increased by 2 percentage points, to 75%.
In January-September 2025, the highest profitability was recorded by enterprises operating in financial and insurance activities (11.7%, up by 0.2 percentage points compared with the corresponding period of 2024). Net turnover profitability ratios higher than in the first three quarters of 2024 were observed in most sectors, except for: other service activities (a decline of 3.4 percentage points), administrative and support service activities (a decline of 0.7 percentage points), construction (a decline of 0.6 percentage points), human health activities (a decline of 0.5 percentage points), as well as accommodation and food service activities and real estate activities (declines of 0.4 percentage points each). The lowest net turnover profitability ratio was recorded in mining and quarrying, where the indicator reached -8.2%, which was the only case of negative profitability among the analysed sectors. The highest profitability among medium-sized enterprises was recorded in mining and quarrying (15.4%), while among large enterprises it was observed in accommodation and food service activities (11.8%).
The increase in enterprise profitability was driven by multiple factors, including changes in consumer behaviour and shifts in enterprises’ revenue levels. In September 2025, increased consumer propensity to spend was observed, which translated into higher retail sales (a year-on-year increase of 6.4% in September 2025). As a result, net revenues from the sale of products, goods and materials rose by 2.7% to PLN 3,830.6 billion. Although costs increased year-on-year by 2.7% in nominal terms, their share in revenues declined by 0.4 percentage points. The improvement in the situation of enterprises is also conf irmed by the results of the Monthly Business Climate Index (MIK) survey, which indicate that throughout most of 2025 positive sentiment among entrepreneurs prevailed over negative sentiment. The median MIK value for large enterprises in January-September 2025 amounted to 111.1 points (108.3 points in 2024), while for medium-sized enterprises it stood at 101.9 points (102.0 points in 2024).
Aleksandra Wejt-Knyżewska
China as the Global Leader in Electromobility
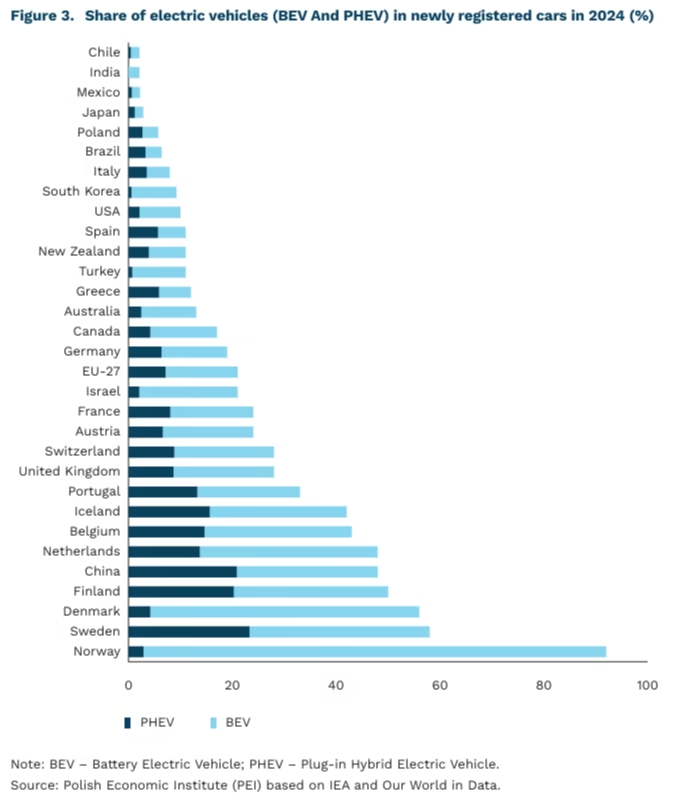
48% share of electric vehicles (BEV and PHEV) in newly registered cars in China in 2024
-7.2% decline in transport-sector emissions in China compared with 2023
1.25 million vehicles exports of electric cars from China (40% of global exports)
Estimated transport emissions in China declined by 7.2% compared with 2023 and by 4.6% relative to 2024 (1). This was largely the result of the progressing electrification of the transport sector, which increased from 5.1% in 2020 to 6.8% in 2025. The current year is also the first in which China may achieve its assumed target of increasing transport electrification by 0.5 percentage points annually, which is a prerequisite for meeting climate targets in this sector.
Currently, nearly 50% of newly registered cars in China are electric vehicles (BEV and PHEV). This result is lower only than that recorded in the Scandinavian countries, among which Norway clearly dominates (92%). At the same time, it is more than 25 percentage points higher than the average for the EU-27. This is largely due to the growing popularity of plug-in hybrid vehicles (PHEV), which account for more than 40% of all newly registered electric vehicles. It is worth noting that this represents a significant shift – back in 2021, the share of electric vehicles among new cars in the EU exceeded that of China (18% versus 15%).(2)
The rising share of electric vehicles in China is also supported by the development of infrastructure. At the end of September 2025, there were 55,000 charging points in operation across the country, representing an increase of 55% compared with the previous year.
The growth of transport electrification is also supported by the development of railways. The total length of high-speed rail lines in China increased to 48,000 km by the end of 2024, with plans to reach 70,000 km by the end of 2035. At the same time, however, the share of domestic air travel is increasing – the number of passengers in 2024 amounted to 664 million, representing a year-on-year increase of 12.5%.
China remains the world’s largest exporter of electric vehicles, accounting for 40% of global exports, or 1.25 million vehicles in 2024 (including production of Western brands in China). The second-largest exporters are the countries of the European Union, which exported 830,000 cars outside the EU, as much as 60% of which went to other European countries, primarily the United Kingdom.
At the same time, imports of electric vehicles into the EU in 2024 amounted to 680,000 vehicles, around 400,000 of which originated from China – of this figure, nearly two-thirds were brands of Chinese manufacturers.
- CREA Estimates for 2025.
- Polish Economic Institute (PEI) based on IEA and Our World in Data.
Adam Juszczak
Digitalisation of Enterprises in Poland Is Progressing, but the Use of Advanced AI Technologies Remains Limited
8.7% share of enterprises using AI technologies in 2025
42.0% share of large enterprises using AI technologies in 2025, compared with 15.6% of medium-sized and 6.1% of small enterprises
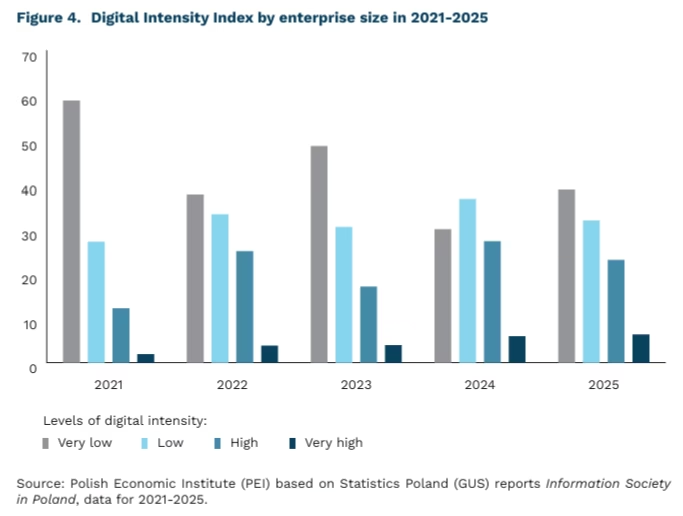
The results of the annual Statistics Poland (GUS) reports Information Society in Poland for 2021-2025 indicate a growing level of digital intensity among enterprises in Poland. Over the analysed period, the share of firms with very low digital intensity declined year by year by an average of around 10%, although fluctuations were observed in individual years. For example, the share of enterprises with very low digital intensity fell from 58.7% in 2021 to 30.0% in 2024, and then increased to 38.7%. At the same time, the proportion of enterprises with very high digital intensity rose steadily each year, from 1.9% in 2021 to 6.3% in 2025.
The Digital Intensity Index measures the extent to which firms use advanced information and communication technologies. The indicator covers 12 areas of activity, such as internet access for business purposes and the use of AI technologies. Based on the number of criteria met, enterprises are classified into one of four levels of digital intensity: very low, low, high, or very high. Some of the assessed areas remain constant over time, while others change from year to year; therefore, shifts in the distribution of firms across digital intensity categories may reflect both genuine digital progress and, in part, changes in measurement methodology.
The level of digital intensity among enterprises in Poland is increasing, but unevenly. Statistics Poland data for 2025 show that only 8.7% of all enterprises used advanced AI-based technologies (up from 5.9% in 2024), with pronounced differences by firm size. AI was used by 42.0% of large enterprises (33.0% in 2024), compared with 15.6% of medium-sized enterprises (10.4% in 2024) and 6.1% of small enterprises (4.0% in 2024). Microenterprises were not covered by the GUS survey; however, research conducted by the Polish Economic Institute indicates that microfirms use AI more frequently than small or medium-sized enterprises.
Increasing disparities in the adoption of modern technologies are also evident across sectors of economic activity. Statistics Poland data for 2025 show that AI adoption is highly sector-specific. In the ICT sector, 36.1% of enterprises use AI. The most commonly applied solutions in this sector are text and speech generation technologies (24.9%), machine learning (16.0%), and decision-support systems (15.5%). By comparison, the share of enterprises using AI amounts to 23.2% in professional, scientific and technical activities, 7.8% in manufacturing, and 5.0% in the food industry. In 2024, the gap between the ICT sector and manufacturing stood at 25.6 percentage points; in 2025, it widened to 28.3 percentage points.
Although the digital intensity index is increasing, digitalisation among enterprises in Poland remains uneven and concentrated in selected sectors and large firms, which limits the full exploitation of innovation potential and opportunities for productivity growth.
The USD Will Remain the Main International Currency
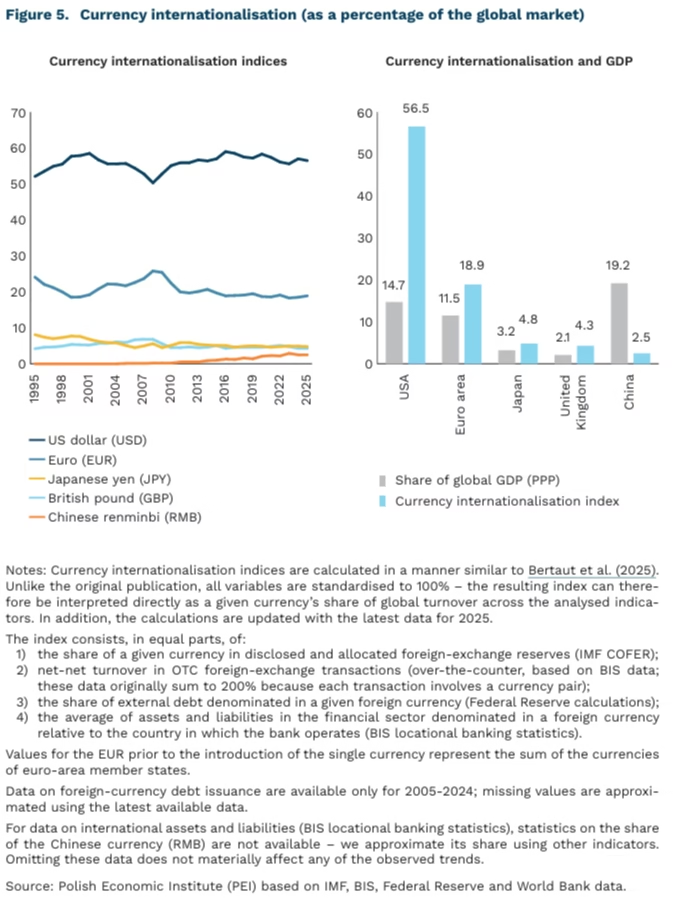
56.5% share of the USD in the currency internationalisation index
-15.2 p.p. decline in the USD share of central bank reserves from its peak
from 83% to 89% increase in the USD share of OTC foreign-exchange transactions
The data do not support the thesis of the de-dollarisation of international finance. The currency internationalisation index indicates that the US dollar (USD) currently accounts for approximately 56.5% of the global market. The euro (EUR) remains the second most important currency (18.9%). By contrast, the position of the Chinese renminbi (RMB) has weakened slightly (2.5%).
Arguments in favour of de-dollarisation are provided mainly by IMF COFER data on central bank foreign-exchange reserves. The share of the USD in these reserves has fallen by 15.2 percentage points from its peak – from 71.5% in 2001 to 56.3% at present. At the same time, the share of reserves held in alternative reserve currencies (e.g. AUD, CAD, GBP) and in the Chinese RMB has increased, by around 2-3 percentage points for each. Nevertheless, the USD share remains close to its 1995 level, i.e. the beginning of the COFER database (59%).
However, reserves reported in the IMF COFER database have not increased for a decade. The period 1995-2013 was characterised by an unprecedented rise in total foreign-exchange reserves disclosed in the IMF COFER database. Their total value increased from USD 1.4 trillion in 1995 to USD 11.7 trillion in 2013, i.e. by an average of 12.6% per year. Since then, the total value of reserves disclosed in COFER has increased by only USD 0.7 trillion, or 5.7% in total over 11 years. After adjusting for inflation, their value is lower than in 2013 – central bank demand is currently a less important indicator of a currency’s international role.
Extending the analysis to include demand from the private sector suggests the continued dominance of the USD. For this purpose, we construct a currency internationalisation index similar to that proposed by Bertaut et al. (2021). The index also incorporates data on currency trading volumes, debt issuance, and banking-system assets denominated in foreign currencies. This index indicates no significant fluctuations in the internationalisation of the USD over the past three decades. The share of the USD in foreign-exchange market transactions increased from 83% in 1995 to 89% in 2025. In the case of debt issuance, the share rose from 55.3% in 2005 to 60.6% in 2024.
Trends in trade invoicing and gold purchases also do not point to de-dollarisation. Boz et al. (2025) estimate that around 60% of global trade continues to be invoiced in USD, which is approximately five times more than the share of the United States in global exports. Globally, less than 2% of exports are settled in RMB, mainly trade involving Asian countries or Russia. In the case of gold, virtually the entire increase in the value of central bank reserves results from rising gold prices rather than an increase in the number of ounces held. Weiss (2025) notes that in recent years only the central banks of Turkey, China and Russia have reduced their exposure to the USD while simultaneously increasing gold purchases.
The future of the USD depends on the coherence of US government policy. Skopiec (2025) concludes that the main threat to the USD’s position is the gradual erosion of the institutional order and macroeconomic imbalances in the form of persistent fiscal and current-account deficits. As a remedy, some representatives of the US administration have proposed tariffs and a weaker USD (e.g. Mirran, 2024); however, chaotically introduced tariffs have not significantly reduced the fiscal deficit (PEI, 2025; FRED). On the other hand, S. Bessent sees the continued role of the USD in the growth of the crypto-asset market. This relates both to the fact that virtually the entire stablecoin market is directly linked to the USD and to the tokenisation of investment funds, which reduces transaction costs and increases access to US assets for investors from the rest of the world (e.g. Vanguard).
Marcin Klucznik
Poland Among Countries with a Moderate Share of Young People Neither in Education nor in Employment
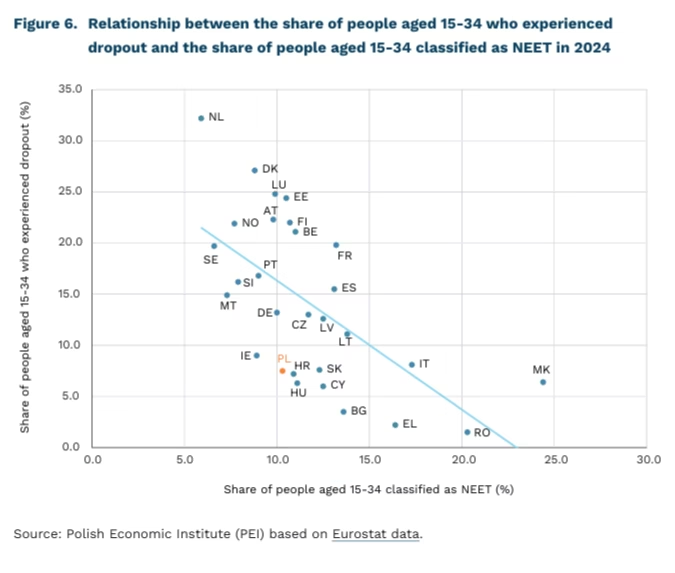
7.5% share of Poles aged 15-34 who experienced dropout in 2024
10.3% share of Poles aged 15-34 classified as NEET (young people not in education, employment or training) in 2024
Early leaving from education (dropout) and NEET status are key indicators of the performance of education systems and their links with labour markets in the EU. According to Eurostat data for 2024, 14.2% of people aged 15-34 in the EU experienced early leaving from upper secondary or tertiary education at least once, while 12.2% belonged to the NEET group, i.e. individuals neither participating in education nor in employment. NEET status is associated with the risk of socio-economic consequences, such as lack of financial independence, depreciation of skills, or social marginalisation (PARP, 2025). Comparative analysis of the relationship between dropout and NEET status helps to identify different transition trajectories of young people from education to the labour market across EU Member States.
According to Eurostat’s typology, Poland belongs to the group of countries with a low share of young people experiencing dropout and a moderate level of NEET, which is characteristic of countries with predominantly linear educational trajectories. Poland clearly differs from Southern European countries, where a low level of dropout coexists with a high share of young people remaining outside both education and employment. At the same time, the Benelux countries and some Nordic states stand out for a high share of individuals experiencing dropout combined with a low level of NEET, which coincides with a large proportion of young people combining education with work.
From an international perspective, there is a negative correlation (-0.6) between the share of young people who have experienced dropout and the share classified as NEET. This means that countries with higher levels of interruption in formal education often simultaneously exhibit a lower scale of youth inactivity. As emphasised in the literature, NEET status is a significantly more heterogeneous phenomenon and is more strongly determined by structural, institutional and individual factors than early leaving from formal education alone. In some countries, higher dropout rates coexist with relatively efficient absorption of young people into the labour market or into non-formal education systems, which reduces the risk of long-term occupational and social disengagement (OECD, 2025).
The relationship between combining education with work, interruptions in education, and the risk of young people’s exclusion from the labour market is complex and strongly dependent on the institutional context. Eurostat data show that in countries with a higher share of working pupils and students, dropout occurs more frequently; however, this does not imply worse long-term educational outcomes, but rather reflects greater flexibility of education systems and earlier entry of young people into the labour market. Of key importance is so-called active dropout, i.e. leaving education while simultaneously taking up employment, which reduces the risk of transition into NEET status. In the Polish context, the main challenge is not the scale of dropout itself, but the lack of mechanisms supporting the combination of education and work, which may limit the potential for further reductions in the NEET rate.
Dominika Prudło
Rising water consumption by data centres and industry may lead to water poverty in particularly vulnerable areas
150 million m³ water consumption by data centres projected for 2028 (a twofold increase compared with 2023)
4 billion people living in regions affected by seasonal droughts
Projections of growing demand for data centres raise concerns about their resource use and environmental impact. Water resources are particularly at risk. By 2028, data centres could consume up to 150 million m³ of water, representing a twofold increase compared with 2023.
At present, even medium-sized data centres consume annually as much water as 1,000 households. Large data centres in the United States use the annual water equivalent of a city with up to 50,000 inhabitants.
According to estimates by UN Water, total global water demand could increase by as much as 30% by 2050. At the same time, around 4 billion people currently experience seasonal droughts in the areas where they live.
Researchers and non-governmental organisations, in efforts to counteract rising water consumption, are developing behavioural interventions aimed at reducing individual water use in households, which have also recorded a sharp increase in consumption over the past 20 years (up to 200% between 2000 and 2014).
A World Bank study conducted in Costa Rica demonstrates the effectiveness of reducing household water consumption by nearly 6% when households received information together with their water bills comparing their consumption with that of their neighbours. The information took the form of praise for consumption lower than the neighbourhood average, or a notice that a household’s consumption was higher than that of its neighbours, accompanied by practical tips on how to reduce it.
Such interventions can lead to meaningful and statistically significant reductions in individual water use. While individual consumption continues to rise overall, it remains substantially lower than the increases projected in forecasts driven even by data centres alone.
Unfortunately, high water demand by data centres may coincide with general water scarcity in the locations where they are established. Examples include Arizona, emerging as a major data-centre hub in the United States while having a very arid climate and facing challenges in ensuring water supply for its residents, as well as Middle Eastern countries seeking to attract investment from Western firms despite being among the most water-scarce regions in the world.
Governmental and non-governmental organisations are implementing solutions to promote water conservation in enterprises. These most often take the form of certifications (e.g. Australia’s Smart Drop) or awards (e.g. the Stockholm Water Prize), which companies can use in marketing communications and to promote their environmental and sustainability efforts. One initiative undertaken by data-centre operators is the calculation and disclosure of water usage effectiveness (WUE), which serves as a declaration of their efforts towards more sustainable water use.
A positive signal from the data-centre industry itself is the trend towards developing more efficient and water-saving cooling solutions, which reduce not only electricity consumption but also water use. Policymakers should nevertheless focus on ensuring that such innovations are actually implemented and meet the relevant standards.
Maksymilian Pyrkowski