Economic Weekly 6/2026, February 13, 2026
Published: 13/02/2026
Table of contents
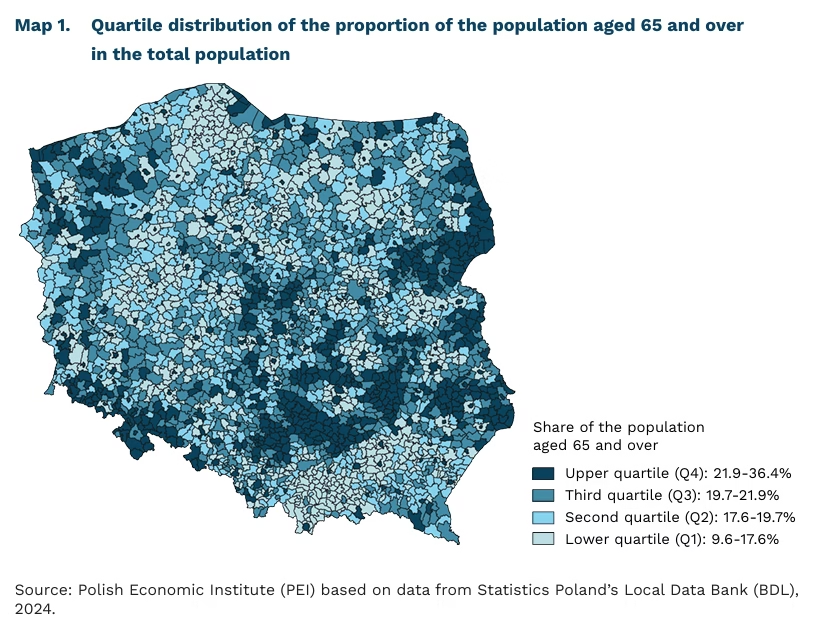
The demographic ageing process in Poland is spatially uneven
in 161 municipalities (out of 2,479), the share of the population aged 65 and over exceeded 25% in 2024
61.8% of municipalities in the Świętokrzyskie Voivodeship were classified in the upper quartile in terms of the share of the population aged 65 and over in 2024
7.5% of municipalities in the Wielkopolskie Voivodeship were classified in the upper quartile in terms of the share of the population aged 65 and over in 2024
The population ageing process in Poland is strongly spatially differentiated and does not proceed uniformly across municipalities. At the national level, people aged 65 and over accounted for 20.6% of the total population in 2024, and according to Statistics Poland’s projection, their share is expected to increase to 32.6% by 2060. However, the consequences of this process are manifested primarily at the local level. Ageing progresses unevenly, concentrating in municipalities affected by depopulation, while to a lesser extent affecting suburbanising areas surrounding large urban centres. As a result, demographic ageing is becoming a spatially polarised phenomenon, with dynamics and impacts that differ substantially across regions
The distribution of municipalities by quartiles of the share of the population aged 65 and over confirms the strong regional differentiation of demographic ageing. In the Świętokrzyskie Voivodeship, as many as 61.8% of municipalities fall within the upper quartile, i.e. the group representing the 25% ‘oldest’ municipalities in Poland. High values were also recorded in the Lubelskie (45.5%) and Dolnośląskie (40.8%) voivodeships. By contrast, in the Wielkopolskie Voivodeship only 7.5% of municipalities belong to this category, while in the Pomorskie Voivodeship more than half of municipalities (53.7%) are classified in the lower quartile, indicating a relatively younger age structure.
The highest shares of older residents are concentrated in a relatively small group of municipalities, which confirms the spatial polarisation of the ageing process. Out of 2,479 municipalities in Poland, 161 record a share of the population aged 65 and over exceeding 25% of total residents. The largest numbers of such municipalities are located in the Dolnośląskie and Lubelskie voivodeships (27 each), whereas only one municipality in each of the Lubuskie, Opolskie and Warmińsko-Mazurskie voivodeships meets this criterion. The municipality with the highest proportion of older residents is Dubicze Cerkiewne in the Podlaskie Voivodeship, where people aged 65 and over account for 36.4% of the population, illustrating the concentration of advanced ageing in peripheral municipalities with limited transport accessibility.
By contrast, the lowest shares of older residents are observed in municipalities located in the vicinity of large cities, where ageing is mitigated by in-migration. Suburban municipalities surrounding Warsaw, Poznań, Wrocław, the Tricity (Gdańsk–Gdynia–Sopot), and Kraków attract working-age populations, thereby reducing the proportion of residents aged 65 and over despite the nationwide ageing trend. Examples include the municipalities of Kleszczew (9.6%) and Komorniki (10.3%) near Poznań, which are among the demographically youngest units in Poland in terms of age structure.
The ongoing ageing of the population is likely to deepen existing territorial disparities and increase pressure on municipalities with unfavourable age structures. The growth in the number of older residents will be concentrated primarily in areas with low migratory attractiveness and persistent population decline, implying that the consequences of ageing, such as rising demand for long-term care and healthcare services, will not be evenly distributed. Consequently, demographic ageing will become one of the factors reinforcing territorial inequalities and posing significant challenges to local public service systems and municipal finances.
Dominika Prudło
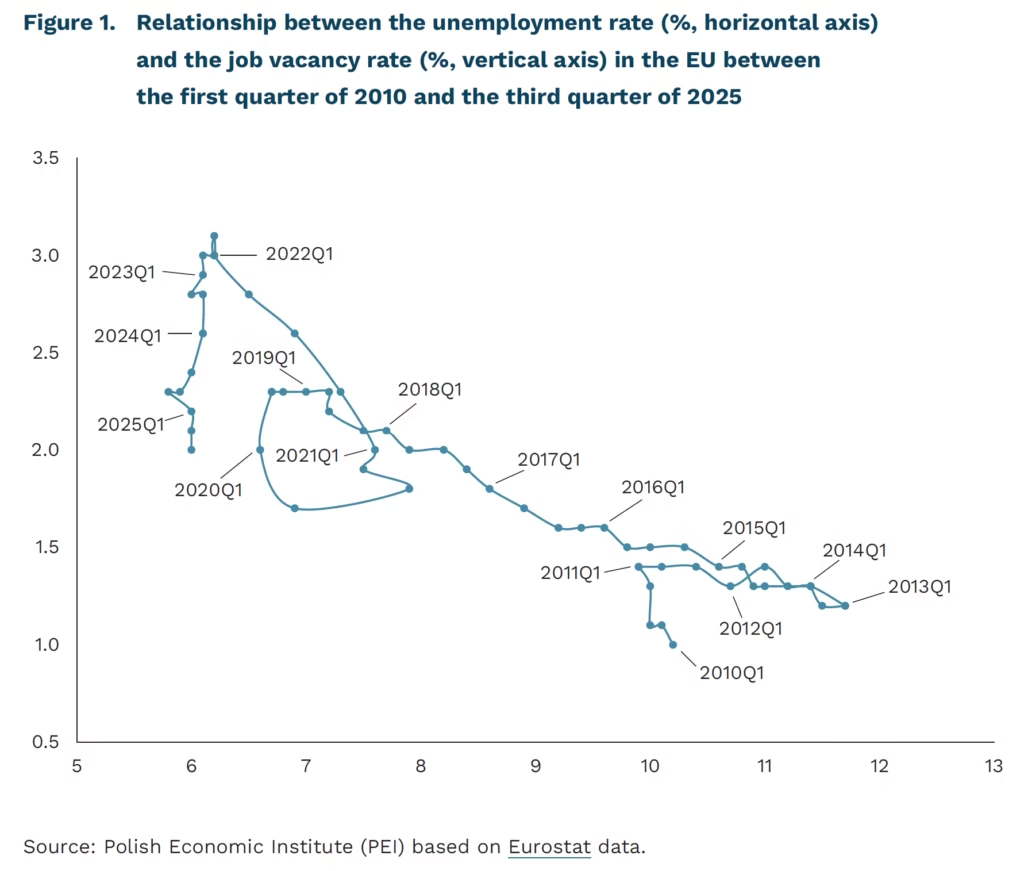
The EU unemployment rate remains stable, even as the number of job openings declines
2.0% was the EU job vacancy rate in the third quarter of 2025
5.9% was the EU unemployment rate in December 2025
The EU job vacancy rate has remained on a downward trend since the second quarter of 2022 despite favorable economic conditions. In the third quarter of 2025, the rate stood at 2.0%, down by 0.1 percentage points compared with the second quarter of 2025 and by 0.3 percentage points compared with the third quarter of 2024. This is the lowest EU job vacancy rate recorded since the COVID-19 recession.
Compared with the third quarter of 2024, the job vacancy rate in the third quarter of 2025 increased in only three member states and declined in a total of twenty. The largest decreases were recorded in Germany and Austria (-0.6 percentage points), Cyprus and Latvia (-0.5 percentage points), and Belgium and Finland (-0.4 percentage points in both countries). Meanwhile, the lowest vacancy rates were observed in Romania (0.6%), in Poland and Bulgaria (0.8% each).
It is noteworthy that the gradual decline in the EU job vacancy rate has not been accompanied by an increase in unemployment. Since the beginning of 2023, the unemployment rate has stabilized at around 6%, and according to the latest data, it stood at 5.9% in December 2025. The coexistence of a falling vacancy rate and a low, stable unemployment rate has been made possible to a significant extent by a relatively high level of labour hoarding, i.e., a situation in which employers are willing to retain employees despite a weaker economic outlook.
A range of macroeconomic and structural factors underlies the observed cooling of the labour market. A report by the International Labour Organization states that the stalemate in the labour market originates from a high level of geopolitical uncertainty as well as the challenge of population ageing. The latter discourages employers from layoffs due to fears of future labour shortages, which in turn reduces demand for new workers. These circumstances, combined with an ongoing implementation of AI, may constitute a potential barrier to labour market entry for young people.
Hubert Pliszka
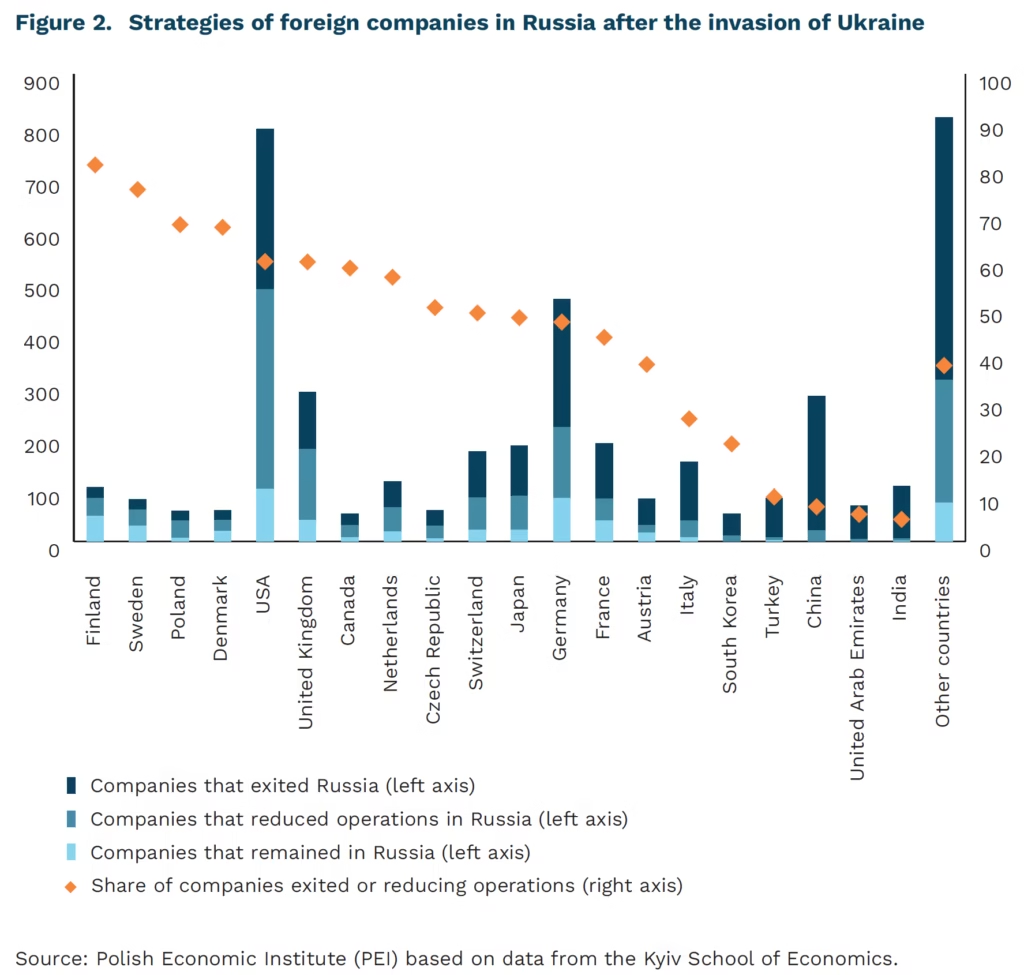
Western companies in Russia: leave or risk losing everything
547 foreign companies have exited Russia since 2022
45% of foreign companies have exited or scaled back their presence in Russia since 2022
68% of Polish companies have exited or scaled back their presence in Russia since 2022
The growing challenges facing the Russian economy are intensifying the struggle for the resources of Western enterprises operating in Russia. Moscow treats the seizure of Western assets primarily as retaliation for supporting Ukraine. The companies most exposed to confiscation are profitable firms from countries the Kremlin describes as “unfriendly.” It is difficult to estimate the scale of nationalization and asset takeovers by Russian companies, because some of this process unfolds through court proceedings, while some occurs through arbitrary decisions by the authorities. According to estimates by the law firm NSP regarding the nationalization of Russian and foreign companies, in 2025 assets with a total value of more than RUB 3 trillion were seized, which is 4.5 times the value in 2024. For example, in January 2026, by decree of Vladimir Putin, Russian companies took over the management of the Russian subsidiaries of the Polish-American packaging producer CanPack and the Danish insulation materials producer Rockwool. The companies were not saved by the fact that they chose not to leave Russia after the outbreak of the invasion of Ukraine. CanPack and Rockwool are among leaders in their industries.
Data from the Kyiv School of Economics (KSE) show that although 1,916 foreign companies have withdrawn or scaled back their operations on the Russian market, even more businesses (2,348) still remain there. At the same time, the 547 firms that fully exited Russia are enterprises of major significance – in 2021 they employed 42% of workers employed in foreign enterprises and generated 35% of the total revenues of foreign firms in the KSE database. A significant share of firms exiting Russia were sold at discounted prices – for example, Renault’s automotive plants were bought for one ruble. By contrast, Chinese, Indian, Turkish, or United Arab Emirates companies have withdrawn from Russia only to a limited extent.
On the one hand, the nationalization and confiscation of Western enterprises may make Western producers less willing to return to Russia even if the war in Ukraine ends and sanctions on Russia are lifted. On the other hand, Charles Hecker’s book “Zero Sum. The Arc of International Business in Russia”, based on interviews with Western businessmen in Russia, shows that many firms for a very long time did not expect that the march toward authoritarianism and the tightening of control over the economy under Putin would negatively affect their own investments. Regret over losing the Russian market is reflected in a statement quoted in the book by one American businessman operating in Russia: “You just don’t come back as Ford and expect to regain market share that’s been lost to Chinese brands.”
The economic situation will not encourage investors to return to Russia. Russia is entering another year of war in Ukraine with GDP growth of only 1%, falling exports, and a significant budget deficit. The flow of money being pumped into the economy is being reduced due to shrinking budget resources. This year’s problems appear more serious than in previous years due to low projected revenues from oil and gas exports, resulting from both sanctions and high supply of commodities on global markets. Moreover, data from the Bank of Russia (CBR) show a decline in domestic demand caused by inflation and the high cost of credit – on Friday the CBR will decide on the level of the key interest rate, which currently stands at 16%.
Jan Strzelecki
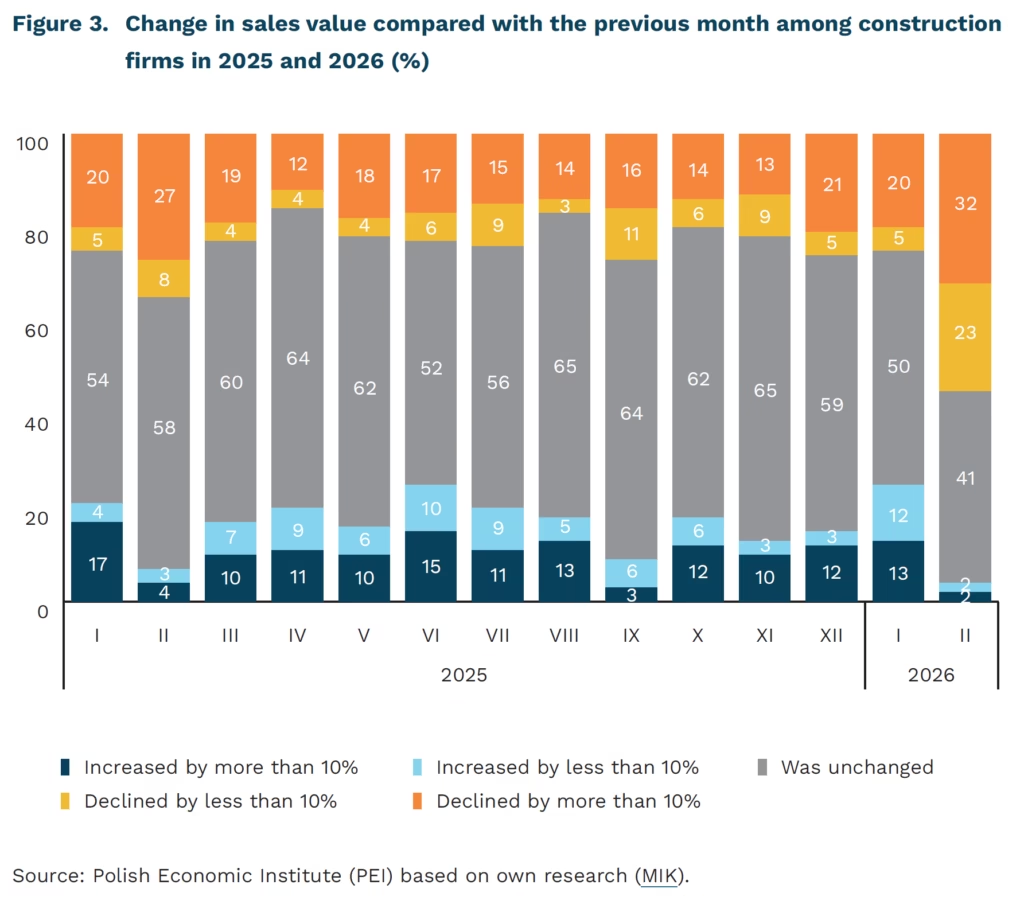
Accumulation of infrastructure investments as a challenge for the construction companies
55% of construction firms recorded a month‑on‑month decline in sales value in February 2026
51% of construction firms report a month‑on‑month decrease in the number of orders in February 2026
40% of construction firms maintain liquidity buffers sufficient to cover more than three months of operational expenses
Despite announcements of major infrastructure projects in Poland, the beginning of the year has not brought optimism to the construction sector. Negative business sentiment has outweighed positive sentiment since May 2025. Throughout 2025, both sales volumes and new orders remained broadly stagnant, with over half of firms reporting no meaningful change. In February 2026, the share of firms reporting month‑on‑month (m/m) declines in sales value surged to 55% (up from 25% in January), while the proportion reporting no change fell to 41% (from 50%). A similar pattern is evident in new orders: in February, 51% of firms reported an m/m decline in order intake (compared with 25% in January), and the share reporting no change dropped to 40% (from 63%).
Most construction firms maintain stable employment and wage levels. Despite rising labor costs, employment has remained unchanged in over 70% of construction companies for the past five months, and the share of firms planning to hire slightly exceeds those anticipating layoffs. At the same time, in February 2026, as many as 84% of firms reported maintaining current wage levels, while 15% announced pay increases. In the context of upcoming large-scale national investments – such as the construction of the CPK, the modernization of the railway and road networks and the development of nuclear power plant – these indicators may suggest that firms are preserving their operational capacity. However, with financial liquidity weakening (in February, only 40% of firms reported having resources sufficient to operate for more than three months), the sector is increasingly entering a phase of functioning on minimal financial buffers. This means that companies possess neither capital buffers (e.g., easily marketable assets) nor cash reserves (immediately available funds) that would allow them to quickly scale up activity. In practice, most firms operate on day‑to‑day liquidity management, which reduces their resilience to shocks.
Without state support – including adequate project planning and effective cost indexation – even firms whose current situation is stable may face tasks that exceed their operational capacity. The vast majority of construction firms in Poland are micro‑enterprises employing up to nine workers (97 % according to Eurostat). They do not maintain material inventories, and the smallest contractors operate under a liquidity model in which funds from one project are immediately used to cover the costs of subsequent contracts. This financing structure means that even minor delays in investor payments, sudden spikes in material prices, or increased staffing requirements can quickly destabilize their operations.
Katarzyna Zybertowicz
District heating will reduce emissions through sector coupling
31% less heat was supplied to Polish district heating customers in 2024 compared to 2002, thanks to increased efficiency of buildings and systems, and climate change
52% this is how much the hard coal consumption in district heating fell in 2024 when compared to 2002. Use of natural gas and biomass increased
PLN 466 billion according to analyses by the Polish Heat Energy Association, this is how much could the transformation of the sector by 2050 cost
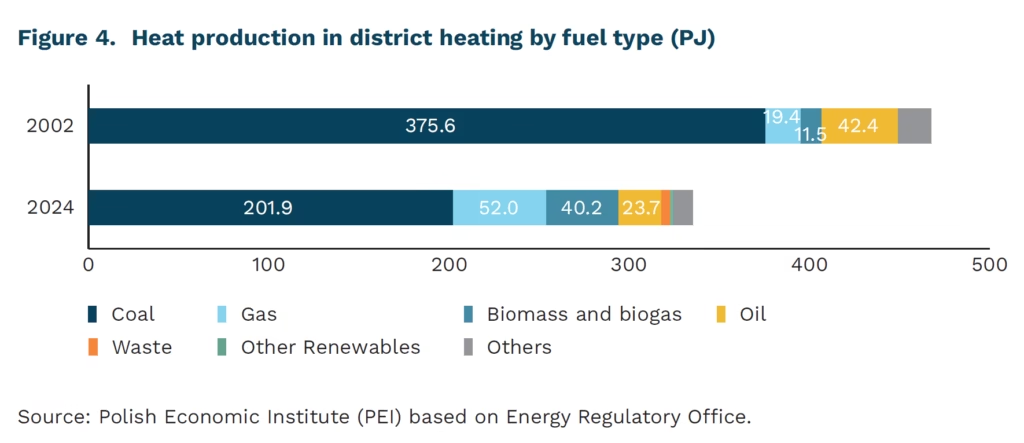
44.3% of households in Poland heat their premises with district heating (Central Statistical Office data for 2024). The Polish district heating market is the second largest in the European Union, after Germany. Although the length of networks and the number of buildings connected are steadily growing, the amount of heat supplied to consumers has been declining in recent years due to milder winters and improving energy efficiency of heat distribution and buildings. According to a report by the Energy Regulatory Office, 207 PJ of heat was supplied to consumers in 2024, compared to 299 PJ in 2002.
The share of coal fuels in district heating production fell from 81.7% to 57.4% between 2002 and 2024. They were replaced by gas fuels (an increase from 3.7% to 15.2%) and renewable energy sources (from 2.9% to 14.5%), with biomass combustion accounting for 97% of the latter category. The use of biomass reduces the cost of greenhouse gas emission allowances, but the availability of sustainable biomass is limited, which means that this technology will have to play a smaller role in the further course of the transition.
Over the past decades, heating plants and combined heat and power plants have significantly reduced their negative impact on the environment. The intensity of climate-damaging CO₂ emissions fell by 18% between 2002 and 2024. Emissions of substances hazardous to health fell even more significantly: sulphur dioxide (-86%) nitrogen oxides (-63%) and particulate matter (-93%). Modern district heating, even if still based on coal, is a better alternative to individual heating using solid fuels from a public health perspective.
64% of district heating was produced in cogeneration. Combined heat and power generation allows for high overall process efficiency (up to 90%). During severe cold periods, combined heat and power plants secure both municipal heating systems and the encumbered power system (on 3 February 2026, the power demand of the National Power System reached 27.7 GW net).
Further transformation of district heating will be based on sector integration and improved flexibility. Combined heat and power plants will operate more flexibly, covering the electricity demand at times of low generation from wind and solar sources. In turn, at times of high production from renewable energy sources, cheap electricity will be converted into heat via electrode boilers or large heat pumps (Powet to Heat solutions). The former technology requires less investment, but is also less efficient, suitable for use during hours with the cheapest electricity (1,100 hours per year in the future system modelled in the report by the Polish Association of Heat Energy). On the other hand, more expensive high-efficiency heat pumps will operate more stably (4,200 hours). The implementation of the above solutions will be complemented by the development of large-scale heat storage facilities and, ultimately, a reduction in the temperature in district heating networks. According to the Association, the process will require several regulatory changes and the implementation of new financing mechanisms, given the scale of the necessary investments (up to PLN 466 billion by 2050) and the impossibility of passing on all the costs of the transformation to end users.
Michał Smoleń
Africa’s wide digital divide
36% of Africa’s population using the Internet in 2025
91% of Morocco’s population using the Internet in 2023
13% of Chad’s population using the Internet in 2023
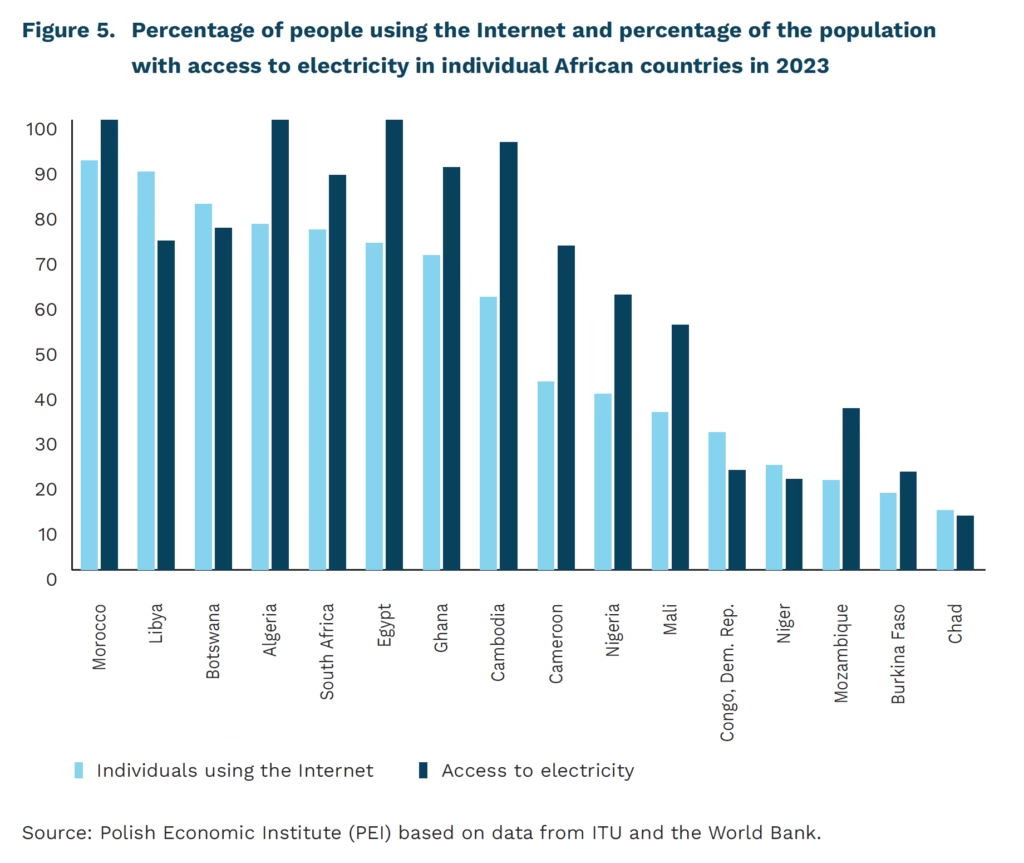
According to data contained in the Facts and Figures 2025 report published by the International Telecommunication Union (ITU), in 2025, 36% of Africa’s population used the Internet, which represents an increase of 11 percentage points compared to 2019. This is the lowest rate among the regions highlighted. In Europe, the Commonwealth of Independent States, and the Americas, the rate ranged from 88% to 93%, while in Asia-Pacific and Arab States, it was 77% and 70%, respectively. A closer look at the data shows that Africa is a very diverse continent, with countries recording both very high and very low levels of internet use. Barriers to effective connectivity start with the most fundamental constraints, such as access to electricity.
In 2023 (the latest national data for individual countries available from the ITU), 72% of people in Gabon used the Internet, 76% in South Africa, and 82% in Botswana. On the other hand, in Mozambique it was only 20%, in Burkina Faso 17%, and in Chad 13%. These figures illustrate how diverse the African continent is in this respect. It is also worth noting that in the ITU report, Algeria (77% of Internet users in 2023), Egypt (73%), Morocco (91%), and Libya (89%) were classified as belonging to the Arab States region rather than Africa. This also highlights the diversity of the continent and may underestimate the rate for Africa as a whole.
Problems with access to electricity contribute to limited internet access. According to World Bank data, 100% of the population had access to electricity in Egypt, Algeria, and Morocco in 2023. In Botswana, South Africa, and Gabon, access ranged from 76% to 94% of the population. In Mozambique, it was 36%, in Burkina Faso 22%, and in Chad 12%. This variation significantly affects the spread of digital services, limiting the ability to use devices, connectivity, and basic telecommunications infrastructure. At the same time, according to the authors of another ITU report, the lack of electricity in Africa leads to situations where network operators use diesel-powered generators, which significantly increases the cost of using the Internet.
The data presented above indicate that Africa is not a single, uniform digital market, but rather a collection of very different development trajectories – ranging from countries with high Internet penetration and almost complete electrification (North Africa and parts of Southern Africa) to countries where basic infrastructure barriers still prevent mass Internet use (mainly Central Africa). In the debate on the progress of digitalization in Africa, it is worth consistently limiting the use of averages for the entire continent in favor of subregional comparisons and infrastructure indicators, in particular electrification – without its improvement, programs focused solely on connectivity or digital services will have limited reach and sustainability.
Filip Leśniewicz
Women’s education pays off for future generations
45% average increase in women’s cumulative earnings per additional year of schooling (NBER study)
33% average increase in earnings among employed women per additional year of schooling (NBER study)
Although historically higher levels of female education were associated with lower fertility, this relationship is no longer consistently negative in many developed countries. For example, in Denmark, Norway, and Sweden, the negative association between women’s higher education and fertility has largely disappeared. In fact, the highest rates of childlessness are now observed among women with lower levels of education.
Research published by NBER shows that investments in women’s education generate lasting returns to human capital – not only for women themselves but also for the next generation. The authors draw on comprehensive administrative data from California, including birth registrations from 1960-2017, maternal and infant health records, and linked tax data. The analytical sample comprises hundreds of thousands of mothers – approximately 350,000 in the birth records and around 290,000 in the income panel.
The empirical strategy identifies causal effects rather than mere correlations. It makes use of institutional features of the US education system, namely a strict school entry age cutoff combined with compulsory schooling until age 18 or completion of upper secondary school. In the cohorts examined, children could start school in a given academic year only if they had turned five by 1 or 2 December (depending on the cohort). Consequently, children who started school later reached the age of 18 while still in Year 11 and were no longer legally required to remain in school before completing the full twelve-year cycle.
By comparing women born just before and just after the cutoff date, the authors constructed two almost identical groups. The only systematic difference between them was eligibility to start school earlier or later, thereby creating a natural experiment. This institutional setting allowed the authors to estimate the causal impact of additional maternal education on women’s labour market trajectories and child outcomes.
Longer maternal education yields substantial labour market gains, which persist after childbirth. An earlier start in schooling increases the likelihood of completing the full secondary cycle and enrolling in higher education. The returns to education increase over the life course, strengthening with age and career progression. In other words, motherhood does not offset educational investments. Each additional year of schooling increases women’s labour force participation and substantially raises earnings: cumulative earnings increase by an average of 45%, while earnings among employed women rise by 33%. These gains extend beyond pay, encompassing job quality and occupational status, including improved working conditions, greater prestige, increased social value of tasks performed, and stronger coworker networks.
Improvements in children’s well-being occur alongside, rather than at the expense of, mothers’ careers. Children of better-educated women show better health outcomes at birth, particularly when born during the middle phase of their mothers’ careers (ages 25-40). Better-educated mothers are less likely to smoke during pregnancy and less likely to rely on state support, indicating greater household financial stability.
Overall, longer education for women generates benefits that extend beyond individual labour market outcomes: it strengthens women’s economic position while simultaneously improving children’s health, financial security, and developmental prospects. In contemporary high-income societies, women’s education and career advancement can coexist with motherhood and child well-being, and may even reinforce intergenerational human capital accumulation.
Iga Rozbicka