Economic Weekly 8/2026, February 27, 2026
Published: 27/02/2026
Table of contents
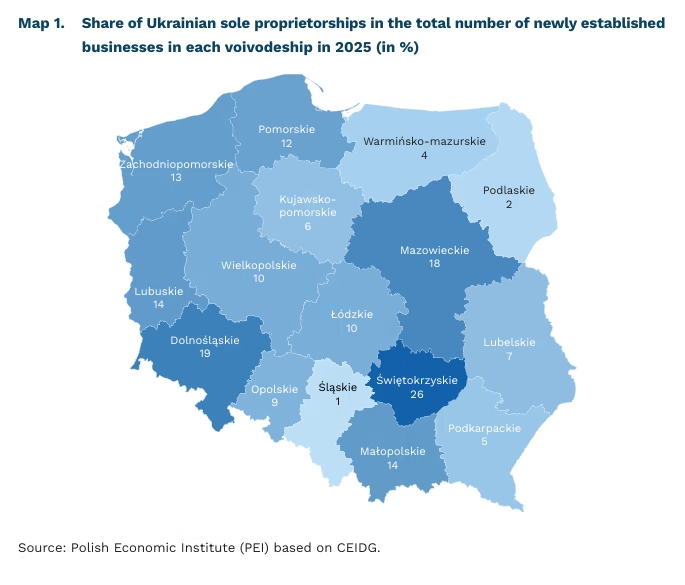
More than half of Ukrainian sole proprietorships concentrated in three Polish voivodeships
31.4 thousand sole proprietorships were registered by Ukrainian citizens in Poland in 2025
54% of Ukrainian sole proprietorships were established in three voivodeships: Mazowieckie, Dolnośląskie and Małopolskie
39% of Ukrainian sole proprietorships in the Lubelskie voivodeship operate in construction
In 2025, 31.4 thousand sole proprietorships run by Ukrainian citizens were established in Poland, according to data from the Central Registration and Information on Business (CEIDG). These businesses accounted for 12% of all newly registered sole proprietorships in Poland. More than half of the new businesses were registered in the Mazowieckie, Dolnośląskie and Małopolskie voivodeships (28%, 14% and 12%, respectively). In these regions, Polish entrepreneurs established a total of 35% of all sole proprietorships created in 2025. The highest share of Ukrainian sole proprietorships in the total number of newly established businesses in individual regions was recorded in the Świętokrzyskie (26%), Dolnośląskie (19%) and Mazowieckie (18%) voivodeships. The lowest share was observed in Śląskie (1%) and Podlaskie (2%).
Ukrainian entrepreneurs most often established construction companies (24%), businesses in other service activities (14%), and companies providing telecommunications and computer programming services (13%). However, the sectoral structure varies across regions. The highest share of construction companies was recorded in the Lubelskie (39%), Zachodniopomorskie (32%) and Podlaskie (29%) voivodeships. Telecommunications and computer programming services are particularly prominent in Małopolskie (28%, significantly above the national average). In Podlaskie (23%) and Kujawsko-Pomorskie (22%), more than one in five sole proprietorships run by Ukrainian citizens operates in other service activities (compared to around 10% nationwide). The Pomorskie voivodeship stands out with a relatively high share of businesses in accommodation and food service activities (11%, compared to the national average of 4%).
In all voivodeships, surveyed Polish enterprises more often assess the impact of Ukrainian companies on competitiveness in their sector as weak rather than strong, according to the February Monthly Business Climate Index (MIK) survey. 75% of surveyed Polish firms in the Warmińsko-Mazurskie voivodeship consider the impact of Ukrainian businesses to be limited. A similarly high share of such opinions was recorded in the Podlaskie (72%) and Dolnośląskie (60%) voivodeships. By contrast, in Lubuskie, Opolskie and Zachodniopomorskie only slightly more than one third of firms report a weak or very weak impact on market competitiveness.
Aleksandra Wejt-Knyżewska
The goods trade deficit accompanies the GDP recovery
-82% the correlation between the cyclical components of GDP and the trade balance is as high as that
EUR -13.2 bn was Poland’s goods trade deficit in 2025 according to balance of payments data
EUR 39.3 bn was Poland’s services trade surplus in 2025
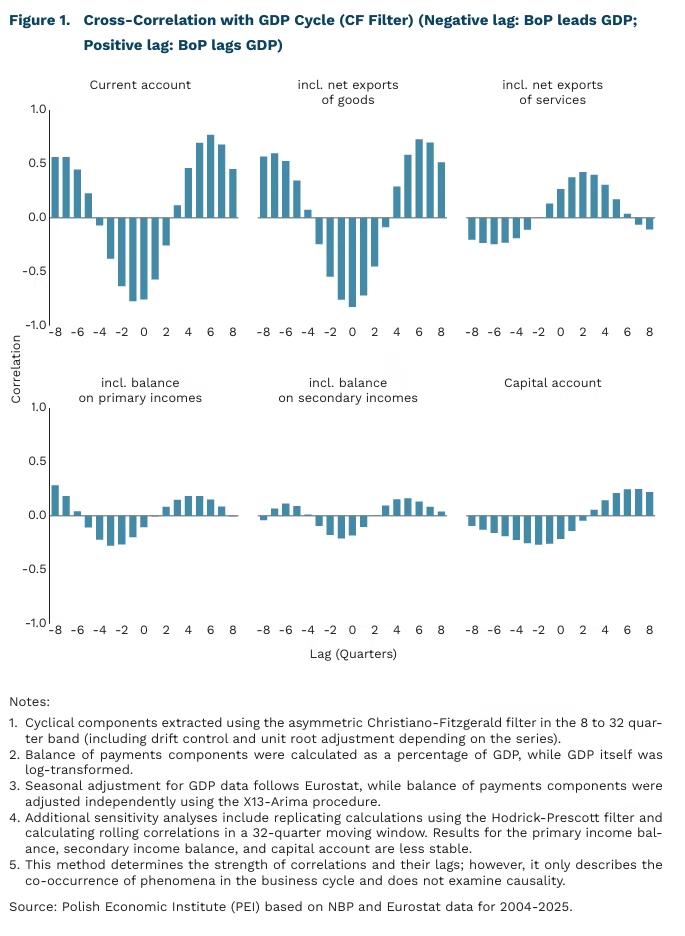
International trade is generally quite strongly correlated with the GDP cycle. While net exports of goods (exports minus imports) are counter-cyclical, meaning they decrease when GDP grows – net exports of services are strongly correlated, but with a lag. This means that growth in services continues after the peak of GDP growth. In contrast, capital f lows show a low correlation.
Net exports of goods are strongly counter-cyclical. This means that during periods of economic boom, the net exports of goods are usually at their cyclical weakest (with a correlation of -82%). This phenomenon may be linked to two processes. First, an improvement in the domestic economic climate increases the demand for imported goods – both consumer and investment goods. Additionally, periods of economic slowdown are accompanied by a weaker zloty and improved export competitiveness. Goods also have the greatest impact on cyclicity across the entire current account.
The current economic situation illustrates the counter-cyclical nature of trade in goods. Poland is in a phase of economic expansion – in 2025 alone, GDP growth reached 3.6%, and the consensus of forecasts suggests a similar result this year. At the same time, the goods trade deficit more than doubled – from EUR 6.2 billion in 2024 to EUR 13.2 billion in 20251.
The peak of services exports occurs after an economic boom. Cyclical fluctuations in services exports strongly correlate with GDP not only at the height of the business cycle but for the following four quarters as well. In this case, however, the scale of cyclical f luctuations is small – averaging only 0.3% of GDP (compared to almost 1.0% for goods). In services trade, the trend accounts for over 93% of the variance in the data (compared to 67% for goods)2. The most important feature of Poland’s services trade is the constant trade surplus, which we maintain regardless of the business cycle – in 2025, it amounted to EUR 39.3 billion.
Cyclical effects in income transfers and the capital account are much weaker. For these variables, correlation coefficients are low and unstable depending on the chosen period. This suggests that business cycle fluctuations have little dependence on EU fund transfers (capital account, e.g., due to lags between the inflow and the actual use of funds in the economy), profit transfers from foreign direct investment located in Poland (primary income balance), or wealth transfers (secondary income).
- Data based on the balance of payments. Not fully comparable with foreign trade data published by Statistics Poland (GUS).
- Defined as variance decomposition.
Marcin Klucznik
Every fifth Pole does not fully utilize their skills at work
nearly 18% of Poles do not use their qualifications in their jobs
7% higher wages earn employees in Poland who use influencing skills at work
4% higher wages earn employees who use information and communication technologies
Nearly 18% of Poles work in jobs below their qualifications. This places Poland significantly below the OECD average, where the phenomenon affects 26% of surveyed employees. Differences between countries in the level of skills utilization may result from varying levels of technological advancement across economies. This is indirectly indicated by the fact that the highest values of this indicator are recorded in highly developed countries such as the United States (39%) and Germany (32%). These countries are characterized by advanced employment structures, a high share of innovative sectors, and greater labor market dynamism, enabling better matching of competencies to employers’ needs.
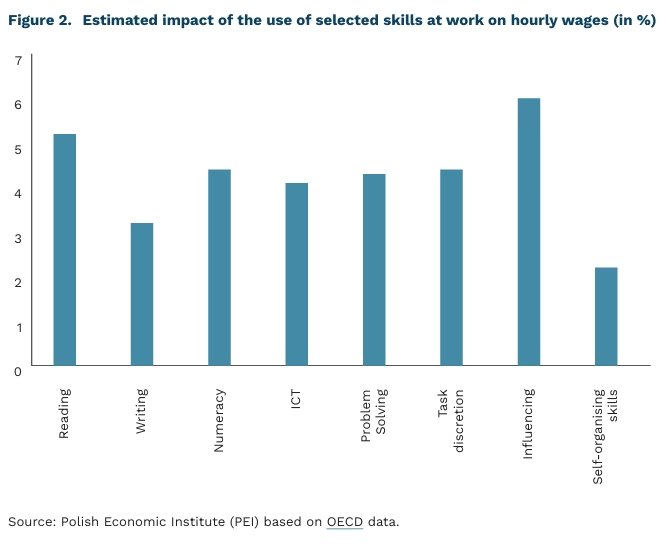
Using one’s skills at work increases employee productivity and thus positively affects earnings. According to OECD analysis, skills related to influencing others’ decisions have the strongest impact on income growth. On average across OECD countries, using these skills is associated with an approximately 6% increase in wages; in Poland, the estimated impact is 7%. Other skills that translate into higher earnings include reading comprehension, problem-solving, task discretion, numeracy, and proficiency in using information and communication technology (ICT) tools. According to OECD estimates, using these skills at work increases hourly wages by 4-5%, regardless of educational attainment.
Skills related to information processing are gaining importance. Over the past decade, most OECD countries have seen a significant increase in the use of skills related to reading comprehension, writing, numeracy, problem-solving, and the use of ICT. In the 2023 PIAAC survey, the increase in the number of responses declaring the use of these skills ranged from 0 to 1.5 points on a five-point scale compared with results from ten years earlier. In Poland, the pace of these changes has been lower than in most OECD countries. The exception is the use of ICT, where Poland recorded a significant increase in workplace usage. This category also experienced the largest overall growth across the OECD area.
Using one’s skills may contribute to higher well-being and reduce the risk of burnout. More frequent use of skills at work is associated with greater life satisfaction and higher work engagement. The strongest estimated impact was observed for skills related to autonomy in solving and evaluating one’s own tasks. In contrast, underutilization of skills and job monotony increase frustration and the likelihood of burnout symptoms (Edú-Valsania et al., 2022).
Julian Kocerka
We need to standardize the way AI usage is measured in companies
69% of surveyed companies in the US, UK, Germany, and Australia have implemented some form of AI
0.29% increase in the productivity of the surveyed companies due to the use of AI
0% total net effect of AI use on employment in the surveyed companies
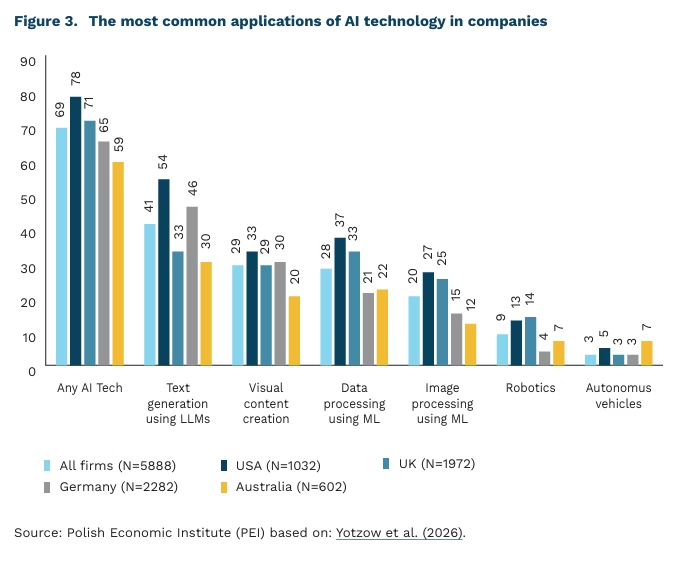
On average, 69% of companies in the US, UK, Germany, and Australia currently use some form of AI, according to a study published by researchers from Stanford University and the central banks of the US, UK, and Germany, among others. The results come from large panels conducted by central banks and Macquarie University on company executives, and according to the authors, the data collected is representative of the economies surveyed. The researchers emphasize the importance of data quality, as increased media interest in AI has led to a large amount of new data related to the use of this technology, the reliability of which remains highly variable.
The results cited above also differ from the official indicators of statistical offices – data from the British ONS indicate that only 23% of companies used use AI in 2025, and German Destatis indicates 25.97%[3]. This means that in these cases there is a difference of up to three times between the data from statistical offices and the results of central bank surveys. Such large discrepancies make it impossible to clearly assess the reliability of data on the adoption of AI technology in companies, but it is also worth looking at the other results of the survey.
There is considerable variation in the level of individual AI applications. On average, 41% of the companies surveyed reported using large language models (LLMs) for text generation, while about 30% reported using machine learning for data processing and generating visual content using AI. Less popular applications included robotics (9%) and autonomous vehicle operation (3%).
Companies’ declarations indicate a continued willingness to implement AI, with the use of machine learning in data processing attracting the most interest. Such plans were also declared by companies with limited experience in data processing, suggesting a need for them to acquire new skills.
Based on the characteristics of the surveyed companies, it was determined that AI is more often used by larger, more productive[4] entities that pay higher salaries. At the same time, as the age of the company and the age of the management staff increase, the likelihood of using AI decreases.
90% of companies declared that AI had no impact on employment in the last three years, with the statistical effect of AI on employment during this period amounting to 0%. Similarly, 89% of companies reported no impact of AI on productivity over the three years, although the authors estimated that the average productivity growth during the period studied was 0.29%.
Research on the use of AI in enterprises is still in its early stages, which results in a lack of standardized measurement tools and short data series. This makes it difficult to interpret results, compare studies, and track changes over time. Despite the authors’ assurances about the representativeness of the data used, the discrepancies that exist cause interpretation problems.
3. There are differences in the selection of companies for the surveys. The data from the Bank of England used in the study covers companies with 10 or more employees, while the data from the statistical office also includes companies with 0 employees. In the case of data from Germany, the situation is reversed – the Federal Bank’s data covers companies employing at least one employee, while the German statistical office’s data covers those employing 10 or more.
4. Productivity was calculated as sales per employee.
Jakub Witczak
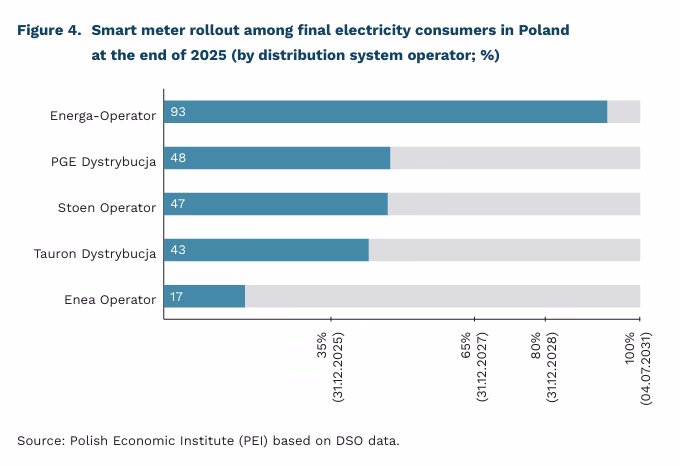
Nearly half of Polish electricity consumers use smart meters
49.8% of electricity consumers in Poland are equipped with smart meters
135 electricity consumers had used dynamic tariffs by the end of 2024
According to data from distribution system operators (DSOs), 9.6 million smart meters have already been installed in Poland. This means that nearly half (49.8%) of final electricity consumers are now using such devices. The share of consumers equipped with smart meters varies significantly depending on the operator, ranging from 17% (Enea Operator) to 93% (Energa-Operator). The smart meter rollout also varies across EU Member States. For example, Germany records one of the lowest levels (15% of consumers have smart meters), while in Sweden nearly all consumers already had them by 2009.
The ongoing nationwide rollout in Poland constitutes the implementation of Directive (EU) 2019/944 of the European Parliament and of the Council. In Poland, targets for smart meter rollout were introduced through a 2021 amendment to the Energy Law Act. Under its provisions, DSOs are required to provide smart meters to all final electricity consumers by 4 July 2031. The law also defines interim milestones: 35% by 31 December 2025, 65% by the end of 2027, and 80% by the end of 2028. The replacement of meters does not entail any direct costs for electricity consumers – DSOs cover the costs of both the device and installation.
Remote measurement of electricity consumption allows consumers to monitor their usage in real time. This may encourage both overall energy savings and reductions in consumption when electricity prices are higher. Dynamic tariffs serve the latter purpose and were introduced in Poland in August 2024. According to the Energy Regulatory Office (URE), 135 consumers had taken advantage of this offer by the end of 2024. URE indicates that the initially low interest in dynamic tariffs may have been a consequence of the electricity price freeze. Interest may also increase alongside further progress in the rollout of smart meters, which are a necessary requirement to start using dynamic tariffs.
As noted by the European Union Agency for the Cooperation of Energy Regulators (ACER), fixed electricity tariffs still dominate in most EU countries, limiting the spread of demand-side flexibility. However, ongoing electrification of the economy and the growing share of renewable energy sources in the system mean that the role and potential of demand-side flexibility will increase. Among both households and industrial consumers, it may play a key role in reducing the overall cost of the energy transition.
Marianna Sobkiewicz
Ukraine’s Economy Under War Conditions
1.8% is the projected real GDP growth for Ukraine in 2026, accompanied by a slowdown in inflation to 7.5%
$587.7 bn represents the total estimated reconstruction needs for Ukraine over the next decade
The war has permanently lowered Ukraine’s economic potential. In 2022, GDP plummeted by 28.8%, and despite a subsequent recovery, output and per capita income remain below pre-full-scale invasion levels. The rebound is gradual but constrained. In 2026, GDP is expected to grow by 1.8%, reflecting moderate dynamics amid energy shortages, destroyed infrastructure, and heightened security risks. A more pronounced acceleration is forecasted only in the following years, as production capacity is restored.
Inflation is gradually decelerating, although the disinflation process is not yet complete. The CPI is projected to fall to 7.5% by the end of 2026, compared to 8% in December 2025. Price stability is supported by tight monetary policy, a more stable exchange rate, and strong agricultural performance. Energy prices and cost pressures within the public sector remain primary risks. A return to the inflation target of 5% is expected in 2028.
Ukraine remains heavily reliant on international assistance. The country is slated to receive approximately $51.4bn in 2026, $42.7bn in 2027, and $21.6bn in 2028 – totaling over $115bn over three years. The 2026 inflow is equivalent to roughly one-fifth of the projected GDP, highlighting the scale of external support. The public finance deficit will remain very high – at approximately 19% of GDP in 2026 – but is expected to gradually decrease to 14% in 2027 and 9% in 2028. Such significant transfers will allow for the maintenance of high foreign exchange reserves – roughly $65bn by late 2026 and $73bn a year later – which is crucial for exchange rate and financial system stability. Thus, Ukraine’s macroeconomic stability remains directly dependent on the continuity and predictability of foreign financing.
The scale of war-related destruction generates massive financial requirements, exceeding the country’s projected 2025 GDP nearly threefold. The World Bank estimates the total cost of Ukraine’s reconstruction at $587.7bn over a ten-year horizon. Direct damage to infrastructure and buildings reached $195.1bn by the end of 2025. The heaviest damage is concentrated in housing ($61.1bn), transport ($40.3bn), and energy ($24.8bn). Meanwhile, reconstruction priorities for 2026 are estimated at $15.25bn, while secured financing covers only about $5.77bn, indicating a significant funding gap at the program’s outset. The cost of reconstruction is markedly higher than the value of the damage itself, as it includes replacing assets at current prices and new technical standards – often using more modern, energy-efficient, and expensive technologies – whereas the destroyed facilities were largely depreciated. The report also highlights the opportunity for modernization under the “build back better” framework and indicates that with appropriate reforms, the private sector could cover up to 40% of reconstruction needs.
Sebastian Sajnóg
Ambiguous benefits and costs of remote work
44% of EU employees whose jobs allow remote work exercise a hybrid model
Approx 10% of all employees in Poland work remotely usually or sometimes
While many multinational companies have returned to office-based models, citing reduced employee productivity and weakened workplace culture, data from a Eurofound report indicate that hybrid work is the most commonly practiced model among EU workers whose job characteristics allow remote work. 44% of them combine on-site and remote work, while 41% work fully on-site (a 5-percentage point increase compared to the previous year). Poland’s Central Statistical Office (GUS) estimates that approximately 10% of employees in Poland work remotely either usually or occasionally.
The balance of benefits and costs of remote work varies depending on the sector and individual preferences. Existing research shows that this form of work cannot be unequivocally assessed as economically desirable or undesirable. Among the benefits for employees, the most frequently cited are the ability to spend more time with family, and savings in time and expenses related to commuting. In the United Kingdom, for example, the average annual cost of commuting to work in London has been estimated at £5,000. On the other hand, a major challenge of remote work is the lack of a clear boundary between work and home life, which can negatively affect employees’ psycho-physical well-being.
On the employer side, the main benefits mentioned include savings related to property maintenance (rent, utilities, insurance), as well as easier recruitment processes and lower employee turnover. Productivity remains a less clear-cut issue. The results of existing research in this area are inconclusive.
Employees often rate their own productivity more positively when working outside the office or employer’s premises. Employers, however, tend to believe the opposite. These differences may stem from different understandings of productivity. Employees view the time saved on commuting as an automatic increase in work efficiency. One highly cited randomized controlled trial (RCT) was conducted in the largest travel company in China. Employees randomly assigned to remote work showed 13% higher productivity compared to the control group working in the office. It turned out that remote employees worked longer in nominal terms because they took fewer breaks and used fewer sick days.
Other studies indicate opposite trends. Among the causes of lower productivity, researchers point to slower and less effective communication, increased coordination costs, greater siloing, more difficult knowledge and information exchange, and consequently slower onboarding of younger, less experienced employees.
Most analyses suggest that although the effects of fully remote work are ambiguous for both employees and employers, the increasingly common hybrid model (e.g., two days of remote work per week) is less problematic. Research also indicates that this model is most often associated with higher productivity (compared to the traditional model) or no significant productivity effects.
Agnieszka Wincewicz-Price