Economic Weekly 15/2026, April 17, 2026
Published: 17/04/2026
Table of contents
Global Current Account Imbalances Are Growing
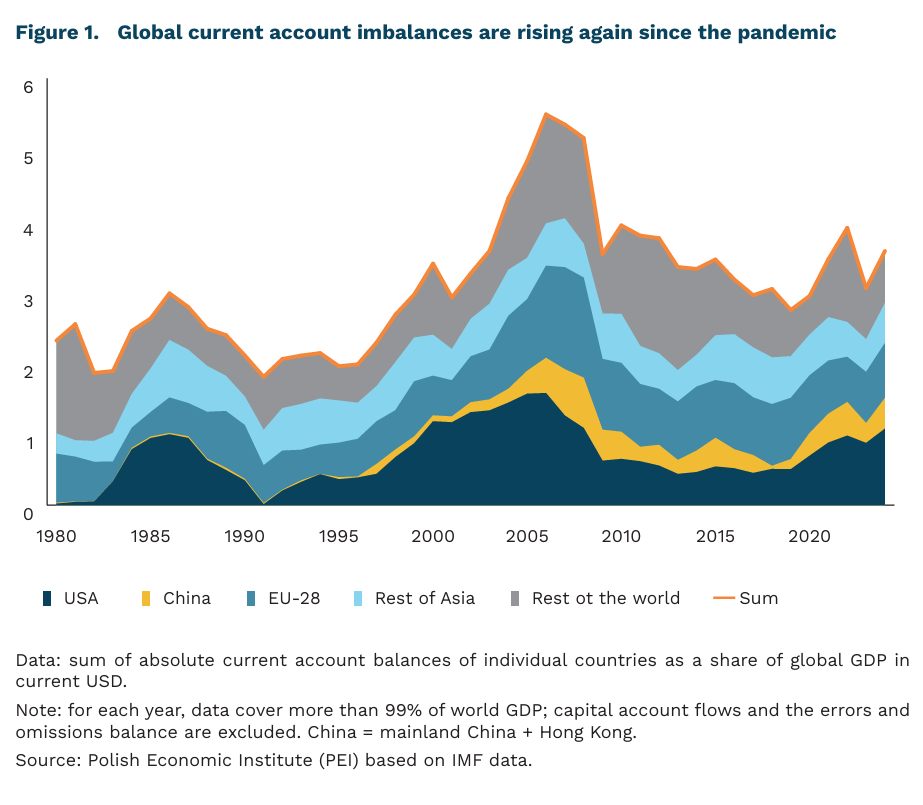
current account imbalances have risen from 2.0% to 3.5% of global GDP since 1996
the US, China, and the EU-28 accounted for approximately 63% of global imbalances in 2024
The current account (CA) balance measures the flow of goods, services, and income between a given economy and the rest of the world, and by definition equals the difference between domestic savings and investment. An economy that invests more than it saves must finance the gap through capital inflows from abroad and records a CA deficit – as is the case, among others, in fast-growing economies. An economy that saves more than it invests will “export” savings and record a CA surplus (e.g. in trade in goods or services). This can occur in ageing societies whose savings finance investment elsewhere in the world in exchange for investment income. CA imbalances are not inherently negative, but they can give rise to international tensions.
The scale of global imbalances has, however, grown significantly in recent years. Their magnitude, measured by CA flows, declined following the financial crisis, but since 2021 has again exceeded 3% and in 2025 stood at 3.5% of global GDP. At the same time, the average duration of a surplus or deficit episode has doubled since the 1980s. The bulk of imbalances is driven by just a handful of large economies – in 2024, primarily the US, China, and EU member states.
The accumulation of excessively large imbalances also poses risks to international stability. Since the largest economies tend to maintain permanent surpluses (e.g. Japan, China, the EU) or deficits (primarily the US), these amounts accumulate into ever-larger net foreign assets or liabilities vis-à-vis the rest of the world (the so-called net international investment position, NIIP). According to IMF estimates, valuation changes on already-accumulated liabilities now have a greater impact on the net position than international trade flows. As a result, sudden and disorderly shocks (e.g. changes in interest rates, exchange rates, or financial crises) may have increasingly powerful global effects.
Industrial policy can affect global imbalances. The IMF proposes a distinction between “micro” and “macro” industrial policy:
- “Micro” instruments target individual firms or sectors – e.g. tax incentives, subsidies, or preferential credit for specific purposes. Their impact on GDP can be either positive or negative, but is typically too small to have a significant effect on the CA or NIIP.
- “Macro” instruments operate at the level of the economy as a whole – e.g. manipulation of interest rates, accumulation of foreign exchange reserves, and exchange rate policy. This category can also include “micro” instruments applied broadly enough to affect the entire economy. The IMF notes that such instruments can lead to a sustained increase in the CA surplus at the expense of household consumption and should therefore be monitored from the perspective of international stability.
European imbalances are unlikely to stem from industrial policy. EU member states have maintained a systematic NIIP surplus over recent decades – most notably, the euro area’s net position shifted from a deficit of €2.3 trillion in 2013 to a surplus of €1.8 trillion in 2025. This shift is, however, largely attributable to population ageing and the fragmentation of European markets, which reduces the attractiveness of investing within the EU relative to the rest of the world (cf. E. Letta’s report on the European Single Market). Meanwhile, a large share of European industrial policies (the Green Deal Industrial Plan, the Chips Act, the Net-Zero Industry Act, CBAM, IPCEIs, etc.) are primarily sector-specific measures, which in IMF terms would be classified as “micro” policies.
To reduce global imbalances, the three largest players (responsible for 63% of the total) should pursue policies that support: higher savings in the US; greater consumption and liberalised capital flows in China; and higher investment in the EU.
Marcin Klucznik, Aleksandra Sojka
Hungary has received only 9% of EU funds from the RRF
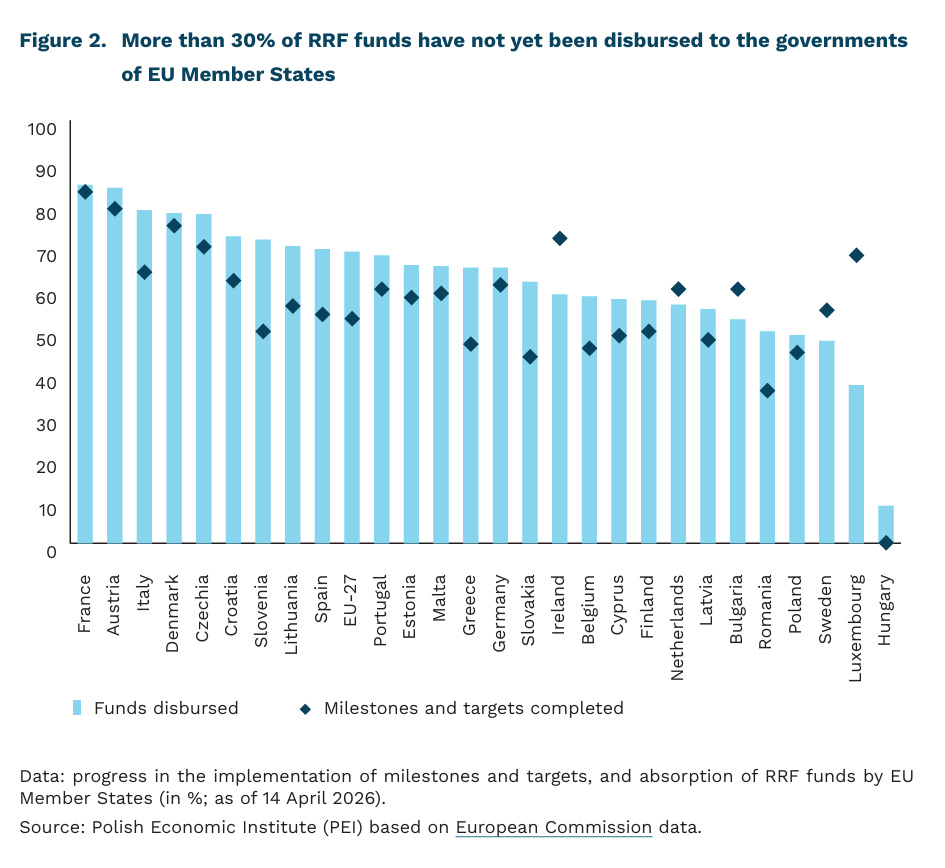
31% of RRF funds have not yet been disbursed to the governments of EU Member States
49.2% of KPO funds have so far been received by Poland
9% of RRF funds have so far been received by Hungary (the lowest in the EU)
Disbursements from the Recovery and Resilience Facility (RRF) are entering a decisive phase. Since the launch of the program, total RRF payments to Member States have reached approximately EUR 398 billion. In the best-case scenario, RRF disbursements in 2026 – the final year of its operation – will amount to around EUR 180 billion, more than double the amount paid out in 2025. This slow implementation of the RRF has been driven by the unprecedented scale of funding, administrative bottlenecks in Member States, and numerous external shocks during the program’s execution.
The implementation of RRF disbursements varies significantly across the EU. So far, Member States have completed on average 53% of the milestones and targets set by the European Commission, while average fund absorption stands at around 69%. The leaders in RRF fund absorption are France, Austria, and Italy, which have received 85%, 84%, and 79% of their allocated funds, respectively.
Poland ranks fourth from the bottom in the EU in terms of absorption of funds under the National Recovery Plan (KPO), the national equivalent of the RRF. As the third-largest beneficiary of the program, it has so far received 49.2% of its total allocation, having met 45% of all milestones and targets. This relatively low absorption rate is primarily due to the delayed launch of the program for Poland and suggests that the coming months will be absolutely crucial for the country’s full implementation of the RRF.
Hungary ranks last in terms of RRF fund absorption, having received only EUR 920 million in pre-financing, which accounts for just 9% of its planned allocation. It should be noted, however, that the Hungarian government under Viktor Orbán had been in open conflict with the European Commission over judicial independence and the protection of the EU’s financial interests. Nevertheless, the victory of the pro-European TISZA party in the Hungarian parliamentary elections opens the possibility of unlocking RRF funds, provided that milestones are met. Given the tight timeline and the current state of implementation of the required reforms and investments, full absorption of RRF funds by Hungary by the end of the year appears unlikely.
Although most EU countries have already achieved at least half of their milestones, the overall macroeconomic impact of the RRF will be lower than initially expected. According to recent estimates, the long-term cumulative increase in EU GDP due to the RRF is expected to range between 0.3% and 0.7%. The accelerated pace of implementation in the final stage – favoring easily executable projects – as well as numerous revisions of national programs may weigh on the quality of investments and reforms. Combined with an unfavorable geopolitical environment, which contributes to rising investment costs, this suggests that the ultimate economic impact of the RRF will likely fall short of original expectations.
Hubert Pliszka
Coal is part of the Asian response to the gas crisis
81% the rise in the prices of liquefied natural gas (LNG) on Asian markets since the outbreak of the war in the Persian Gulf (Coal prices have risen by around 24%)
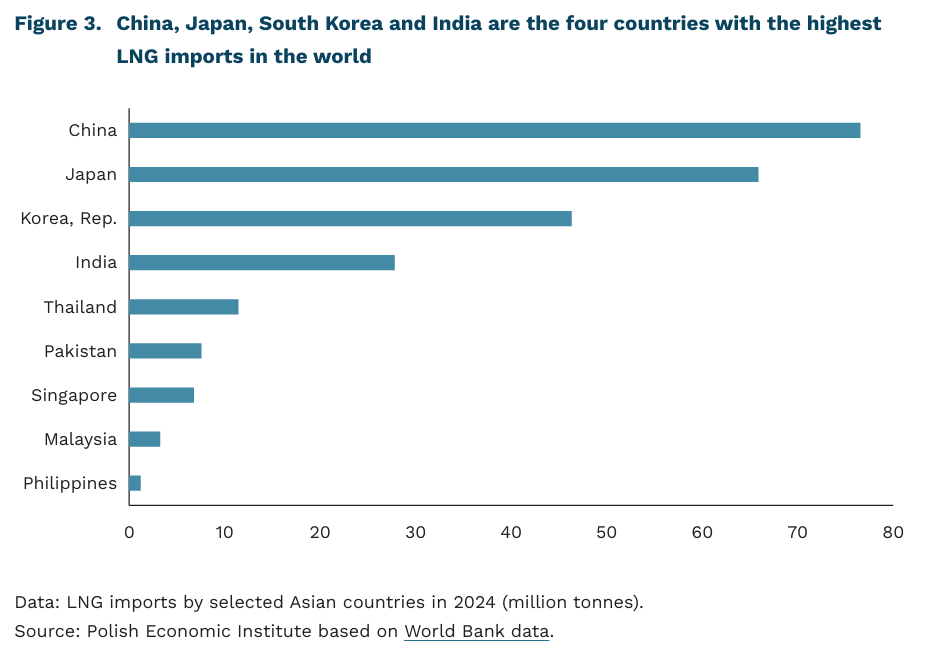
76.6 million tonnes LNG imports to China in 2024, more than those of the entire European Union
100-150% more CO₂ per unit of electricity is emitted by Gas-fired power stations (CCGTs) when compared to the modern coal-fired power stations, although that doesn’t include emissions from the supply chain
Since the outbreak of the war in the Persian Gulf until 13 April, LNG prices on Asian markets have risen by 81% (JKM benchmark). In the second half of March, price increases reached as high as 108%. Although the major Asian economies (Japan, China, South Korea) are among the main recipients of natural gas from the Persian Gulf region, some of the shortfall in supplies has been offset by redirected gas tankers originally bound for Europe, meaning that gas prices in Asia are only slightly higher than in Europe (TTF).
During this period, thermal coal prices rose by just 24% (Newcastle coal). This reflects coal’s partial potential to replace natural gas (and, to a much lesser extent, crude oil) in certain sectors. Countries such as South Korea, Thailand, the Philippines, and India have announced initiatives to increase coal use in electricity generation amid the hydrocarbon supply crisis.
There are fundamental technical constraints standing in the way of a short-term switch from LNG to coal. Coal-fired power stations are relatively expensive to maintain – countries do not have large reserves of spare coal-fired capacity that could be brought online quickly in a crisis. The plans announced by Asian countries, therefore, involve measures such as postponing the closure of old coal-fired units, suspending limits on their use (in Japan or South Korea), or delaying planned maintenance. In countries such as China, India, Indonesia and Vietnam, coal already played a key role in the power sector before the crisis, so the potential for further growth is limited. These barriers have limited the extent of the rise in coal prices, even though a rapid increase in coal production in response to increased demand is also not possible.
However, another gas crisis could lead to coal retaining an important role in the energy mix of some Asian countries for some time to come. This applies in particular to countries that meet most or all of their coal demand through domestic production, such as China, India and Indonesia. Although modern gas-fired power stations offer significantly lower emissions (2-2.5 times lower for CO₂, and even lower for particulates and other harmful substances) as well as greater efficiency and flexibility (and thus better compatibility with the region’s rapidly developing renewable energy sector), further erosion of confidence in the global LNG market is boosting the appeal of domestic, cheaper fuel. Large-scale investments in coal-fired power generation outside China and India remain unlikely, but the crisis may affect the pace at which old coal-fired capacity is used less and eventually phased out of the energy mix.
In China, coal is regarded as an alternative to natural gas not only in energy generation, but also as a raw material for industry. This applies not only to coking coal, used in steel production, but also to large-scale chemical synthesis – in the production chains for fertilisers and plastics, which in other countries rely on natural gas and oil. According to estimates from The Oxford Institute for Energy Studies, in 2020, around 7% of the coal in the Chinese economy was used to produce ammonia, carbide, methanol, and other chemical compounds, including synthetic fuels. Coal-based solutions are often energy-intensive and particularly harmful to the environment: the synthesis of ammonia using coal is associated with 2.2 times higher carbon dioxide emissions than a natural gas-based process. The economic advantage of individual solutions depends on global fuel prices and local conditions. In recent years, coal consumption in China’s chemical sector has continued to rise, and the government’s strategy envisaged a move away from new investments in production capacity only by 2034.
Rising gas and LPG prices are leading to increased use of coal and wood for cooking, particularly in countries such as India and Thailand (as well as in African nations). This results in exposure to harmful air pollution, particularly among women and children.
Michał Smoleń
China’s role in Poland’s global scientific collaboration network is growing
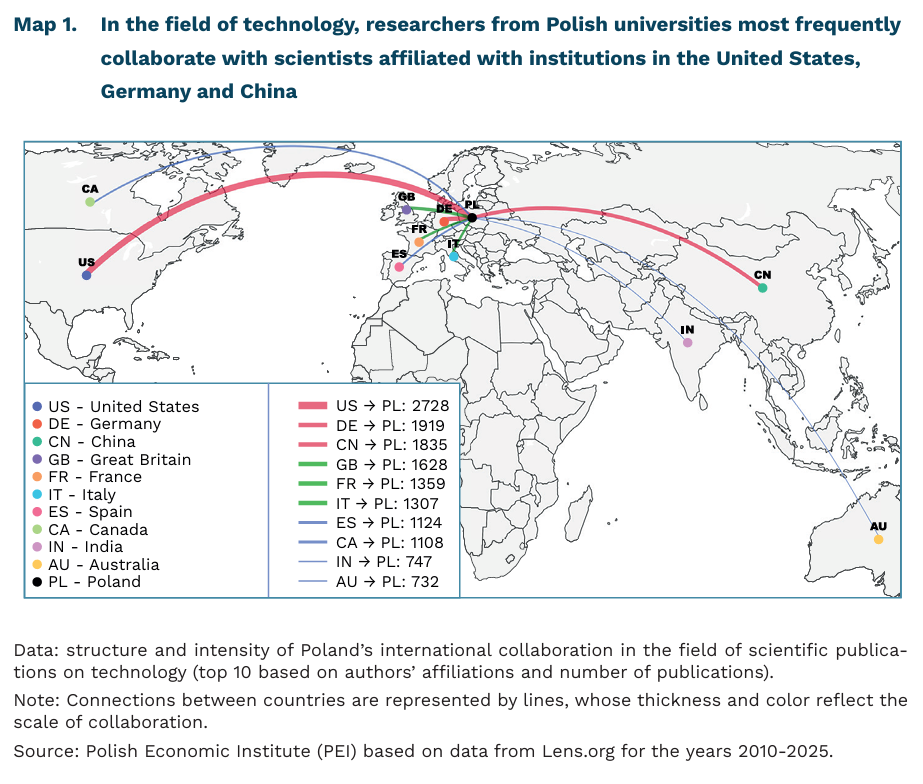
32% the percentage of publications by authors affiliated with institutions in Poland that were produced in collaboration with foreign institutions
23% the average annual increase in the number of joint publications by institutions in Poland and China
The publication output of research institutions in Poland in the field of technology between 2010 and 2025 is concentrated among the largest research centers and technical universities[1]. The Polish Academy of Sciences ranks first (7577 publications). Next in line are: Jagiellonian University (5086), Warsaw University of Technology (4066) and Wrocław University of Technology (3668).
The thematic structure indicates a dominance of computer science and engineering disciplines. In recent years, the thematic structure of publications in the field of technology has been shifting: from dynamic “thematic booms” related to artificial intelligence (AI) and biotechnology toward stable growth in application-oriented areas. The strongest growth was in the application of computer science (by 16% between 2023 and 2025) in fields such as industry.
Of the nearly 50 000 publications, approximately 32% (15 715) are joint publications with a foreign institution. Over the past fifteen years, the percentage of such joint publications has risen from 24% in 2010 to 43% in 2025. For most of the period analyzed, the United States was the main partner in scientific cooperation for Polish institutions, with peak activity in 2020 and 2021. China is gaining in importance, showing the highest growth rate (an average annual increase of 23% between 2010 and 2025). This has allowed Chinese research centers to move into third place in terms of research collaboration intensity, surpassing European countries with the exception of Germany. In the case of Germany, the United Kingdom and Spain, a moderate but stable upward trend is evident. Centers in Canada and Australia are also frequent partners in research collaboration.
In recent years, there have been shifts in the subject matter of publications by researchers affiliated with Polish institutions, moving away from the dominance of traditional fields of computer science and engineering toward more applied and interdisciplinary research. Concurrently, an evolution in the structure of international collaboration is evident. Poland maintains strong and stable scientific ties with its traditional partners in Europe and the United States, which remain key centers of cooperation in the field of technological research. At the same time, a geographical shift toward Asia, particularly China, is becoming increasingly evident, in recent years. China has shown the most dynamic growth in the number of joint publications. This indicates a diversification of the directions of internationalization in Polish science and a gradual expansion of the cooperation network.
- The analysis of data from Lens.org covered 49 819 scientific publications affiliated with Polish universities from 2010 to 2025. The subject scope was narrowed to technology-related fields and the subject classification was derived from the ISSN descriptions included in Crossref metadata.
Magdalena Lesiak
Despite declines in the gaming industry, cultural and creative industries are expanding
the number of enterprises in the cultural and creative industries increased by 15.8% year-on-year in 2024
employment in the cultural and creative industries rose by 18.7% year-on-year at the end of 2024
revenues in the video game segment declined by 8% year-on-year in both 2023 and 2024
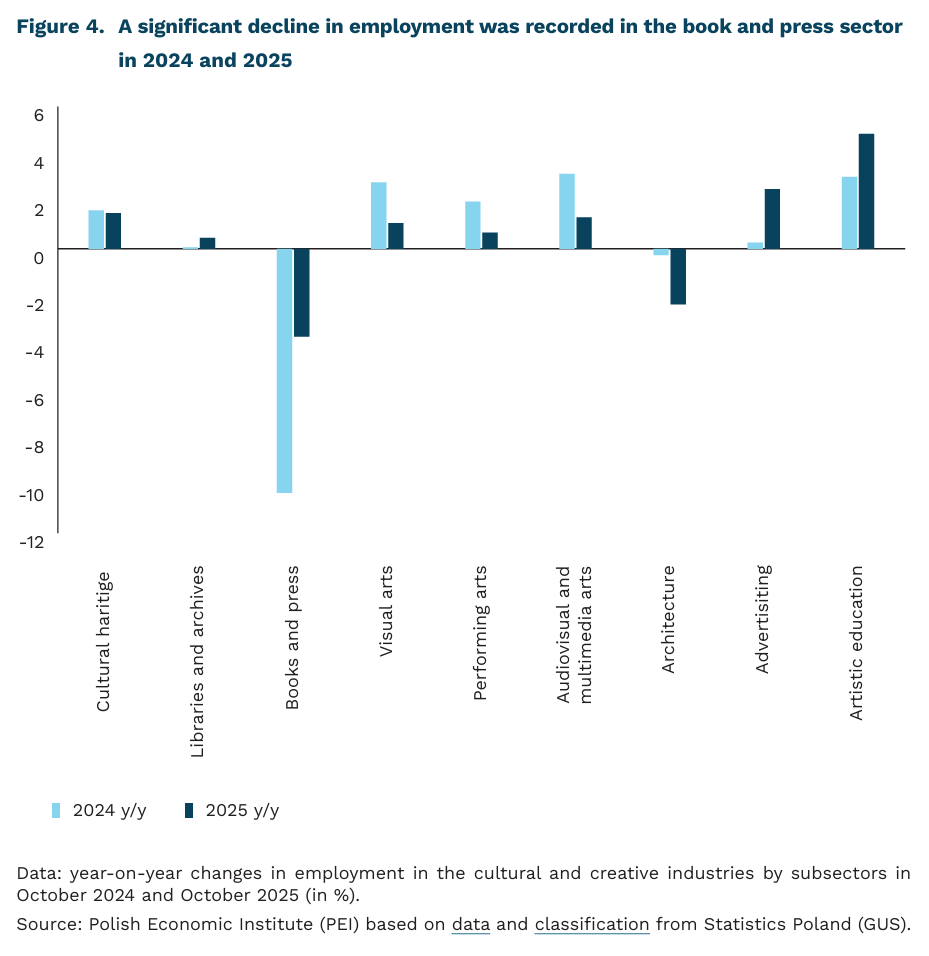
employment in the book and press sector fell by an average of 7% year-on-year in 2024-2025
In 2024, the number of enterprises operating in the cultural and creative industries increased by 15.8% compared to 2023, according to recently published data from Statistics Poland (GUS). The total number of such entities reached 143.7 thousand, which is 19.6 thousand more than in 2023. This increase marks a reversal of the downward trend observed in both 2022 and 2023. In 2024[2], the sector employed 281 thousand people, representing an 18.7% increase compared to 2023.
Cultural and creative industries represent a part of the economy where creativity and intellectual capital are the main sources of value creation. They comprise three main segments: creative industries[3], the digital sector, and the cultural sector. In 2024, the largest shares of employment were recorded in visual arts (27% of all entities) and advertising (24.4%), which together accounted for over half (51.4%) of total employment in the sector.
A key trend observed since 2023 is the decline in revenues in the video game segment. This segment experienced strong growth in 2018 and 2020, with revenues increasing by 14% and 118% year-on-year, respectively (10% and 72% excluding CD Projekt SA4, the largest game producer in Poland). Between 2020 and 2022, the segment stabilized overall, due to a simultaneous decline in CD Projekt SA’s revenues and growth in the rest of the segment. In 2022-2024, segment revenues decreased by an average of 8% annually, driven by factors such as reduced demand following Russia’s invasion of Ukraine and the lack of major game releases on the Polish market.
In October 2024, year-on-year employment increased by 2% to 3.2% in the following fields: performing arts, visual arts, audiovisual arts, and arts education. One year later, the highest year-on-year growth was recorded in advertising (2.5%) and arts education (4.8%). A significant year-on-year decline in employment was observed in the book and press sector, with a drop of 10.3% in 2024 and a further 3.7% in 2025. The negative trend was particularly pronounced in the subsectors of retail sale of books, newspaper publishing, and translation services.
2. As of 31.12.2024.
3 Creative industries include publishing, film production, distribution and exhibition, radio and television broadcasting, music and sound recording, news agencies, as well as activities in architecture, design, photography, translation, and the performing arts, along with broader artistic and cultural activities and the operation of cultural venues (PEI, 2023).
The most optimistic sentiment prevails among entrepreneurs in Mazovia
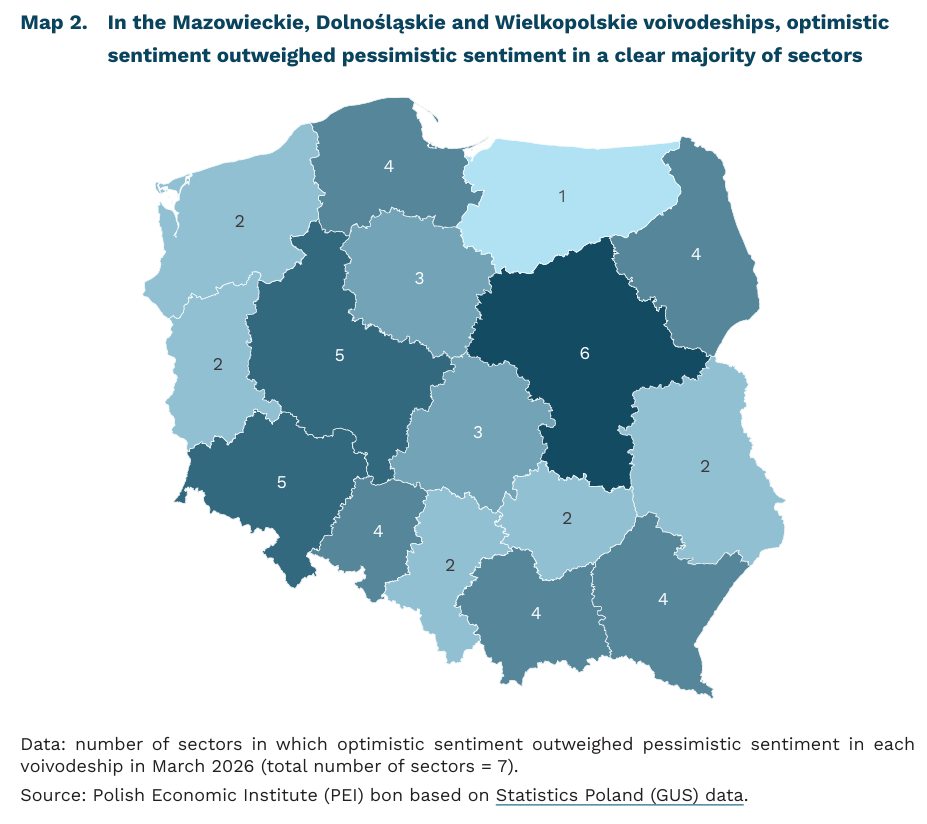
6 out of 7 sectors in the Mazowieckie Voivodeship report a predominance of optimistic assessments of companies’ situation
Only 1 sector in the WarmińskoMazurskie Voivodeship is characterised by a predominance of optimists over pessimists among entrepreneurs
66% of companies in the Monthly Business Climate Index (MIK) survey indicate economic uncertainty as a significant barrier to doing business
In March 2026, sentiment among entrepreneurs improved in most voivodeships compared with the previous month, according to Statistics Poland (GUS) data. Positive sentiment prevailed primarily in accommodation and catering (in 12 out of 16 voivodeships) and in information and communication (in 11 voivodeships). More pessimistic sentiment was observed in retail trade (optimists prevailed in only 2 voivodeships) and in transportation and storage (a predominance of optimists in 5 voivodeships).
In the Mazowieckie Voivodeship, positive sentiment prevailed in six out of seven sectors. This was particularly pronounced in accommodation and catering, where the GUS regional business climate indicator reached as much as 22.2 points (on a scale from -100 to 100, with values above zero indicating that positive sentiment outweighs negative sentiment). Optimism was also seen in information and communication (10.4 points) and in manufacturing (7.9 points). The only sector with a slight predominance of negative assessments in Mazowieckie was retail trade (-1.4 points). A predominance of positive over negative opinions in most sectors was also observed in the Dolnośląskie and Wielkopolskie voivodeships (five out of seven sectors), as well as in Małopolskie, Podkarpackie, Pomorskie and Podlaskie (four out of seven sectors).
In the Warmińsko-Mazurskie Voivodeship, only in retail trade did positive assessments of the business climate outweigh negative ones (7.3 points). Particularly unfavourable sentiment was observed in accommodation and catering (-18.1 points) and in wholesale trade (-11.5 points). The predominance of negative sentiment in the Warmińsko- Mazurskie Voivodeship appears to be persistent – both in February 2026 and in March 2025, optimists dominated in only one of the seven sectors. The voivodeships where optimists outweighed pessimists in only two sectors were: Lubelskie, Lubuskie, Śląskie, Świętokrzyskie and Zachodniopomorskie.
In most voivodeships, optimistic expectations about the future prevail. In the Mazowieckie and Pomorskie voivodeships, representatives of all sectors more often expect an improvement than a deterioration in their situation. This is consistent with the results of the Monthly Business Climate Index (MIK) survey, which in the April 2026 reading indicates a predominance of positive over negative sentiment among Polish companies. At the same time, both GUS data and the MIK show that the two main factors affecting business activity are rising labour costs and uncertainty about the economic situation. In April, rising labour costs were indicated in the MIK survey by 61% of companies, while economic uncertainty – linked, among other things, to the war in the Middle East – was indicated by as many as 66% of enterprises.
4. In 2020, the video game Cyberpunk premiered.
Anna Szymańska
Effective communication is a key condition for securing support for public policies
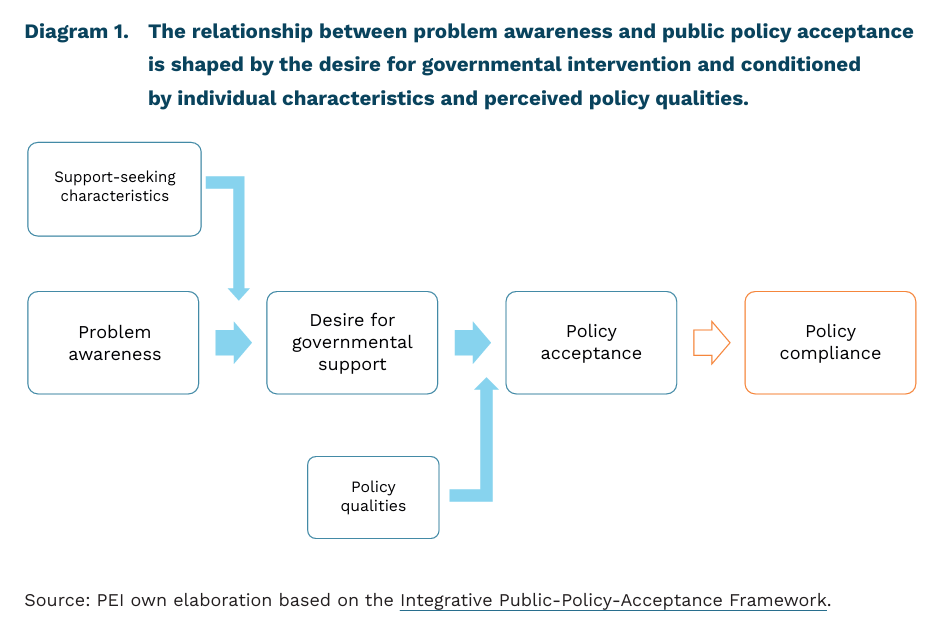
The process of public policy acceptance – and, more broadly, compliance – is a complex and multi-stage process. Researchers have proposed an integrative theoretical framework that organises existing findings into a coherent model. The starting point is problem awareness: the more individuals perceive a given issue as important, the more likely they are to support public action in this area. However, this relationship is not direct. It is mediated by the desire for governmental support – that is, whether individuals believe the state should intervene in a given domain. Individual characteristics also play an important role, shaping the propensity to seek government support. In addition, perceived policy qualities – including effectiveness, intrusiveness, transparency and fairness – are key determinants of policy acceptance.
Effective communication constitutes a key channel through which policymakers can influence the public acceptance of policies. In the United Kingdom, researchers examined how different ways of communicating evidence on policy effectiveness affect public support. Three online experiments were conducted with adult participants. Respondents evaluated various policies (a ban on e-cigarettes, a meat tax, and speed limit reductions) in terms of perceived effectiveness and level of support. They were then presented with different types of evidence (positive or negative; statistical, anecdotal, or mixed) and asked to reassess their views, which allowed for an assessment of how different forms of information influenced their opinions.
The study found that evidence on policy effectiveness alone – whether statistical or anecdotal – did not significantly increase either perceived effectiveness or support. By contrast, negative anecdotes reduced both measures. Statistical information only partially mitigated the effect of negative stories: when presented alongside a negative anecdote, it could weaken its impact, but not eliminate it entirely.
Participants in the UK study did not evaluate policies solely in terms of effectiveness; their concerns and underlying beliefs also played an important role. The study included a qualitative component in which respondents were asked to justify their evaluations. In doing so, they referred primarily to considerations such as fairness, personal freedom, enforcement, and whether others comply with the rules.
The influence of expert authority may also play an important role in shaping policy acceptance. In a PEI study, we showed that the opinions of economic experts can affect citizens’ views on key economic issues (including voluntary social security contributions for the self-employed, the perceived benefits of Poland’s EU membership, the causes of gender pay gap, the need to phase out coal extraction, and the regulation of retirement age). However, this influence was moderated by individuals’ prior beliefs and attitudes, as revealed in their open-ended justifications.
Communication based solely on the provision of evidence may therefore have limited potential not only to change attitudes but also to shape perceptions of policy effectiveness, particularly when it does not take into account broader cognitive and normative factors. This is especially relevant for policies with a strong value-laden dimension. Effective communication of public policies should therefore combine robust evidence with an understanding of the broader context of social beliefs and values.
Iga Rozbicka