Economic Weekly 18/2026, May 8, 2026
Published: 08/05/2026
Table of contents
Rising energy commodity prices are pushing up inflation in Europe
3.0% HICP inflation in the euro area in April 2026, compared with 2.6% in March and 1.7% in January
24% the projected global increase in energy prices in 2026, according to the World Bank’s April forecast. This would be the largest annual rise since Russia’s invasion of Ukraine
The war in the Middle East has triggered a new commodity shock, halting the disinflation process that had been underway in Europe for more than a year. Energy prices are once again pushing up price indices in both the euro area and Poland, limiting central banks’ room for further monetary easing.
Inflation in the euro area has accelerated again, moving the economy further away from the ECB’s target. According to Eurostat, HICP inflation rose to 3.0% y/y in April, from 2.6% in March, 1.9% in February and 1.7% in January. The increase was driven mainly by energy: the growth rate of this component rose to 10.9% in April, from 5.1% a month earlier. Services inf lation edged down to 3.0%, while core inflation, measured as HICP excluding energy, fell to 2.2%. The new price impulse is therefore concentrated mainly in energy, but it increases the risk of higher costs spreading to other parts of the economy through second-round effects.
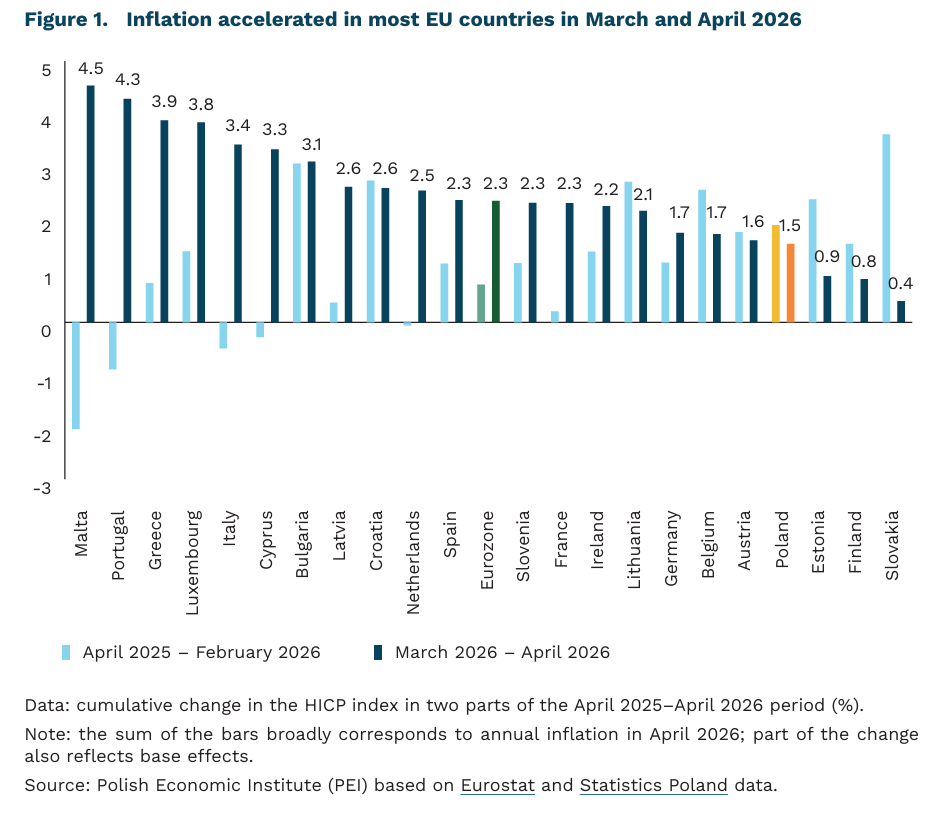
The direct source of the new shock is the war in the Middle East and disruptions in the Strait of Hormuz, through which around 35% of global seaborne oil trade passes. According to the World Bank, attacks on energy infrastructure and disruptions to shipping have triggered the largest supply shock in the oil market on record, with the initial supply loss reaching around 10 million barrels per day. The decomposition of annual HICP inflation shows that March and April accounted for most of the recent increase in prices. In the euro area, prices rose cumulatively by around 0.7% between April 2025 and February 2026, and by around 2.3% in March and April alone. A similar pattern is visible across most European countries, indicating a fresh cost shock rather than a base effect.
Energy and commodity prices remain the main channel of inflation risk in 2026. In its April forecasts, the World Bank expects energy prices to rise by 24% and the overall commodity price index by 16%. Fertiliser prices are also set to increase sharply: the fertiliser index is projected to rise by 31%, while urea prices are expected to climb by 60%. For Europe, this implies two transmission channels: directly, through higher energy bills and transport costs; and indirectly, through the risk of renewed food price growth in the coming quarters due to more expensive fertilisers and feed.
Oil prices may remain elevated even after the most severe disruptions subside. In the World Bank’s baseline scenario, the largest disruptions are expected to fade in May, while traffic through the Strait of Hormuz is projected to return to pre-war levels only toward the end of 2026. Even so, the average Brent price is expected to reach USD 86 per barrel in 2026, compared with USD 69 in 2025. In an escalation scenario, involving longer-lasting supply disruptions and more severe damage to oil infrastructure, Brent could average as much as USD 115 per barrel.
The energy shock will also push up inflation in Poland, leaving no room for interest rate cuts. According to Statistics Poland’s flash estimate, CPI inflation rose to 3.2% y/y in April, from 3.0% in March, despite the fuel price cap programme. Fuel prices were 8.4% higher than a year earlier, while energy carrier prices increased by 4.7%. Core inflation is preliminarily estimated to have accelerated to around 2.9%, from 2.7% in March, which points to the first signs of the shock spreading beyond energy prices. Under these conditions, analysts’ consensus assumes that the Monetary Policy Council will keep interest rates unchanged at least until the end of 2026. The ECB is going further, even signalling the possibility of rate hikes: after the 30 April meeting, President Lagarde described the June meeting as the “appropriate moment” for reassessment, while markets are currently pricing in hikes in both June and July.
Sebastian Sajnóg
China seeks to strengthen its economic position in Mercosur
26% of Mercosur’s total exports in 2024 went to China
82% of Mercosur’s trade with China in 2025 was accounted for by Brazil-China trade
USD 77.5 billion was the cumulative value of Chinese FDI in Brazil in 2007-2024
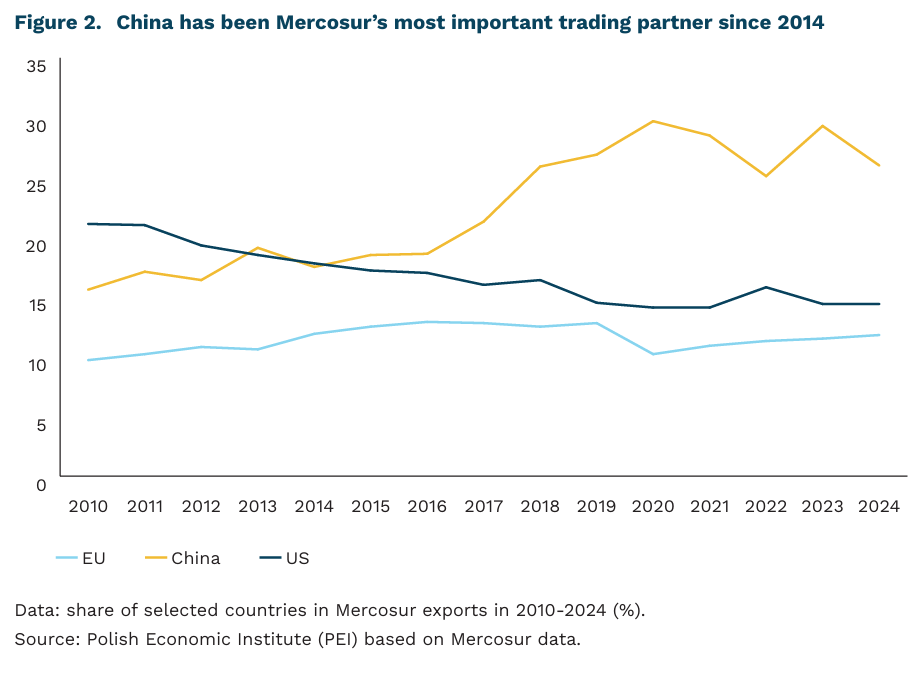
China has been the main trading partner of Mercosur [1] since 2014. In 2024, exports to China accounted for 26% of the Southern Common Market’s total shipments, while imports from China represented 27% of total imports. Trade is heavily concentrated in Brazil, the bloc’s largest economy – in 2025, Brazil-China trade accounted for 82% of Mercosur’s total trade with China. Other Mercosur countries remain more focused on intra-bloc economic relations, although Chinese goods still account for a significant share of their imports (24% on average in 2024). Trade relations remain asymmetric – Mercosur exports mainly raw materials and agricultural products to China, while its imports from China are concentrated in machinery, vehicles and electronics.
Chinese investment is also concentrated in Brazil. Moreover, in 2024, the country was the third-largest recipient of Chinese FDI in the world, after the United Kingdom and Hungary. In 2024, Brazil recorded 39 projects with a total value of USD 4.2 billion, which accounted for around 3% of total Chinese FDI worldwide. In 2007-2024, Chinese companies launched 303 projects in Brazil with a combined value of USD 77.5 billion. The largest inflows of capital went to the electricity and oil sectors, which accounted for 45% and 29% of the value of Chinese investment, respectively. Greenfield investments represented more than half of all projects, at 56%. Despite its intensive economic ties with China, including through BRICS, Brazil has so far refrained from joining the Belt and Road Initiative, seeking to preserve greater strategic autonomy. Among Mercosur members, Uruguay joined the initiative in 2018 and Argentina in 2022.
For China, the entry into force of the EU-Mercosur agreement means increased competition for influence in the region. China is developing relations with Mercosur countries as part of its broader strategy towards Latin America, implemented mainly through the China-CELAC format since 2014. The main risk associated with these relations is the consolidation of a “raw materials and food for technology” model, alongside growing dependence among Latin American countries on China’s market, capital and companies. Another challenge is the absence of a common Mercosur strategy towards China. Instead, cooperation is pursued primarily through bilateral agreements. For example, in 2024, Brazil signed 37 sectoral agreements with China, covering areas such as infrastructure, energy and agriculture. This approach weakens the bloc’s negotiating position and deepens the asymmetry of economic relations.
From the EU’s perspective, China’s growing influence in Mercosur weakens Europe’s trade and regulatory position, making access to strategic raw materials, export markets and political partnerships more difficult. On the other hand, in the long term, the EU-Mercosur agreement gives the countries of the Southern Common Market an opportunity to deepen integration within the bloc. China may respond by intensifying its engagement with Mercosur through increased investment, new sectoral agreements, or even the conclusion of the China-Mercosur free trade agreement, under negotiation since 2021. The strongest promoter of this agreement is Paraguay, but the process may be constrained by Uruguay’s strong economic ties with Taiwan.
- The Southern Common Market, or Mercosur, is composed of Brazil, Argentina, Paraguay, Uruguay, and Bolivia. Bolivia joined the bloc in 2024 and is currently adapting to its rules and regulations.
Katarzyna Sierocińska
Robotization at home boosts foreign direct investments
up to 0.8% could rise the value of outward FDI following a 1% increase in automation in the capital-origin country
approximately 70% of the impact of automation on FDI stems from the increase in the number of investment projects
Robotization in an investor’s home country significantly increases the scale of outward foreign direct investment (FDI) – this is the main finding of a World Bank (WB) working paper. The results of a study covering data from 65 countries between 2003 and 2021 show that a 1% increase in robot adoption in a sector in the source country is associated with an increase in outward FDI from that sector of up to 0.8%. The effect of robotization in FDI destination countries on specific dimensions of FDI is more complex.
The most significant channel driving FDI growth is the increased number of investment projects. The authors break down the impact of automation into three components: capital per job created, the number of jobs created per project, and the number of investment projects. Approximately 70% of the total effect stems from the increase in the number of projects, and about 22-23% from the higher capital intensity of investments. However, no significant impact of robotization in the investor’s home country on the number of jobs created in a single foreign project was found. This means that automation in the home country does not necessarily reduce employment in projects carried out abroad. In this context, robots do not replace work in foreign plants but rather complement it. The study’s findings are also significant because they indicate that the productivity effect predominates, i.e., automation supports FDI through increased productivity rather than limiting it through reshoring, in which robotization would replace production previously located abroad.
A 1% increase in robotization in a specific industry in the host country can increase manufacturing FDI by 0.1%. At the same time, it can lead to a decrease in FDI in efficiency-seeking services (such as IT support or technical support). This is because robots help produce more or at lower costs, and companies become less dependent on manual labor. Automated processes are more digital, standardized, and integrated, with the result that some support functions can be handled by IT systems controlled by the company’s headquarters. Consequently, robotization may encourage the reallocation of FDI from simpler production-supporting services toward more productive industrial investments.
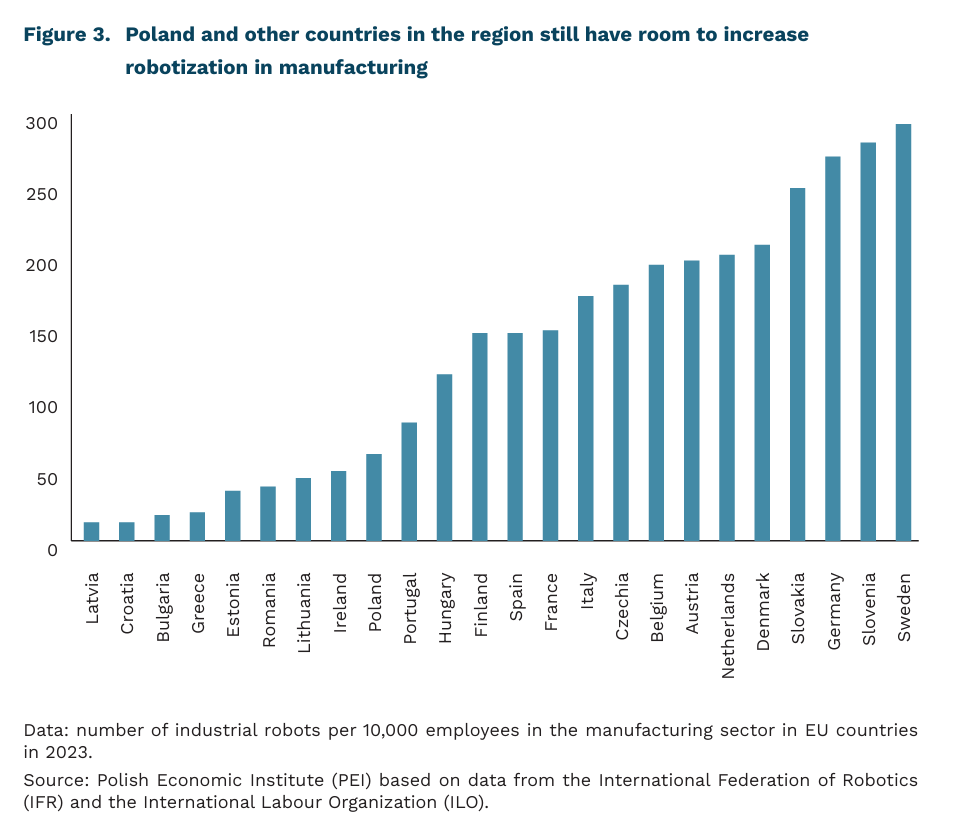
Robotization in countries that are sources of FDI will support an increase in the scale of investments undertaken by firms abroad. Countries whose firms invest in Poland have a relatively high level of robotization, which may mean that the process of robotization will not be as intense going forward. The low level of automation in Poland points to the opposite trend, which may mean that the destination country effect will prevail, and this could reinforce the structural transformation of FDI – increasing manufacturing investments and limiting investments in production support services. Thus, we may be facing, on the one hand, an increase in production diversification within FDI, and on the other, if control over production processes and digital competencies remain primarily with corporate headquarters or specialized hubs, a potential slowdown in growth/contraction of the SSC/BPO sector and an increase in technological dependence.
Filip Leśniewicz
Poles work on weekends less often than the rest of Europe
21% is the average share of people working on weekends in the EU
8% is the average share of people working on weekends in Poland
in the EU, 48% and in Poland, 16% are the shares of service and sales workers who work on weekends
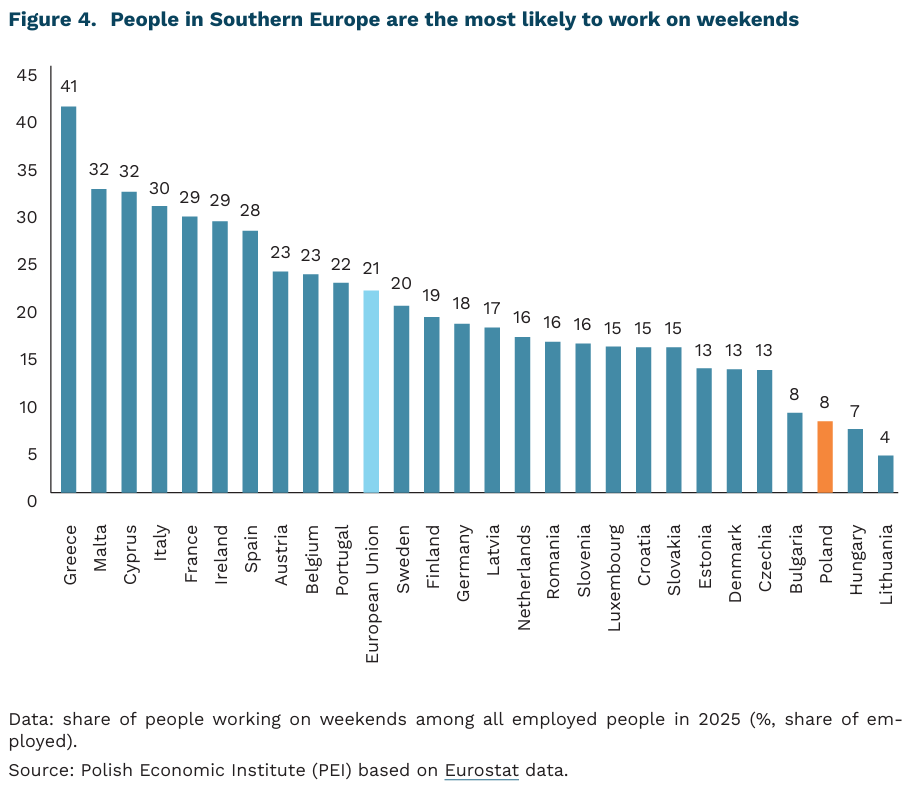
In Poland, only 8% of people work on weekends, which is the third-lowest figure in the European Union (after Lithuania and Hungary). On average across the EU, just over onef ifth of all employed people report working on weekends. This is by far most common in Greece (41%), Malta (32%), Cyprus (32%) and Italy (31%). In most countries, men are more likely than women to work at weekends, although gender differences are usually small and amount to less than 2 percentage points. In Poland, too, men work on weekends slightly more often (8% of men vs. 7% of women).
Working on weekends is more common among the self-employed than among employees. On average in the EU, the share of people working on weekends is 19% among employees, 36% among the self-employed without employees, and as much as 46% among self-employed persons with employees. In Poland – unlike in most EU countries – the highest share of weekend workers is found among the self-employed without employees (23% vs. 15% among those who employ staff). In the EU, weekend work is most common among service and sales workers (48%) and skilled agricultural, forestry and fishery workers (47%), and least common among clerical support workers (10%). In Poland, the occupational group that also stands out from the others is skilled agricultural workers (46%), while among service and sales workers weekend employment is clearly lower than the EU average (16%).
In most EU countries, the number of people working at weekends has been falling over the years. Since 2015, this share has fallen in the EU by an average of more than 5 percentage points. In Poland, the proportion of such people has fallen by almost half (from 15%). The largest declines compared with 2015 were recorded in the Netherlands and Lithuania (15 percentage points each). The opposite trend was observed in Portugal, where the share of people working on weekends increased by as much as 12 percentage points.
Differences in the share of employees working on weekends across EU countries stem primarily from the structure of their economies. The highest shares of weekend work are found in Southern European countries, where the tourism sector is highly developed and requires services to be provided seven days a week. At the other end of the spectrum are Central and Eastern European countries, where in most cases tourism’s share in the economy is clearly lower and there is also a deeply rooted tradition of “free Sundays”. In Poland, an additional factor contributing to a lower incidence of weekend work – especially among service and retail workers – is the ban on Sunday trading introduced in 2018, which is relatively restrictive compared with regulations in other countries. Unfortunately, in Poland a low share of weekend work goes hand in hand with a high number of hours worked during the week, which may contribute to work overload and disrupt work-life balance of Polish employees.
Anna Szymańska
The local government finance reform benefits shrinking municipalities
7 out of 10 municipalities in Poland have experienced depopulation over the last two decades
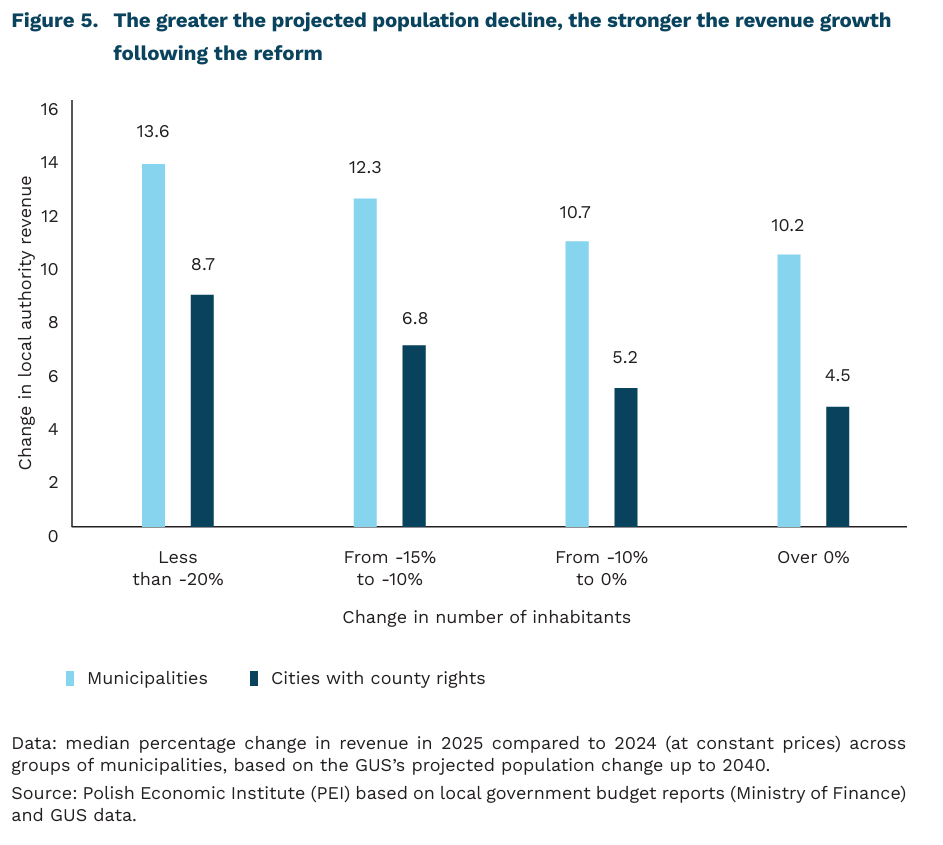
3.5 percentage points is the difference in revenue growth between municipalities with the largest projected population decline and those with projected growth
The local government finance reform introduced in January 2025 was intended to provide municipalities with adequate funds to deliver public services. In previous years, local budgets had been weakened, partly by the tax changes of 2022. Under the previous rules, municipalities received a share of the PIT tax actually paid. The increase in the tax-free allowance and the reduction in the PIT rate from 17% to 12% reduced central and local government revenue. These shortfalls were compensated for with ad hoc transfers, which restricted municipalities’ autonomy and made the allocation of funds more discretionary.
The reform has changed the rules for financing local authorities. Firstly, a new method of calculating PIT revenue shares has been introduced: rather than receiving a share of the tax actually paid, as was previously the case, local authorities now receive a defined percentage of their residents’ income. This makes it more difficult to pass the costs of tax changes introduced by Parliament on to local authorities. The second, more groundbreaking change is the inclusion of various service provision costs within the funding system. This is achieved through a mechanism based on a calculated population figure, which aims to provide a more accurate reflection of the expenditure needs of local authorities. This is because service costs are higher per capita, for example, in a mountainous or depopulating municipality than in a large, densely populated urban centre. Until now, the system has treated municipalities with similar populations essentially the same.
After a year of the new regulations being in force, researchers from NIST estimated that the highest increase in revenue occurred in the smallest municipalities. A similar pattern can be seen in cities with county rights – the greatest benefits from the reform were recorded by local authorities with fewer than 100,000 inhabitants. The new system also favoured the less wealthy: in 2025, revenue growth was higher among lower-income local authorities, both among municipalities and cities with county rights.
The PEI analysis also indicates that the largest increases in revenue were recorded by municipalities which, according to forecasts by the Central Statistical Office (GUS), will experience the most significant depopulation. The median revenue growth in municipalities with the largest projected population decline was 3.5 percentage points higher than in municipalities where the population is expected to grow. This trend is evident in both municipalities and cities with county rights, although the revenue growth figures themselves are significantly lower in the latter group.
This is a key finding in the context of ongoing demographic changes. Over the last two decades, 91% of cities with county rights and nearly 70% of other municipalities have experienced depopulation, and GUS forecasts indicate that this trend will continue to intensify until 2040.
This means that the reform – regardless of its original intention – may partially mitigate the financial effects of depopulation. This is important because this phenomenon has become a permanent feature of the local government landscape. Municipalities losing residents face both a weaker revenue base and higher costs of providing public services. Under such conditions, even small differences in revenue growth matter. A broader analysis of the financial consequences of depopulation will be presented in a PEI report planned for the second half of this year.
Agata Mróz
Intermodal freight transport is becoming increasingly popular, but wider adoption still lies ahead
2.9m TEU were transported through intermodal transport in Poland in 2025
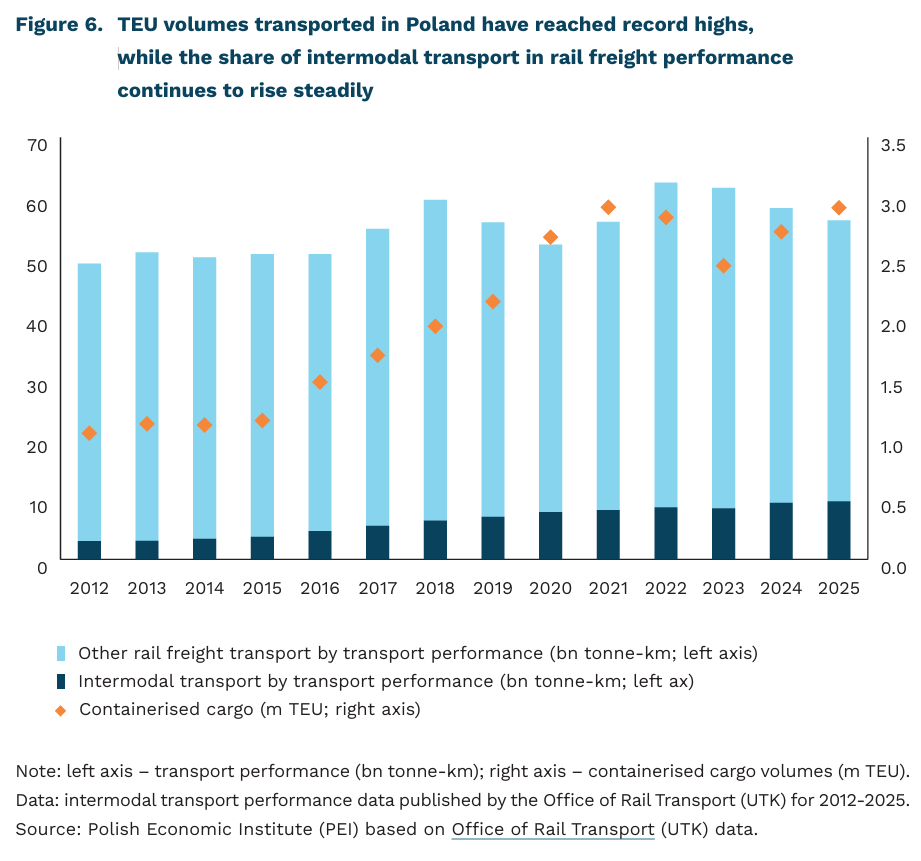
17.1% of rail freight transport performance in Poland in 2025 was accounted for by intermodal transport
The share of intermodal transport – the carriage of goods such as containers combining rail with other modes of transport, most often road or maritime – remains relatively low in Poland, although it has shown an upward trend over the years (Office of Rail Transport; UTK). In 2025, intermodal transport accounted for 17.1% of rail freight transport performance (measured in tonne-km) and 13% of the total mass of goods carried by rail (measured in tonnes). The relatively low share of intermodal transport in Poland compared with other EU countries reflects the structure of the rail freight market, where around 70% of cargo consists of bulk commodities. For this reason, a better measure of the segment’s development is the volume of container transport measured in TEU (units equivalent to a 20-foot container). In 2025, 2.9m TEU were transported through intermodal transport, 2.5 times more than in 2015.
According to Statistics Poland (GUS), 40 intermodal terminals were in operation in Poland in 2024 (four maritime and 36 inland) – handling 82.6m tonnes of containerised cargo [2]. The intermodal transport segment in Poland remains moderately fragmented: in 2025, 39 operators were active in the market, while each of the two largest accounted for around 20% of both transported volumes and transport performance.
Poland is the EU’s second-largest rail freight market. In 2024, rail freight transport performance amounted to around 57bn tonne-km, compared with 126bn tonne-km in Germany and 32bn tonne-km in France. Despite Poland’s strong position in the EU rail freight sector, the share of rail in the domestic transport market remains limited, especially relative to road transport. Intermodal transport is most efficient at large scale and over longer distances, provided that transit times are competitive and reliability remains high. Its development is nevertheless constrained by operational shortcomings in the rail sector, particularly poor punctuality and inadequacies in rail infrastructure, including station tracks with insufficient usable length, which hampers the operation of longer trains, especially on routes serving seaports.
Further growth in rail freight transport – including both the construction of new terminals and the modernisation of key transport hubs, particularly in seaports as well as in Sławków in the Śląskie voivodship and Małaszewicze in the Lubelskie voivodship – will depend on infrastructure expansion, which should ultimately increase network capacity. Rising fossil fuel prices generally favour rail transport, although this advantage is constrained by rail infrastructure access charges and electricity costs. At the same time, the sector is set to benefit from EU policies, particularly those supporting the development of trans-European transport networks. One of the EU’s objectives in this area is to double rail freight transport by 2050, strengthening the long-term case for the development of intermodal transport.
2. These figures should, however, be interpreted with caution, as Statistics Poland uses a different methodology that does not fully capture the scale and specific characteristics of the rail intermodal transport segment.
Krzysztof Krawiec
Phone-locking pouches effectively reduce smartphone use in American schools
from 61% to 13% decrease in share of students admitting that they used their phones during class for personal reasons
30% decline in phone activity on school campuses (based on GPS data)
In a recent U.S. study based on data from nearly 5,000 schools across the United States, researchers analyzed the effects of an intervention requiring students to place their phones in special magnetically locked pouches, which they kept with them until leaving school without being able to access their devices.
The introduction of mandatory pouch use led to a significant decline in students’ phone use during school hours. This is evidenced by GPS data showing a 30% decrease in phone activity on school campuses, as well as survey data in which both teachers and students reported much less frequent phone use by students (the share of students using their phones during class for personal reasons fell from 61% to 13%).
In the first year after the changes were introduced, the requirement to store phones in pouches led to a slight increase in disruptive student behavior and in the share of suspended students in the schools studied. However, this effect faded in subsequent years as students adapted to the new rules. A similar pattern – an initial decline followed by a significant improvement – was observed with regard to students’ subjective well-being. However, unlike surveyed parents and teachers, students themselves assessed the new regulations and their potential benefits critically.
The average effects of the intervention on test scores, in turn, were close to zero. A slight positive impact was observed in mathematics results in high schools. Among younger students, the effect on performance proved to be minimally negative. The change in phone-use policy did not significantly affect absenteeism or students’ perceptions of online bullying, nor did it improve their subjective assessment of their classroom attention.
As more restrictions on students’ phone use are introduced in schools around the world (already in place in more than half of the countries worldwide and in around two-thirds of U.S. states), researchers are attempting to determine the impact of various forms of enforcing these bans on students’ well-being, academic performance, and social relationships. The results of studies conducted so far are inconclusive. Some indicate a positive effect of phone bans on students’ educational achievement, especially among lower-performing students; others point to improved PISA test results and a reduction in aggressive behavior, while still others find no positive effects on academic performance.
Due to the short observation period and the diversity of practices implemented in schools, it is still too early to draw clear conclusions from this type of research, particularly regarding the effects of restrictions on students’ behavior and academic performance. The test scores and well-being measures used by researchers do not capture all potential consequences of the introduced regulations. A very important factor highlighted by the authors of the U.S. analysis is the possible ways of compensating for the lack of access to phones (by students themselves, as well as teachers and school administrators), which may influence the effects of the ban.
In the context of the planned reform by the Polish Ministry of Education introducing a ban on students’ use of mobile phones in schools, it is crucial to clarify how this ban is to be enforced. The American approach of placing phones in pouches is worth considering, as it does not restrict students’ ownership rights or relieve them of responsibility for the safety of their devices, while at the same time – according to the cited study – effectively limiting phone use. However, not only an effective ban is important, but also providing young people with opportunities for active use of their time during breaks, as well as teaching in formats that require group collaboration and other solutions that reinforce the expected positive effects of reduced phone access.
Agnieszka Wincewicz-Price