
Economic Weekly 26/2026, July 03, 2026
Published: 03/07/2026
Table of contents
Declaration of Independence has turned 250, while trade “liberation” has lasted over a year
In the third decade of the twentyfirst century, America remains a powerful point of reference for the world economy. Around 2016, when Donald Trump first won the presidential election, a critical reinterpretation of the American Dream has emerged in the literature. Narrative reportages such as Geert Mak’s In America: Travels with John Steinbeck, Jessica Bruder’s Nomadland, J.D. Vance’s Hillbilly Elegy and many others have portrayed poverty, social inequality, deindustrialisation and the emotions that go with them. The American Dream seems to be changing its meaning. It is less about individual lives and perhaps more about economic might of the US. Europeans look with envy at the strength of the American stock market, its ability to attract capital, the digital sector and economic growth, but does not necessarily dream of living in the United States. On the 250th anniversary of American independence, we have decided in the PEI Economic Weekly to address several aspects of this multidimensional landscape.
In his article, Marcin Klucznik examines the challenge of measuring the productivity gap between the EU and the US and the economic debate surrounding it. The main focus is the gap stemming from the digital technology sector. The question is not whether this gap exists, but what its consequences are, for instance for levels of prosperity and competitiveness. A somewhat neglected yet intriguing strand of this debate is the strength of European industry. Sander Tordoir argues that, given the EU’s strong capabilities in manufacturing, it should build its competitiveness strategy on this foundation. In this field, however, the main challenge today comes not from the US, but from China.
Jakub Witczak and Ignacy Święcicki write about technological development in the US and the role of the state in shaping demand for innovation. They highlight the importance of both the state – as an intelligent client – and an efficient private market able to combine innovations in new applications. The productivity and innovativeness of the American economy are driven not only by systemic factors, but also by deeply rooted cultural and social ones. Agnieszka WincewiczPrice stresses that, alongside a highly developed capital system, social acceptance of risk and entrepreneurial spirit play a key role. The latter is also visible in trust surveys. Katarzyna Zybertowicz shows the unwavering reputation enjoyed by small and mediumsized businesses. She also draws attention to an interesting distinction: while mediumsized businesses are held in high regard by Americans, big tech companies are not necessarily trusted.
Big tech, with its feverish investment in AI, is in turn creating a surge in energy demand, as Adam Juszczak notes in his article on the renaissance of nuclear power in the US. Successive administrations foresee a significant role for this technology in the energy mix. Yet while new reactors in the US are still at the planning stage, China leads the world in the number of nuclear power plants recently brought online.
Julian Kocerka and Paula Kukołowicz, meanwhile, look at quality of life in the US, using development measures other than GDP alone. The Human Development Index, for example, draws attention to the issue of low life expectancy in the US, which serves as a starting point for their brief description of the American healthcare system. Jakub Kubiczek directly addresses relative changes in living standards in the US and Poland, which have led to a reversal of migration trends: returns from the US now outnumber emigration from Poland.
Just before the 250th anniversary of the Declaration of Independence, it does not appear that the US has been “liberated” from its trade deficit. Not only this year the Supreme Court has struck down the legal basis on which the tariffs were imposed, but also they have failed to significantly alter trade outcomes. The overall US trade deficit for 2025 did not change compared with 2024. If we look at the period from May 2025 to April 2026, we see that the US reduced its trade deficit by 25% compared with 2024-2025, but by only 5% compared with 2023-2024. The decline in imports from China is considerable, but requires further scrutiny. Rising values of deliveries to the US from Vietnam, Taiwan and Thailand may indicate that the barriers are being circumvented rather than effectively reshaping trade.
Marek Wąsiński
Is the United States pulling ahead of Europe? Revisiting the recent debate on GDP differences
little has changed GDP per hour worked in the EU relative to the US remained broadly stable between 2000 and 2024 when measured in current PPP dollars
up to 25 percentage points GDP growth in Southern European countries lagged behind the US by as much as 25 percentage points between 2000 and 2024 when measured in constant PPP dollars
Europe is currently engaged in an economic debate over the extent of the continent’s decline in competitiveness. The discussion was initiated two years ago by the publication of the Draghi Report. The most recent exchange of views has taken place between Paul Krugman (link1, link2) and Luis Garicano together with Antonin Bergeaud (link3, link4). Despite their differences, both sides broadly agree that EU economic growth has been relatively weak. Both (as well as Draghi earlier) identify the weakness of the technology and IT sectors as the main reason for Europe’s slower growth.
The central disagreement concerns the extent to which slower economic growth in the EU also implies a deterioration in living standards relative to the United States. This leads them to favour different measures of GDP: purchasing power parity (PPP) GDP in current prices (Krugman) versus constant prices (Garicano).
― Krugman argues that most of the gains from US innovation have accrued to consumers rather than to American big-techs. A natural feature of innovation is the gradual decline in prices as technologies mature and competition increases. As a result, the share of technology and IT hardware in total income generation is now similar to, or in some cases even lower than, in the 1990s despite record productivity growth in these industries (e.g. Jones & Tonetti, 2026).
― Garicano focuses on the EU’s declining capacity to generate innovation. In his view, slower growth reflects Europe’s transition from a technological leader to a follower, increasing the risk that the gap will widen further over time. He also argues that the EU’s relatively favourable performance in GDP per capita is partly explained by rising labour input, as Europeans are working more intensively, whereas Americans work roughly the same number of hours – or even fewer – than they did in the 1990s (see Villaverde et al., 2025, Birinci et al., 2026).
Across most indicators, the gap between the EU and the US has widened, with Southern European countries performing particularly poorly. We reassessed these claims using all combinations of standard GDP measures and labour input indicators, while also distinguishing between European subregions.
― The EU performs consistently worse when GDP is measured in constant dollars or constant PPP terms. This is one conclusion on which both Krugman and Garicano agree.
― The EU’s relatively favourable position when measured using current PPP is meaningful, but it also reflects higher labour intensity. The employment-to-population ratio in the EU-16 increased from 44.6% to 49.2%, whereas comparable indicators for the United States suggest a decline in labour input, although US employment rates remain higher in absolute terms.
― Northern European countries consistently outperform Southern Europe, with GDP levels exceeding those of the South by between 6.6 and 16.0 percentage points, depending on the measure used. They are also the only EU countries that record a sustained improvement relative to the US in GDP per hour worked measured in current PPP terms.
The Krugman–Garicano debate has important implications for evaluating the European Commission’s proposals under the Technology Sovereignty package, which aims to reduce the EU’s dependence on foreign technologies while strengthening competitiveness and data security.
― Garicano argues that even relatively small technological disadvantages may translate into substantially larger GDP gaps. Historical episodes of successful economic catch-up have relied on adopting foreign technologies and integrating into global competition rather than on import substitution.
― From Krugman’s perspective, slower growth in the EU has not reduced relative living standards because European consumers continue to benefit from technologies developed in the United States. Policies aimed at technological sovereignty may therefore slow technology adoption and make underlying productivity differences more visible.
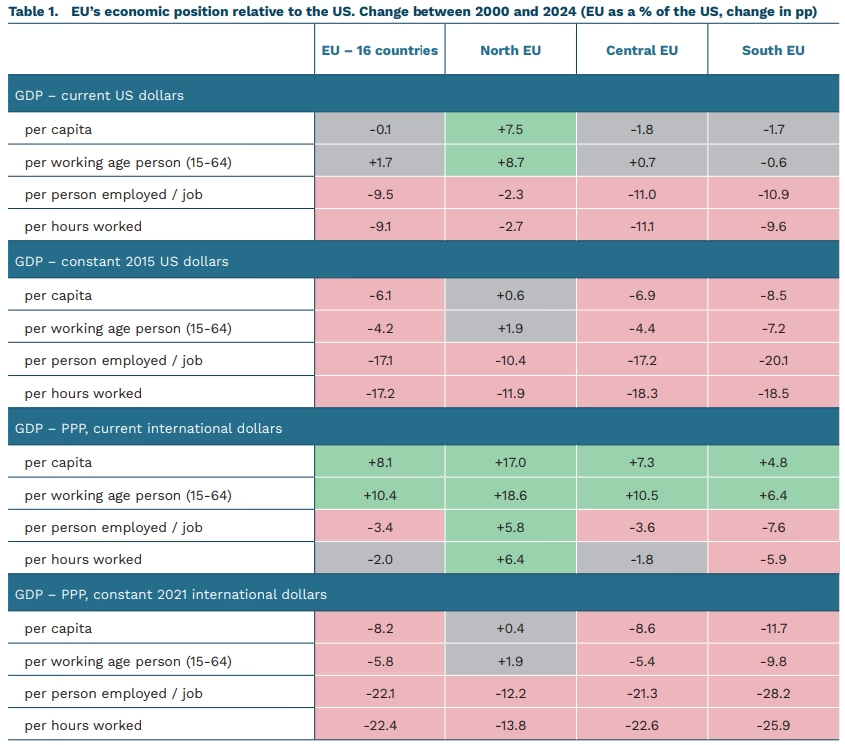
Data: productivity is measured as the ratio of EU countries’ productivity to that of the United States under alternative GDP and labour input measures for 2000 and 2024. The table reports the change, in percentage points, over the 24-year period. Positive values indicate that the EU improved relative to the United States, while negative values indicate a widening productivity gap. Small differences (up to 2 percentage points) are highlighted in grey.
EU-16 refers to the EU-27 excluding the Central and Eastern European member states. These are countries with broadly comparable income levels to the United States, where differences in economic performance primarily reflect the capacity to generate and adopt frontier technologies rather than convergence from lower initial levels of development.
Northern Europe comprises Belgium, Denmark, Ireland, the Netherlands, Finland, and Sweden. Central Europe comprises Germany, France, Luxembourg, and Austria. Southern Europe comprises Greece, Spain, Italy, Cyprus, Malta, and Portugal.
Measures based on employment and hours worked provide a more accurate basis for productivity comparisons than population-based indicators. However, these labour input measures are not fully harmonised across countries because of methodological differences, including the distinction between employed persons and jobs. Eurostat’s national accounts provide comprehensive information on employed persons but not on jobs, whereas the BLS data for the United States are based on jobs rather than individuals. Since our analysis focuses on changes in relative performance over time rather than cross-sectional levels, most of the resulting measurement bias is likely to cancel out. An alternative approach would be to use labour input data from the Penn World Tables.
Source: own elaboration by PEI based on data from the World Bank (all GDP measures), the United Nations (total and working-age population), Eurostat (employment and hours worked in the EU), and the US Bureau of Labor Statistics (employment and hours worked in the United States).
Marcin Klucznik
USA plans to quadruple nuclear power capacity by 2050
from 97 GW to 400 GW according to announcements from the American government, installed nuclear reactor capacity in the USA is set to increase by 2050
between $69 billion and $99 billion in additional annual investment may be required for such an ambitious nuclear capacity expansion plan
45 years is the average age of an American nuclear reactor. That’s 4 years more than French reactors and 33 years more than Chinese reactors
The USA plans to increase nuclear capacity to 400 GW by 2050. In 2025, US President Donald Trump signed an executive order aimed at implementing a series of measures, including quadrupling the capacity of American reactors from the current 97 GW (94 reactors). In 2025, nuclear power accounted for 18% of electricity produced in the USA (784 TWh). Increasing nuclear capacity to 400 GW would translate into a rise in this share to 48% (compared to 12% in a scenario without expansion) by 2050. According to estimates from the consulting firm Keylogic, this will require additional investments ranging from $69 billion to $99 billion annually. 1
The demand for such a drastic increase in nuclear capacity stems partly from rising energy demand from the AI sector and data centers. According to estimates from the U.S. Energy Information Administration (EIA), estimated server demand in the USA in 2050 could range between 446 TWh and 818 TWh, with data centers alone potentially consuming up to 581 TWh annually. This is 10 to 18 times more than demand in 2020 (45 TWh) and 4 to 8 times more than demand in 2025 (105 TWh).2
The first steps to accelerate the construction of new units have already been taken. In June 2026, the US Department of Energy (DOE) granted conditional loan guarantees worth $17.5 billion to Westinghouse and a group of American energy companies for the purchase of long-lead-time components for 10 AP1000 reactors, which are to be built at five locations. This is expected to accelerate the completion of nuclear projects by 2-3 years.
Challenges facing the USA include not only building new capacity but also extending the operation of existing power plants. The average age of a reactor in the USA is nearly 45 years,3 with as many as 89 units reaching 60 years of age or more by 2050. This is several times more than for Chinese reactors (averaging just under 12 years) and somewhat more than for French reactors (41 years).4 The US Nuclear Regulatory Commission is reviewing applications to extend the operating life of nuclear power plants to 80 years under the Subsequent License Renewal program. 25 reactors have already received such approval, with two more applications currently under review.
Quadrupling nuclear capacity also requires expanding the American nuclear fuel supply chain. Currently, the USA holds just under 10% of global uranium enrichment capacity. In 2023, the USA simultaneously imported as much as 27% of its uranium enrichment services from Russia. According to McKinsey calculations, ensuring stable operation of an additional 300 GW of capacity would require the USA to invest an additional $105-170 billion in expanding the nuclear fuel supply chain.
Ambitious plans to expand the nuclear sector are not exclusive to the USA. In 2023, 25 countries around the world signed a declaration to increase global nuclear capacity from the current nearly 400 GW to 1,200 GW. This ambitious goal may be difficult to achieve, especially for Western countries (including the USA and EU member states), due to the low number of nuclear investments in recent years. Of the 73 reactors currently under construction worldwide, 35 are located in China, with only a few in so-called Western countries. Of the 52 reactors whose construction began between 2017 and 2024, 48 were Chinese or Russian projects. Lost competencies combined with very high demand for new nuclear investments could constitute a bottleneck for the Western nuclear renaissance. Hope for the consistent implementation of long-term public policies aimed at rebuilding Western nuclear potential may lie in the bipartisan consensus that has been achieved in many countries – including Poland and the USA – despite the lack of agreement on many other elements of the energy transition. Under President Biden, the DOE’s plans called for increasing nuclear capacity to 300 GW by 2050, which suggests that Trump’s policy in this area is an evolution of his predecessor’s actions.
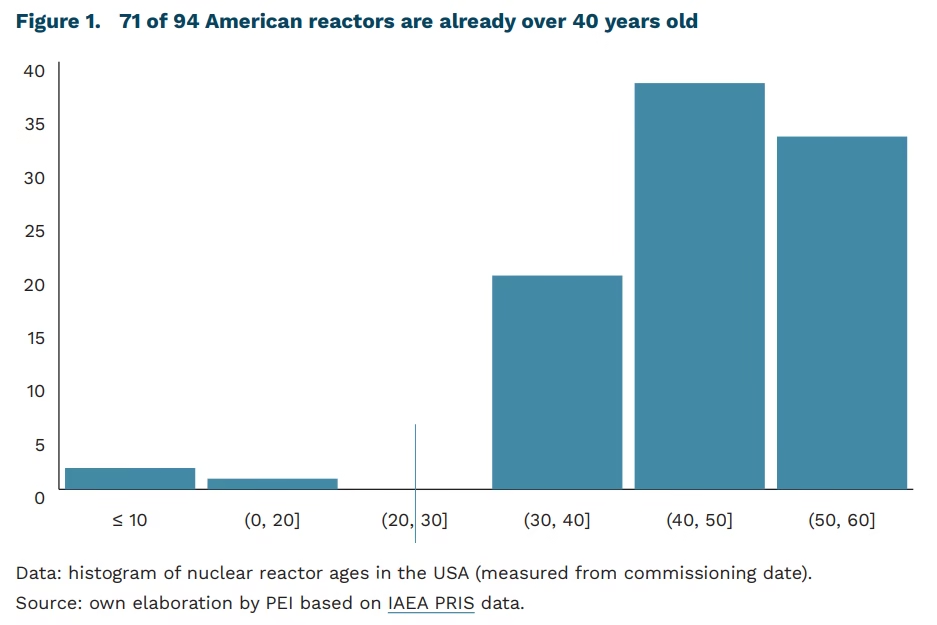
1 In 2024 prices. The lower bound of USD 69 billion assumes cost reductions resulting from a high learning curve for subsequent investments.
2 PEI’s own analysis based on EIA data (Annual Energy Outlook 2026, additional data in the narrative figures file).
3 43.5 years if weighted by the reactor’s dispatchable capacity.
4 Own elaboration by PEI based on IAEA PRIS data.
Adam Juszczak
The US is the world’s largest economy, but a large proportion of its citizens cannot afford medical treatment
17th the US rank in the Human Development Index (HDI) in 2023
35th the US rank in the Human Development Index (HDI) in 2023 in the area of healthcare
26% of US citizens foregone some form of treatment in 2024 due to the high costs of private healthcare services
Although the United States is nominally the world’s largest economy, it does not rank equally highly across all measures of quality of life. In 2023, it ranked 17th on the Human Development Index (HDI), 5 tied with New Zealand and Liechtenstein. This result places the country amongst those with a very high level of social development. The United States’ strong position on the HDI is driven primarily by high scores in the economic and educational dimensions. In 2023, the US achieved an average Gross National Income of 63,700 USD, which would place the country 7th in the ranking, behind Germany, the United Kingdom and Canada, amongst others.
One area in which the United States performs significantly worse than most highly developed countries is healthcare. The HDI measures the quality of healthcare through average life expectancy. At birth, the average American can expect to live for 79.3 years. This is 3.4 years lower than the average for comparable OECD countries (82.7 years). By way of comparison, average life expectancy in Canada is 82.6 years, in Germany 81.4 and in South Korea 84.3. Among developed countries, only the Czech Republic (79.8) and Poland (78.6) score lower than the United States. Set against other developed nations, the United States’ performance in this regard stands in stark contrast to its record-high healthcare expenditure. In 2024, the country allocated 18% of its GDP to healthcare, a level unmatched anywhere else in the world.
Although this country has the world’s highest healthcare expenditure, this does not translate into a high standard of healthcare. The main factor is the lack of a universal, public and uniform health insurance system that guarantees citizens equal access to healthcare. Access to healthcare depends on paying premiums to a chosen insurance company, and the state has no influence over the level of premiums paid or the scope of medical services guaranteed on that basis. As a result, in 2024 as many as 26% of citizens opted out of some form of treatment due to the high costs of services that were not covered by insurance. The fragmentation of the system also means that no single insurer has sufficient bargaining power to negotiate the prices of services and medicines from the position of a dominant buyer – hence the US pays 2 to 2.5 times more for the same procedures than other OECD countries.
The high price levels are also driven by the private nature of the entire healthcare market. Research shows that private, for-profit insurers have a structural incentive to minimise payouts to policyholders and keep premiums high, rather than to reduce the cost of individual healthcare services. As a result of these high prices, some members of the population either forego treatment or delay seeking it, which has a negative impact on life expectancy and, in turn, drives up the cost of healthcare services.
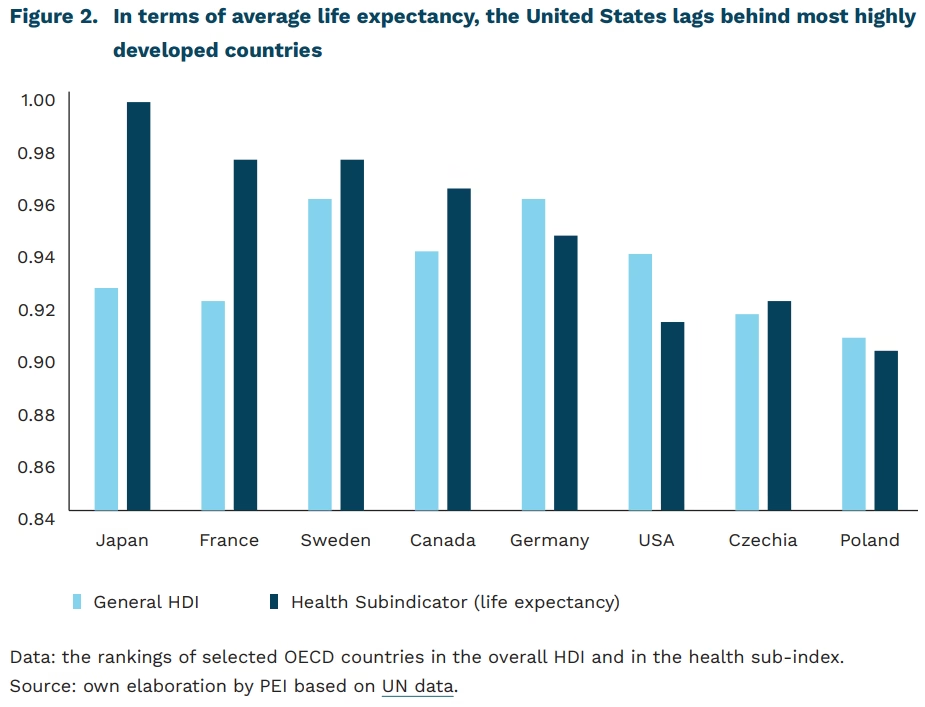
5 The Human Development Index – published by the United Nations – is used to assess three fundamental dimensions of well-being: life expectancy, years of schooling, and the material well-being of countries as measured by Gross National Income. It is an alternative indicator to GDP, which helps to assess living standards.
Julian Kocerka, Paula Kukołowicz
Public funding for digital dominance
70% of university computer science research in the US was federally funded at its peak
1.86% of GDP was spent by the US federal government on R&D funding in 1964
In the field of digital technologies, the United States is primarily associated with large companies and a competitive market. However, the U.S.’s current dominance in this area is backed by a long history of public support for innovation – from the “Apollo” program to today’s research funding agencies – without which it would be difficult to imagine reaching the point where its economy stands today.
The government has supported innovation in various ways – not always by directly funding R&D, but also by acting as the first buyer of new solutions developed by the private sector. This was the case with early integrated circuits, for which the U.S. government was the sole customer in 1962; as the ability to scale up production and reduce costs progressed, the product could then be successfully commercialized under market conditions in subsequent years. It is worth noting that the market was initially skeptical of integrated circuits, and contracts for NASA and the Air Force made it possible to launch the initial mass production.
The government also funded the development of technologies that the market was not yet ready to undertake on its own. The ARPANET network, the direct predecessor of the Internet, was created with funding from DARPA. At its peak – from the mid-1970s to the mid-1990s – as much as 70% of funding for university computer science research in the U.S. came from federal sources. Over time, a newer mechanism also emerged – competitions offering prizes for achieving specific results, through which DARPA attracted innovators from outside the traditional defense sector to tackle problems such as autonomous vehicles and robotics.
In the U.S., it was the market that integrated these technologies into products and brought them to mass scale. As economist Mariana Mazzucato notes, private innovation was, in essence, a synthesis of earlier government investments. A good example is the iPhone, which integrated already available solutions: a touchscreen, GPS, the internet, and a voice assistant – all of which grew out of publicly funded research. However, it was only thanks to Apple that they came together into a single final product that defined what a modern smartphone is.
This same support mechanism continues to operate. After the Cold War, government involvement did indeed weaken, and federal R&D spending fell from over 1.8% of GDP in the 1960s to about 0.63% in 2024. However, technological competition with China is currently driving a new wave of government involvement in innovation. The CHIPS Act of 2022 allocated $52.7 billion to domestic semiconductor production, and the U.S. government continues to play both roles in supporting innovation. As a funder, for example through the Genesis mission launched in 2025, which connects national laboratories’ supercomputers, data, and the private sector to accelerate scientific discoveries using AI. It plays the role of an early adopter on the quantum computing front, where, for example, through the DARPA initiative, the U.S. government validates approaches and creates demand that attracts private capital to a technology still too uncertain for the market on its own. However, it will only become clear at the commercialization stage which elements of the solutions developed with public support will lead to a breakthrough on the scale of the smartphone.
Jakub Witczak, Ignacy Święcicki
Cultural and institutional tolerance for risk as drivers of the American economy
Entrepreneurship is a cornerstone of every economy, and its high levels of innovation and productivity in the United States are among the key drivers of the country’s economic strength. Research and historical experience suggest that tolerance for uncertainty and risk distinguishes entrepreneurs from other occupational groups. Population-based surveys, such as the Global Preference Survey and the World Values Survey, further indicate that Americans score above the OECD average in both willingness to take risks and the individualism that often accompanies it. Recent research suggests that this phenomenon can be explained by a distinctive combination of culturally shaped individual attitudes and an institutional environment that encourages and rewards risk-taking.
High individual-level risk tolerance is not unique to Americans; the Global Preference Survey, for example, also ranks the Nordic countries and Israel among the most risk-tolerant societies. However, an analysis of employment data for second-generation Americans covering the period 1995-2019 reveals a distinctive mechanism through which risk-tolerant attitudes are transmitted across generations. The study finds that the higher the level of risk tolerance in immigrants’ countries of origin, the more likely their U.S.-born children are to become entrepreneurs and establish their own businesses. Interestingly, the same relationship is considerably weaker among first-generation immigrants themselves, suggesting that a willingness to take risks alone is insufficient for entrepreneurial aspirations to be realized.
Economists argue that the institutional environment in the United States plays a crucial role in enabling entrepreneurs to undertake risky ventures. Particularly important are access to capital – supported by a well-developed venture capital market – as well as tax incentives and public support programs that lower barriers to entry. Equally significant is the U.S. regulatory framework, especially its relatively forgiving bankruptcy regime, which allows debts to be discharged and provides viable firms with the opportunity to restructure and resume operations rather than face liquidation.
Another indispensable factor is the social acceptance of failure and a broader culture of trust in business. 6 A study of 500 U.S. firms found a strong positive association between entrepreneurs’ perceptions of societal support for risk-taking and the level of entrepreneurial activity. This support should not be understood as indiscriminate tolerance of failure, but rather as creating an environment that encourages experimentation and treats failure as a learning opportunity rather than a permanent stigma. Together, these cultural and institutional features reshape the perceived costs and benefits of risk-taking. They suggest that Americans are not uniquely attracted to risk itself; rather, they operate in an environment that makes risk-taking more feasible, less punitive, and ultimately more rewarding.
It is also worth noting an intriguing experimental study which, using two models of decision-making under risk, found that novice American entrepreneurs exhibit greater financial risk aversion than non-entrepreneurs. The authors argue that entrepreneurial individuals are willing to assume the risks associated with starting a business not solely for financial gain, but also because they value independence, autonomy, and self-realization.
Understanding the interplay of cultural, economic, and institutional factors is essential for designing evidence-based policies and interventions that foster innovative and resilient entrepreneurship. The United States offers Europe a model in which creativity and proactive initiative are encouraged by accepting the possibility of costly failure. Crucially, however, such a model is sustained by complementary institutions – most notably access to capital – and by a social climate that views entrepreneurial failure as an acceptable consequence of innovation rather than a permanent mark of incompetence.
Agnieszka Wincewicz-Price
Americans trust small businesses the most
68% of Americans trust small businesses (according to Gallup Institute research)
6 million so-called small businesses employ 46% of private-sector workers
43% of US GDP is generated by small businesses
Small businesses rank at the top of Americans’ trust rankings, according to Gallup’s Confidence in Institutions survey. The latest survey shows that as many as 68% of respondents express a high level of trust in small businesses, more than in the military. Small business in America is defined – under the general definition of the U.S. Small Business Administration (SBA) – as independent companies typically employing fewer than 500 workers. This is therefore a very broad category: from micro-enterprises to medium-sized companies (and in some cases even larger firms) that under the European definition would qualify as small or medium-sized. Although America is associated with the power of big business (27% of Americans trust ‘big tech’), small business has remained the leader in the institutional trust rankings uninterruptedly for decades – regardless of political changes and the general decline in trust in other institutions.
There are 33.2 million small businesses operating in America, accounting for as much as 99.9% of all businesses in the US. Only 6 million of them have employees, yet these account for nearly half (46%) of the American private sector workforce. Between 1995 and 2021, they created 17.3 million new jobs. Small businesses account for 43.5% of GDP and are one of the key assets of the American economy.
The high level of trust that American society places in small business is largely cultural rather than purely economic in nature. As analyses by the Pew Research Center indicate, it does not stem primarily from any objective efficiency advantage of small companies, but from their deeply rooted symbolic status. They are perceived as an embodiment of local identity, individual agency, and the American dream of success – in contrast to large corporations, which are associated with an impersonal, centralised system and the subordination of the public interest to the logic of profit maximisation.
A similar pattern is also visible in Europe, although trust in business tends to be studied there as a whole rather than by size. The Edelman Trust Barometer 2024 report shows that business is trusted by 58% of Dutch respondents, 57% of Italians, 53% of French, 52% of Irish, 50% of Germans, and 48% of British. In all these countries, business is rated more favourably than government or the media, but it is difficult to identify a position for small business in social life as distinctive as in the US. Poland, meanwhile, lacks comparable data on trust in business as an institution. However, the latest CBOS research shows that trust in business relationships is growing in importance among Poles: 39% of respondents believe that trusting business partners generally pays off, which is the highest result since measurements began – an increase of 5 percentage points year on year.
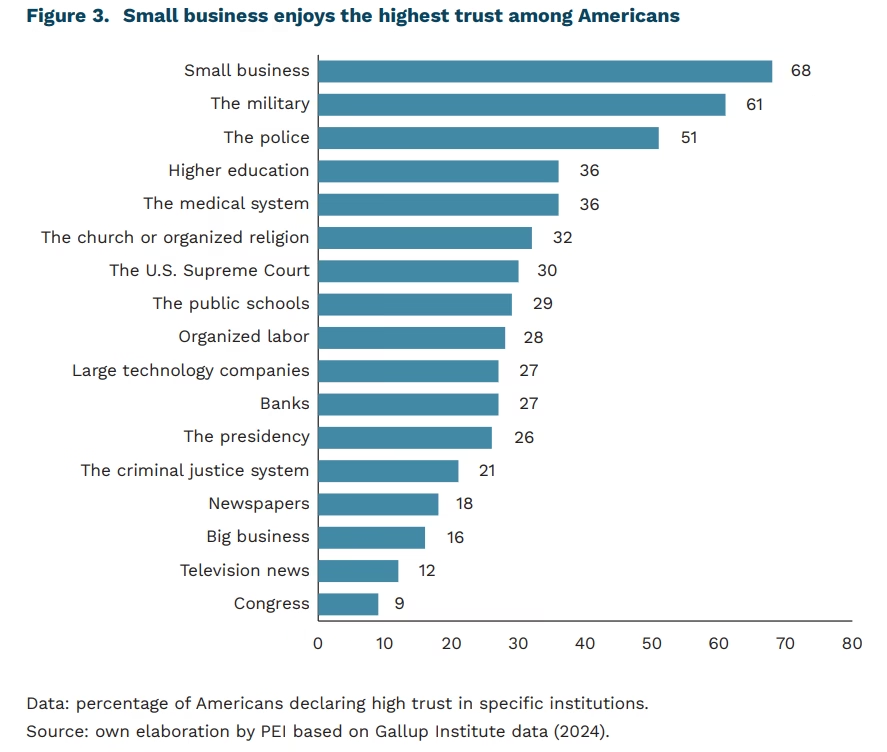
6 See also Katarzyna Zybertowicz’s article, Americans trust small businesses the most, elsewhere in this issue of the Weekly.
Katarzyna Zybertowicz
Poles are returning from the USA more often than they are leaving
in 2016, for the first time, the permanent migration balance with the USA was positive
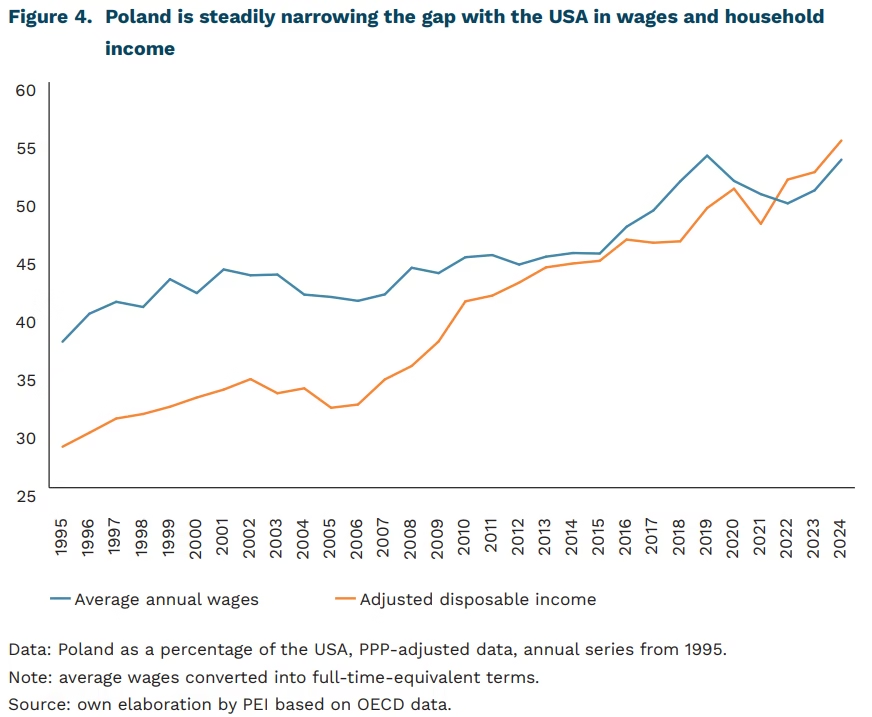
37.6% to 53.3% was the ratio of average wages in Poland to those in the USA in 1995-2024, PPP-adjusted
28.5% to 55.0% was the ratio of adjusted household disposable income in Poland to that in the USA in 1995-2024, PPP-adjusted
The United States has ceased to be a destination for Polish emigration. Today, it is rather a destination for return migration, which is reflected in a positive migration balance. A sharp change occurred during the financial crisis of 2007-2009, when the permanent migration balance with the USA approached zero, and in 2016 it became positive for the first time. Poles who currently decide to emigrate primarily choose European countries; in the case of temporary emigration, these were indicated by as many as 94% of respondents.
During the communist period, the United States was a clear emigration destination for Poles. At the time, it embodied the American Dream: the promise of capitalist prosperity, opportunity, and a better life, far removed from the realities of a centrally planned economy. This promise drove successive waves of emigration. In the peak years of emigration, 1986-1987, the permanent migration balance with the USA reached as low as around -2.9 thousand people per year.
The earnings gap that actually separates the two countries is no longer as large as it was in the 1990s. In 1995, average wages converted into full-time-equivalent terms amounted to around 38% of the US level, while in 2024 the figure had already reached 53.3%. The gap is even more clearly closed when measured using the broader indicator of adjusted household disposable income. In addition to price differences, this measure takes into account taxes, transfers, healthcare, and education, making it a fuller reflection of real living standards than wages alone. According to this measure, Poland’s ratio to the USA increased from 28.5% in 1995 to 55.0% in 2024, and in recent years it has even exceeded the wage ratio.
Poland is one of the clearest examples of this process, and differences that in the 1990s may have seemed like a substantial divide are now significantly smaller. After Poland joined the European Union, convergence accelerated and became visible not only in GDP growth but also in household income levels and living conditions. It can be argued that the improvement in material conditions in Poland reduces Poles’ propensity to emigrate to the United States. It is also worth noting that comparing living standards is not limited solely to wage levels. What also matters is how much households must spend on basic elements of social advancement, including education. In Poland, access to higher education places a much smaller financial burden on households than in the USA, where higher education is often associated with many years of debt. From this perspective, the material distance between Poland and the United States turns out to be smaller than suggested by the entrenched image of America as a land of opportunity and possibility – opportunities that Poland now also offers.
Jakub Kubiczek
