
Economic Weekly 31/2026, August 7, 2026
Published: 07/08/2026
Table of contents
No longer coke, but drones are building Poland’s export advantage
34 is the number of types of Polish export goods for which the RCA (Revealed Comparative Advantage) indicator analysis showed a strong comparative advantage
11% of Poland’s exports in 2022-2025 consisted of goods in which Poland held a strong comparative advantage
Polish exports show strong comparative advantages in 34 types of goods, which in 2022-2025 accounted for over PLN 695 billion, or about 11% of Poland’s total exports in this period. This group includes goods of very different nature – from home appliances and furniture, through agricultural products, to light industry articles – which shows that Poland’s export specialization is not homogeneous. However, the highest values of the indicator are recorded not by the largest categories in terms of volume, but by a narrow group of raw materials and niche goods.
To identify export advantages, we used an analysis of the RCA (Revealed Comparative Advantage) index for the years 2022-2025. In this case, index shows how much more important a given good is in Polish exports compared to the exports of the European Union as a whole [1] – the higher the value, the stronger Poland’s specialization in that good. As the benchmark for strong export specialization, we adopted those products for which the RCA value is above 4.
The highest indicators were achieved by coke and semi-coke from coal (11.69), military weapons (10.95), rye (8.70), and coal tar distillates (8.42). Further positions were occupied by, among others, shavers, cotton, buckwheat, washing machines, candles, and cigars. Among the goods that recorded the largest increase in the RCA coefficient in 2022-2025 were, among others, barbed wire (from 1.06 to 7.23), drones (from 1.39 to 5.88), and chassis (from 2.36 to 4.91).
The number of goods groups with high RCA and their share in Polish exports suggest that Poland’s export specialization is not concentrated in one clear production cluster, but is dispersed across many different industries. Thirty-four types of goods with RCA above 4 do not belong to a single industry, but are spread across nine different ones – from coal-derived raw materials, through the defense industry and drones, to furniture manufacturing, home appliances, and agricultural processing. The indicators reveal that Poland is able to maintain export advantages from various stages of its development and add new ones: from agriculture and industrialization dating back to the 1990s, through large home appliances and consumer electronics, the furniture and defense industries, to products whose production has already been abandoned by other EU countries (including coke and coal tar).
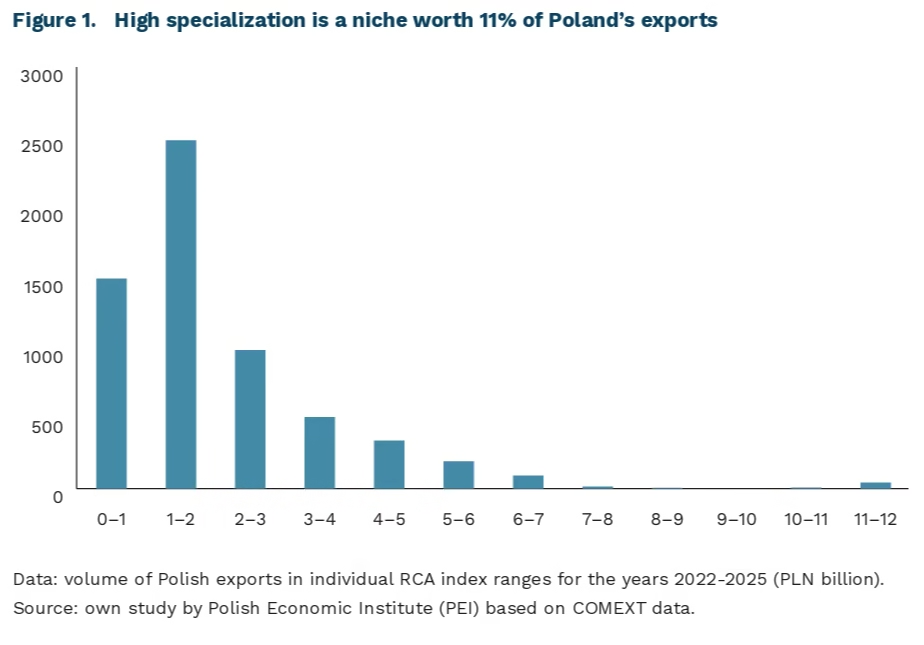
- The analysis covered approximately 1,200 goods broken down by 4-digit HS codes (the international classification system for goods in foreign trade).
Michał Kowalski
Labour costs have been the main barrier to companies’ operations in Poland for the past four years
73% of companies in the transport, freight and logistics sector reported rising labour costs in July 2026
69% of construction companies reported problems with the availability of staff in July 2026
labour costs account for almost 15% of companies’ operating costs
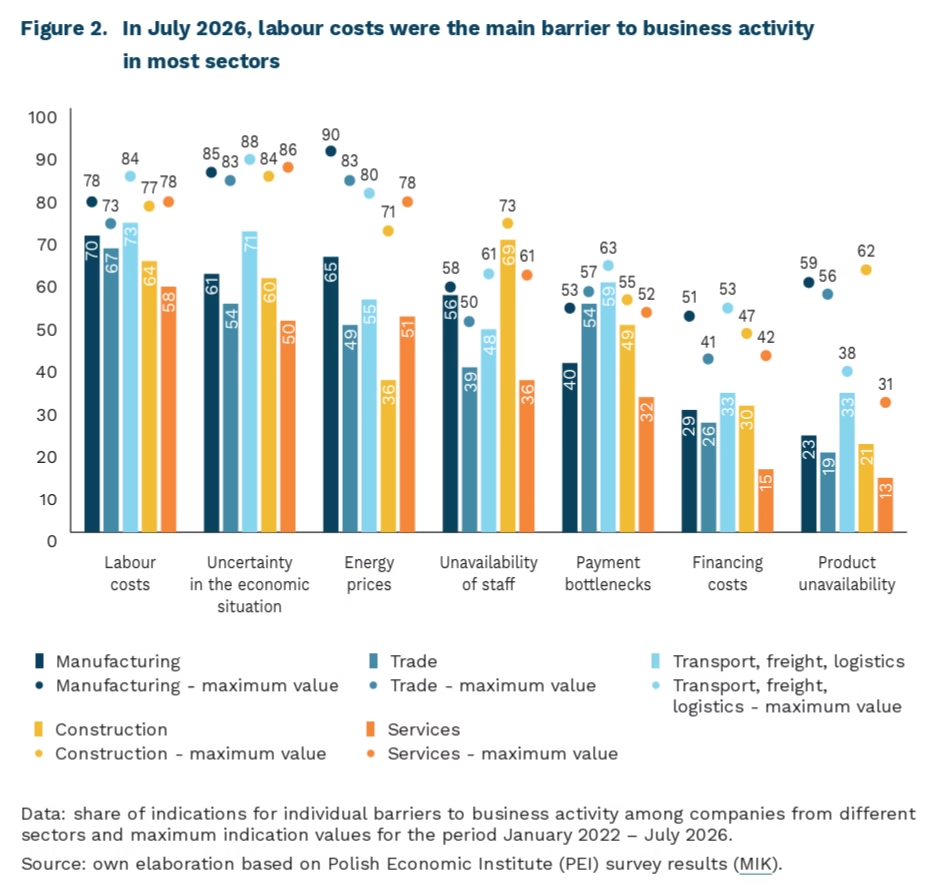
Since 2022, the three main barriers to companies’ operations have been labour costs, uncertainty in the economic situation, and rising energy prices, according to MIK research. From January 2022 until autumn 2023, the main barrier to business activity was uncertainty in the economic situation, cited by between 66% in autumn 2023 and over 80% in autumn 2022. In subsequent years, the share of indications for this barrier fell significantly, fluctuating in the range of 50-60%. An exception was March and April 2026, when as many as 66% of companies cited problems related to economic uncertainty. This was connected to the international geopolitical situation – the US attack on Iran and the resulting disruptions in the fuel market. References to economic uncertainty are less varied across sectors than for other barriers, although it can be noted that TSL companies cite it slightly more often (71% in July this year), whilst service sector companies cite it less frequently (50%).
Since the end of 2023, labour costs have been the main barrier to companies’ operations. According to MIK research, around 2/3 of surveyed companies cite them, and fluctuations between individual months are markedly smaller than in the case of economic uncertainty. Sectoral differentiation is also limited, although, as with economic uncertainty, transport, freight and logistics companies cite them somewhat more frequently (73% in July this year), while services companies do so less frequently (58%). In the case of the third most frequently cited barrier – energy prices – the peak of indications occurred in 2022, while more recently a sharp rise, to 61%, took place in April of this year. The sector that most frequently reports difficulties related to rising energy prices is manufacturing (65% in July this year), while construction companies complain about this least often (36%).
In July 2026, half of companies reported problems related to the unavailability of staff. This barrier displays a degree of seasonality – an increase in indications of its severity frequently occurs in the summer months, when demand for seasonal workers rises. The sector that most frequently reports problems with worker availability is construction (in July this figure reached nearly 70% of companies). In previous years too, the highest indications for construction occurred in the summer months. More than 40% of surveyed companies report problems related to payment bottlenecks. Since 2022, their share has fluctuated between 40% and 50%, with the sector most affected by payment problems being transport, freight and logistics – in July, nearly 60% of companies in that sector reported them. The two least frequently cited barriers are financing costs and product unavailability. Indications of problems related to high financing costs were at their peak at the end of 2022, and since mid-2025 have fluctuated between 20% and 30%. High financing costs are most frequently reported by transport, freight and logistics companies (33% in July this year) and least frequently by services companies (15% in July this year). Product unavailability was a fairly commonly cited barrier in 2022 following the outbreak of full-scale war in Ukraine, when over 40% of companies indicated it; currently, problems with product availability are typically reported by around 20% of companies. In July this year, it was most frequently cited by transport, freight and logistics companies (33%) and least frequently by services companies (13%).
MIK data and other economic signals indicate that barriers related to recruiting and retaining workers are increasingly hampering the operations of Polish companies. The share of labour costs in companies’ total operating costs reached a record level of nearly 15% at the end of 2025, and real wage growth outpaced real growth in worker productivity. In the coming years, the severity of this barrier is likely to persist. The factors working against entrepreneurs will primarily include demographic issues, which will deepen problems with worker availability, as well as regulatory ones – including provisions on pay equality and pay transparency, which may prompt some companies to raise wages. At the same time, this may encourage investment in their own employees (discussed in the following article) and the adoption of modern technologies, which would be a desirable direction of change for the Polish economy.
Anna Szymańska
Reaping the benefits of artificial intelligence requires a trained workforce
74.9% of the surveyed SMEs in Poland report having only basic digital skills within their organizations
42.4% of the surveyed SMEs in Poland invested in human capital in 2025
A new OECD publication suggests that employees’ skills may determine whether the economy benefits from technological transformation. Artificial intelligence (AI) is often seen as a technological breakthrough that is already changing the workplace. However, whether companies will be able to integrate these new tools into their business operations and harness their potential will depend largely on the skills of their workforce.
The development of AI systems significantly increases the importance of employees’ digital skills. Advanced programming skills, such as machine learning and computer systems integration, remain a narrow niche. Although these skills are necessary for developing and implementing AI-based systems within organizations, responsibility for this area can be entrusted to a relatively small group of employees or external integrators. Meanwhile, the importance of general digital competencies, as well as the ability to use, analyze, and interpret data, is growing. According to PEI data2, 74.9% of the surveyed SMEs in Poland reported that they possess only basic digital competencies regarding the implementation of AI solutions, while for 28.8%, competency gaps constituted a barrier to implementing advanced digital technologies. As many as 16.5% of the surveyed SMEs in Poland assessed that they have virtually no digital competencies within their organizational resources. The situation is quite different for large companies, where only 16.3% of firms reported facing digital competency barriers or a lack of digital competencies. This is also reflected in data on AI adoption by companies, where Polish SMEs use this technology almost the least frequently in the EU (7.09% of firms; 35% of the EU average), while large enterprises are closer to the EU average (45.81% of enterprises; 83% of the EU average).
Investments in human capital are an effective way to bring new skills into an organization, for example, through employee training. In the context of AI, training provided by employers to their employees can lead to a sense of increased productivity or improved overall working conditions. Unfortunately, such investments are not very popular in Poland. 41.1% of the surveyed SMEs did not invest in human capital in 2025 and did not plan to do so the following year. This percentage is similar to that of entities that invested in human capital last year (42.4%), although slightly more – 57.3% of SMEs – planned such initiatives for 2026.
As the OECD points out, particularly in the case of SMEs, financing training faces both financial constraints and significant barriers at the management level. It is essential to change management’s approach to training so that they view it as an investment that yields returns and boosts the company’s productivity. Researchers point to the opportunities arising from training management and establishing platforms for knowledge exchange among managers, which help strengthen the learning culture within the organization. However, according to PEI research, as many as 72.2% of SMEs did not invest in the development of management processes and organizational capital in 2025 and did not plan to do so in 2026.
According to the World Bank, workers in Poland report the highest unmet need for skills development in the EU. This, combined with limited business investment in human capital, raises serious concerns about the future competitiveness of companies. Ultimately, if reaping the benefits of AI requires a properly trained workforce, skills will become the bottleneck for companies operating in sectors with significant exposure to AI.
2. The data comes from a survey conducted by the Polish Economic Institute on a sample of 1,000 companies operating in Poland. The survey covered self-employed individuals, micro, small, medium, and large enterprises. The data was collected in December 2025.
Jakub Witczak
The European Union strengthens its efforts to enhance payment sovereignty
59% of all non-cash transactions in the EU are card payments
88% of all card payments at physical points of sale in the EU are contactless
two-thirds of all card transactions in the euro area are processed by U.S. card schemes
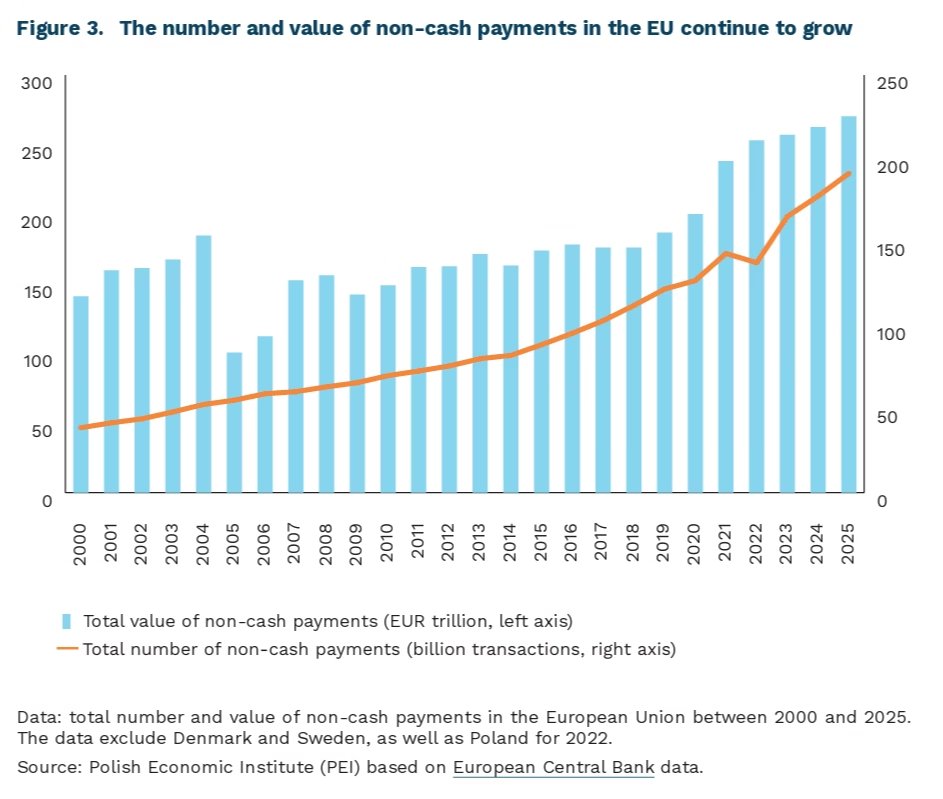
The growth of non-cash payments in the European Union remains strong. In the second half of 2025, 99.1 billion non-cash payment transactions were executed across the EU, representing a 7.9% year-on-year increase. Their total value reached EUR 136.2 trillion, up 2.2% compared with the second half of 2024. Card payments continue to dominate, accounting for almost 59% of all non-cash payment transactions, followed by credit transfers (23%), direct debits (12%), and electronic money payments (5%). Meanwhile, the number of contactless card payments increased by 11.9% year on year to 41.2 billion transactions, accounting for almost 88% of all card payments at physical points of sale.
Not only is the market expanding, but the way payments are initiated is also changing. According to an industry report, digital wallets (including those offered by Apple Pay, Google Pay and PayPal) have become the leading payment method in e-commerce, with their share of global online transactions continuing to grow. Account-to-account (A2A) payments, such as BLIK, which enable direct transfers between bank accounts, are also gaining importance, bolstered by the implementation of the PSD2 Directive. At the same time, the European Union is promoting the adoption of instant payments. Since 2025, banks in the euro area have been required to offer instant credit transfers at no higher cost than standard credit transfers, with the aim of accelerating their adoption by both consumers and businesses.
The growing digitalisation of payments has also exposed a structural weakness of the European market – its heavy reliance on non-European payment infrastructure providers. According to the ECB, around two-thirds of card transactions in the euro area are processed through the global card schemes Visa and Mastercard, while many Member States do not have domestic card payment schemes of their own. As a result, although payments are becoming increasingly digital, much of the underlying infrastructure remains under the control of non-European providers. Consequently, payments are no longer viewed solely through the lens of convenience and market competition but are increasingly regarded as an issue of economic resilience and strategic security.
In response, the European Central Bank has placed greater emphasis on developing a pan-European payment infrastructure. The Eurosystem’s Comprehensive Payments Strategy (2026) identifies strengthening the strategic autonomy and resilience of the European payments market as one of its key objectives. To achieve this, the ECB supports initiatives such as Wero – a pan-European digital payment system developed by a consortium of European banks – as well as the digital euro (CBDC), which we discuss in greater detail in our report. As a result, the future development of the European payments market will increasingly be shaped not only by technological innovation but also by broader objectives related to economic security and the European Union’s strategic autonomy.
Hubert Pliszka
The level of bonuses accounts for a significant proportion of the gender pay gap
42% of managerial positions in private companies with more than 50 employees are held by women
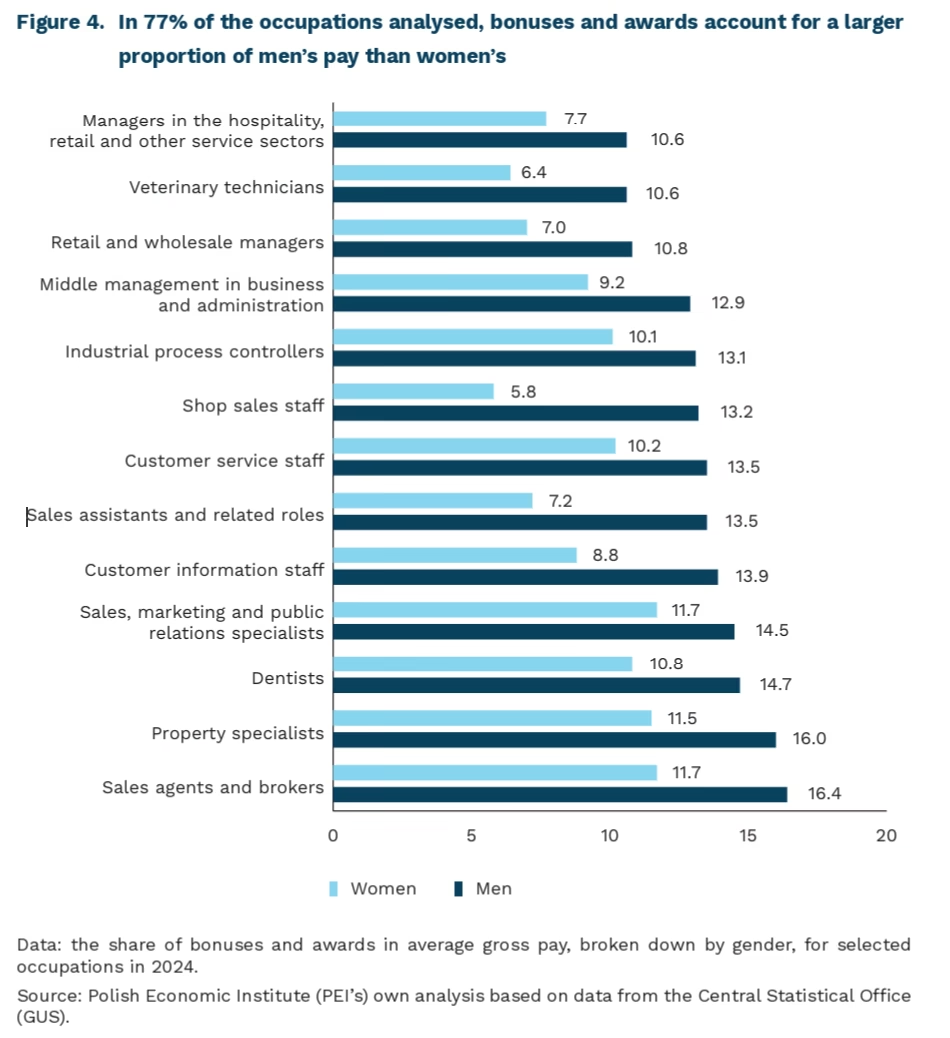
in 77% of occupations, bonuses and awards account for a larger proportion of men’s pay than women’s
4% the average gender pay gap in Poland in 2024
The scale of the gender pay gap varies depending on the sector of employment. The widest gaps were found in the finance and insurance sector – men earn almost 29% more than women. Similarly high gaps are recorded in IT and telecommunications (22%) and mining (20%). At the other end of the spectrum is the construction sector, where women earn 37% more than men. Although the pay gap is wider in European Union countries than in Poland, the pattern of variation in the gap across sectors is exactly the same as in Poland. This suggests that we are dealing not with a local anomaly, but with a structural mechanism common to labour markets organised in a similar way.
The observed gender pay gap can be partly explained by the fact that women are less likely to hold high-paying positions. Data from the Central Statistical Office (GUS) on employment in private companies with more than 50 employees show that women hold 42% of the highest-paid managerial positions. However, pay differences in favour of men also occur in the same positions and within the same occupations. Importantly, the size of the observed pay gap increases with the level of the position held and the average pay.
The differences in pay between women and men can be partly explained by the way in which the various components of pay are determined. Breaking down pay into fixed components – basic pay and the thirteenth-month salary – and variable components – bonuses and awards, overtime, fees and profit-sharing – reveals significant gender differences. When comparing the share of fixed and variable components across 164 occupational groups, we observed that in 77% of all occupations analysed, men have a higher share of bonuses and awards in their total pay than women in the same occupations. In 60% of these occupations, men have a higher share of overtime pay. Women, on the other hand, have a higher proportion of basic pay in the vast majority of occupations (68% of cases).
Importantly, the data presented relate to narrowly defined occupations; they therefore allow for a comparison between women and men performing almost identical work and who, in theory, have an equal chance of being covered by the bonus scheme. This may mean that either more men than women working in particular occupations receive bonuses and awards, or that the bonuses and awards granted to them are of a higher value than those granted to women. It is difficult to determine unequivocally which of these two mechanisms predominates, as the GUS data show only the aggregate share of bonuses in total pay, rather than the number of people receiving them or the distribution of their amounts. Regardless of which scenario prevails, however, the very fact that the difference persists within the same, narrowly defined occupation suggests that it is not differing job roles or scopes of duties, but rather something occurring at the stage of awarding bonuses within the context of identical work, that is responsible for the observed gap.
Paula Kukołowicz
An intergenerational capital fund: a Finnish initiative to raise birth rates
EUR 26,400 the estimated one-time payment that young parents in Finland could receive upon the birth of their first child under the proposed Family Federation of Finland scheme (estimated for first-time parents aged 29)
43% the share of Finns aged 45 who are childless
1.3 Finland’s total fertility rate in 2025
3.17 the ratio of the lifetime contributions made by parents to those made by childless working-age adults in Finland
Although enthusiasm in Europe for cash transfers as a tool to increase fertility has been waning, a novel proposal has emerged in Finland aimed at encouraging earlier childbearing. The Family Federation of Finland, the country’s leading non-governmental organization supporting parents and families, has put forward an ambitious proposal to establish a government-backed fund to finance future generations. Under the proposal, every child born in Finland would receive an individual account with an initial endowment of EUR 5,000, invested in the capital markets until the child reaches adulthood and starts a family of their own. At that point, new parents would be entitled to withdraw 70% of the accumulated funds upon the birth of their first child, 60% of the remaining balance upon the birth of their second child, and the remainder upon the birth of their third child.
The mechanism is deliberately designed to strongly incentivize the birth of a first child, addressing the postponement of first births, which is widely regarded as one of the main drivers of declining fertility. Assuming an annual investment return of 6%3, the estimated payouts to new parents at the hypothetical ages of 29, 32, and 34 would amount to EUR 13,200, EUR 3,900, and EUR 2,800, respectively. Individuals who remain childless or have fewer than three children before the age of 45 would forfeit all or part of the accumulated capital. Any unused funds would be returned to the common pool and used to finance future generations.
Because it would take more than two decades for the fund to produce its first effects, the authors propose introducing a temporary system of one-off birth grants of EUR 5,000, EUR 2,000, and EUR 500 for the first, second, and third child, respectively.
The initiative is estimated to cost EUR 325 million per year between 2027 and 2075. This is equivalent to 0.12% of GDP, 0.37% of the annual state budget, 0.81% of annual pension expenditure, and 23% of annual family benefit spending. By comparison, total family benefits in Poland amounted to PLN 75.9 billion in 2025, equivalent to 2.1% of GDP. The authors argue that by the second generation of beneficiaries, the scheme could become self-financing, as not all eligible individuals would ultimately claim the funds accumulated on their behalf.
The authors’ model suggests that, during the period in which the temporary benefits are in place, Finland’s total fertility rate would increase from 1.3 to 1.6. Once the full-scale fund becomes operational, they project that the fertility rate could rise to 2.0. The share of 45-year-olds without children would fall from 43% to 35% during the temporary-benefit phase and further to 25% under the proposed long-term funding model.
These projections, however, appear highly ambitious. As the authors themselves acknowledge, decisions about having children are not driven solely by economic considerations, and even many of the economic factors shaping fertility decisions remain important despite the availability of generous public support, including stable employment, financial security, and adequate housing. At the same time, the proposal is not without merit. The authors note that existing family benefits in Finland have not been indexed for many years and that the lifetime fiscal contributions of parents are more than three times higher than those of childless adults.
Another key argument advanced by the authors is that the likelihood of having a first and subsequent child is highest among couples with the greatest incomes. However, this argument rests on an empirically unverified assumption that the relationship is causal and runs from income to fertility. An alternative explanation is that the same underlying factors that contribute to higher earnings also increase the likelihood of having children. If that is the case, simply improving families’ economic position may not, by itself, lead to higher fertility.
3. Equivalent to the average return on pension funds.
Agnieszka Wincewicz-Price
