Economic Weekly 10/2026, March 13, 2026
Published: 13/03/2026
Table of contents
Global steel sector braces for impact of Iran conflict
32 million tonnes of steel were produced by Iran in 2025
USD 1.15 billion was the value of Iran’s steel exports in 2024
8.5% was the EU’s share in global steel imports from Iran in 2024
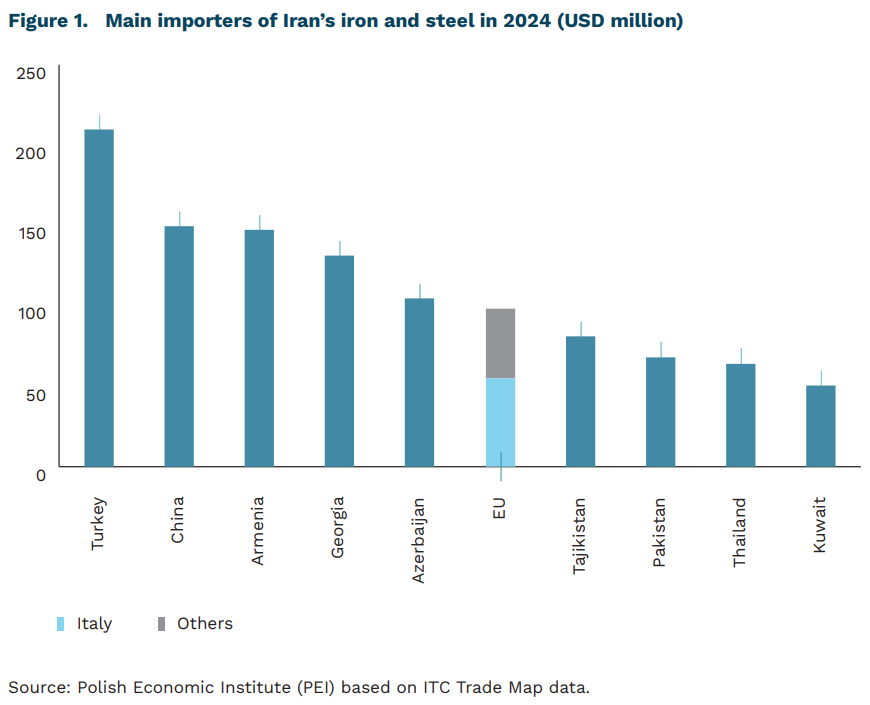
The attack on Iran, launched by Israel and the United States on 28 February 2026, affects the global steel market for three reasons. The first is Iran’s significant role in the global supply of steel. In 2025, Iran produced nearly 32 million tonnes of steel, making it the world’s 10th largest producer. For comparison, Poland produced 7.2 million tonnes in the same year – almost 4.5 times less. In 2024, Iran exported iron and steel products worth a total of USD 1.15 billion to global markets, making them its fifth-largest export category. The main destinations for Iranian steel exports were Turkey, China and Armenia. Iran specializes in trading steel semi-finished products, including billets and blooms – cast products used as raw material for further manufacturing – and in 2024 it was the world’s 13th largest exporter of these goods. Although EU markets accounted for only 8.5% of the total value of Iranian steel exports in 2024, Italy was the fourth-largest importer of Iranian steel semi-finished products that year. The potential scale of damage to Iran’s mining and industrial infrastructure remains uncertain, which could affect the supply of fossil fuels and steel from the country.
Rising uncertainty among steel producers and consumers is also driven by disruptions in maritime transport caused by the blockade of the Strait of Hormuz. The strait is one of the most important routes in global oil trade, but also an important corridor for global steel transport. Longer delivery times from Asia and higher freight costs are already being observed. This means, among other things, a temporary suspension of Chinese steel imports to countries in the region. Around one-fifth of the world’s consumption of petroleum liquids passes through the Strait of Hormuz annually, which also creates uncertainty regarding energy costs in the coming weeks and months. Although these costs are important for all industrial consumers, they would particularly affect steel plants using electric arc furnaces (EAF). About 88% of the energy used in EAF steel production comes from electricity and natural gas. The share of electric arc furnaces in total steel production is significantly higher in the EU (44.4%) than the global average (29.1%).
Marianna Sobkiewicz
Cuba is battling energy shortages
83% of Cuba’s electricity in 2023 was generated from crude oil
89% of Cuban households were living in extreme poverty in 2025
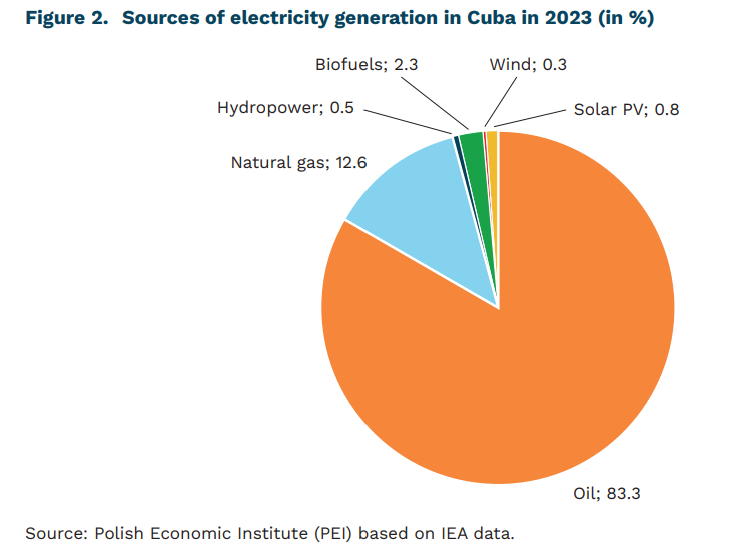
American pressure aimed at political change in Cuba is currently focused – alongside the US embargo in place since 1961 – on disrupting crude-oil supplies, which underpin the island’s economy. Crude oil remains the primary source of electricity generation (83% in 2023), with the remainder coming from LNG (12.6%) and biofuels (2.3%). Cuba covers roughly 40% of its oil needs domestically (about 40,000 b/d of low-quality heavy crude) but the rest of it must be imported. Until January 2026, Venezuela and Mexico were the main suppliers. Recent US actions have curtailed imports even from these sources – through tighter control over Venezuela’s oil sector following an intervention on January 3, and through measures targeting Mexico and other exporters, including threats of additional tariffs for countries supplying oil to Cuba. These restrictions have reportedly been partially offset by US allowances for limited crude-oil deliveries through the private sector. In parallel, Cuban authorities issued a decree on March 5 introducing a framework for public–private cooperation, which may signal a cautious shift in economic policy. However, it remains unclear how the provisions will be implemented in practice.
Chinese investments in renewable energy sources in Cuba may be unacceptable to the US. According to the National Energy Transition Strategy announced in 2024, Cuba is to transform its energy mix by 2030 through investments in renewable energy sources and increasing domestic oil production. The cost of this transformation is estimated at approximately USD 8-10 billion and would be based largely on Chinese capital. In 2024, the government announced a plan to build 2 GW of solar power plants by 2028, and in December 2025, work on seven of the 92 planned photovoltaic parks was completed. Chinese batteries and wind panels are also being imported to Cuba. It is suspected that due to a lack of funding, these are being partially exchanged for nickel, as Cuba has one of the world’s largest nickel deposits.
Electricity shortages affect the entire Cuban economy, but their effects are felt most acutely by the population. Blackouts last up to 24 hours and are caused by oil shortages and the poor technical condition of power plants that have seen little modernization – highlighted by the March 4 failure at the Antonio Guiteras plant, one of the country’s most important generators. The residential sector consumed 61% of Cuba’s electricity in 2023. At the same time, 89% of Cuban households live in extreme poverty. Purchasing a power generator or solar panels is therefore unaffordable (the average price of a solar kit for a home in Cuba is approximately USD 5,000). People are mitigating the effects of electricity shortages by seeking alternatives – coal stoves, communal cooking in homes with access to electricity, etc., and for road transport – bicycles or horseback riding. The commercial sector and public services (consumption of 19% of electricity in 2023) and industry (17%) are in a better position, as they have greater capacity to equip themselves with the necessary equipment. The difficulties in the tourism sector are most visible to international public opinion – in January of this year, the number of visitors to the island fell by 6% year-on-year. The energy crisis may turn into a humanitarian crisis. This is partially countered by aid from Mexico, Brazil, Canada, and China, among others.
Katarzyna Sierocińska
The creativity of Polish teenagers does not translate into innovation
66% of employers believe that creative thinking will become increasingly important by 2030 as a key competency in the labor market
1 in 3 Polish 15-year-olds demonstrate very high creative thinking skills
23rd place goes to Poland in the European Innovation Scoreboard (covering 27 EU countries)
Creative thinking is one of the key skills of the future. Along with innovation and adaptability, it has become the “hard currency” of the labor market. As many as 66% of employers believe that by 2030 creative thinking will grow in importance as an essential work competency1 . Employers are increasingly aware that technologies (AI, robotics) can enhance efficiency but cannot replace human-centered abilities. It is precisely human-centric skills that drive innovation, collaboration, and long-term productivity.
Creative thinking is highly resistant to automation. Tasks involving empathy, creativity, and curiosity have only 13% automation potential, since they rely on human – not machine – judgment, context, and life experience. Meanwhile, according to the World Economic Forum, by 2030 two out of five current work-related competencies will either transform or become obsolete.
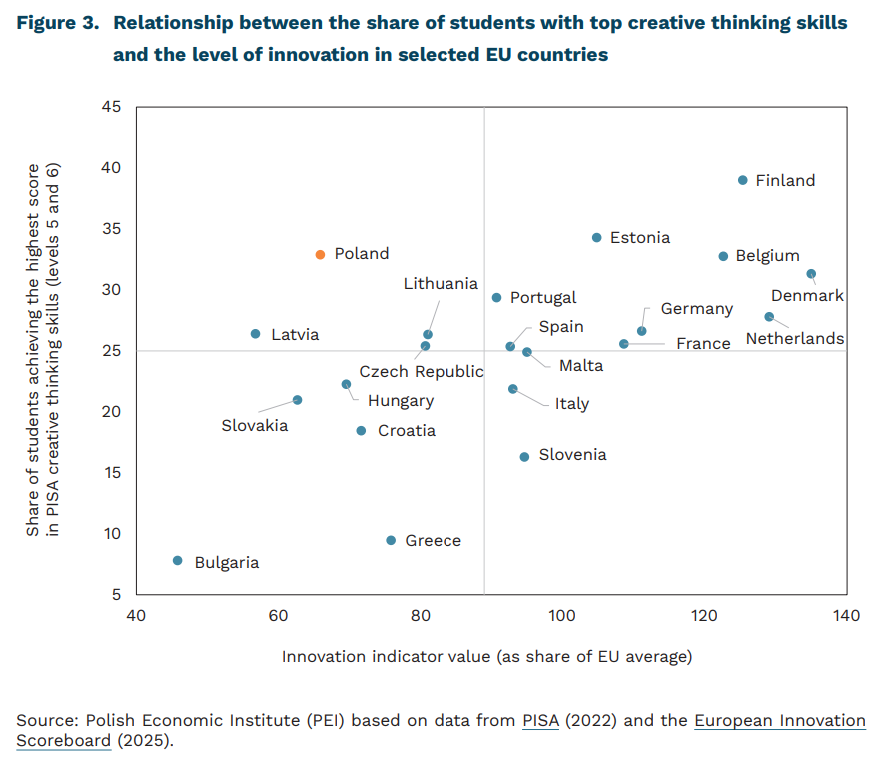
Polish 15-year-olds achieved strong results in creative thinking skills in the PISA assessment conducted in 2022.2. The average score of Polish students was 34 points (compared with an OECD average of 33). Poland’s results were similar to those of students from Latvia, Denmark, Belgium, and Portugal. Within the EU, only students from Estonia and Finland outperformed Poland. The assessment distinguished six levels of creative thinking proficiency. One in three Polish 15-year-olds demonstrated skills at the two highest levels (levels 5 and 6).
Without creative individuals, there can be no innovative economy, but their potential must be directed toward creating value rather than merely coping with the system. Poland continues to rank low in the European Innovation Scoreboard 2025 – 23rd out of 27 EU countries, with a result equal to 65.9% of the EU average (“emerging innovator”). Thus, together with Latvia, Lithuania, and the Czech Republic, Poland belongs to the group of countries with above-average shares of students achieving top performance in creative thinking and below-average levels of economic innovation.
Polish teenagers demonstrate high creative potential, yet among adults this energy often channels into unproductive entrepreneurship. In effective systems, creativity drives market innovation; in Poland, however – according to some studies – it is frequently absorbed by bureaucracy, tax optimization, and procedural regulatory circumvention. High levels of bonding social capital (family ties, mutual support) contrast with low institutional trust, limiting cooperation and knowledge exchange essential for innovation. Deregulation and institutional simplification that reduce incentives for rent-seeking could redirect Polish creativity toward productive innovation.
1 In the Future of Jobs Report 2025, skills categories were ranked by net growth – the difference between the percentage of employers expecting increased use of a skill and those anticipating its decline.
2 The 2022 PISA assessment measured creative thinking for the first time in the program’s history. Creative thinking was defined as the ability to generate, evaluate, and improve ideas to solve problems or express oneself creatively, leading to new knowledge, effective and original solutions, products, or artworks. Students solved dedicated tasks in four domains: visual expression, written expression, social problem-solving, and scientific problem-solving
Cezary Przybył
The Monetary Policy Council once again cut interest rates
3.75% the NBP reference rate
6.1% y/y wage growth in the enterprise sector in January
The Monetary Policy Council (MPC) lowered interest rates by 25 basis points, bringing the NBP reference rate to 3.75%. The decision was supported by previously favorable macroeconomic data. In January, another decline in inflation was recorded, reaching 2.2% y/y (before the revision of the inflation basket), along with a noticeable slowdown in wage growth from 8.6% y/y in December to 6.1% y/y in January. An additional argument supporting the MPC’s March decision was the outlook for inflation processes, which improved significantly compared with the previous projection. The latest forecasts assume that inflation will remain close to the NBP target, reaching 2.3% in 2026, 2.4% in 2027, and 2.3% in 2028. However, the projection does not take into account the war in the Middle East or a significant increase in energy commodity prices, which could translate into higher inflation and increased economic uncertainty.
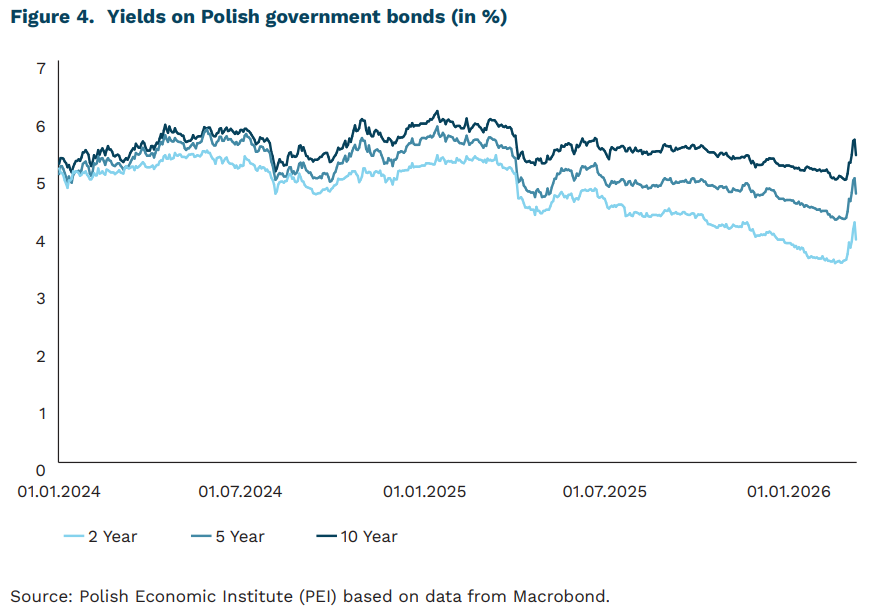
Uncertainty is also visible in the debt market. Increases were observed along the entire yield curve of Polish government bonds, although yields on longer-term securities rose the most. The yield on Polish 10-year government bonds temporarily rose on Monday to 5.9% from 5% a week earlier, before falling by about 30 basis points later the same day. Further escalation of military actions initially pushed yields higher on core European markets as well. The subsequent improvement in sentiment was consistent with a broader calming of markets, supported by declining oil prices. Nevertheless, yields on Polish bonds remain elevated compared with levels seen before the outbreak of the war.
The prolonged conflict is pushing further interest rate cuts further into the future. Until recently, the market consensus assumed one more 25 basis point rate cut in the second quarter of 2026; however, the outbreak of war in the region and rising energy commodity prices are delaying this scenario. The scale and persistence of this effect will largely depend on the duration of the conflict. The current impulse resembles a limited commodity shock rather than the beginning of a broad economic disruption similar to that seen in 2021-2022. At that time, the global economy was simultaneously facing a sharp rise in energy prices, disrupted supply chains, strong post-pandemic demand, and mounting cost pressures in industry. Today, the starting point is different – global demand does not appear strong enough on its own to trigger a new wave of broad price pressures.
Piotr Kamiński
AI is cautiously entering government offices
46% of people working in the public administration use generative AI tools for professional tasks
16% of respondents fear that their job may be replaced by AI
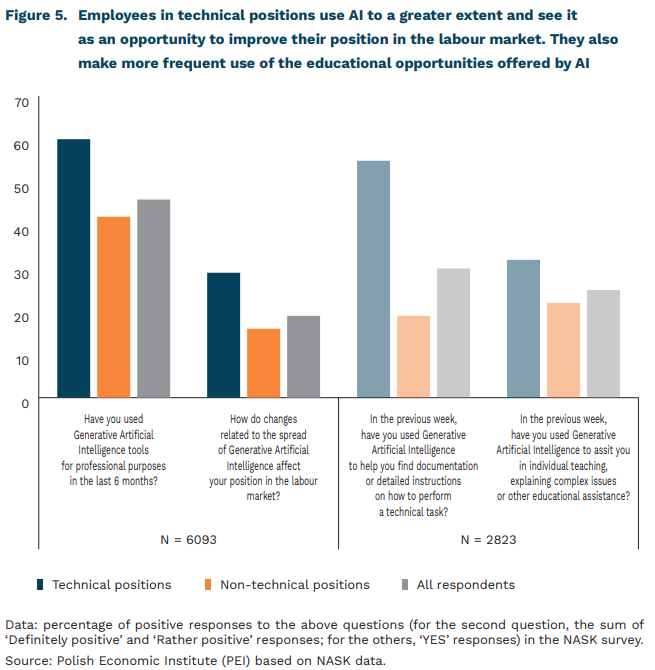
Almost half of public administration employees in Poland use generative artificial intelligence (AI) tools to perform their professional tasks. AI is used more often in managerial and technical positions, but the differences are not large. According to the authors of the latest NASK report, young employees use AI tools more often, rate their skills in this area more highly, and are more concerned about the negative impact of AI on their jobs.
When assessing the impact of generative AI on jobs, 16% of respondents indicated that their job could be replaced by such tools within five years. Significantly more, as many as 36%, indicated that AI would have a significant impact on jobs in public administration. Technical employees (i.e. support or specialist staff in the field of digitalisation) are more likely to see opportunities for themselves than non-technical employees – 29% of the group of technical employees believe that AI will have a positive impact on their position in the labour market, compared to 16% of those in the other group.
These results are worth comparing with the assessment of jobs vulnerability to generative AI – NASK and ILO study from 2025 indicate that many jobs associated with administration fall into the moderate vulnerability group, and some into the significant vulnerability group (i.e. more than a 50% chance of their tasks being replaced by AI). Individual occupations, such as population registry clerks or document management specialists, are in the highest vulnerability group, where the average probability of their tasks being replaced by AI is higher than 0.6.
The results of the survey among people in technical positions are noteworthy – they are in the groups of occupations with the highest susceptibility to AI, yet at the same time they perceive the risk of their work being replaced to a relatively lesser extent. They are also much more likely to assess the changes associated with the spread of AI as beneficial to their position in the labour market. This may be related to different ways of using AI – technical employees use it to search for documentation or instructions for performing technical tasks, and they also make more frequent use of the educational opportunities offered by large language models. Perhaps they believe that this is an effective way to improve their professional qualifications, which in the long term will protect them from being replaced by more advanced AI systems.
The results described in the report seem to indicate great potential for the implementation of AI in public administration – in addition to the already significant level of penetration, there is a willingness to learn (87% of respondents would take part in training courses) and hopes for a reduction in the number of repetitive, routine activities. The relatively low level of concern about job losses should also encourage wider adoption of this technology. What stands out in the respondents’ expectations is the facilitation of navigation through the maze of regulations and documents – AI therefore has a chance to overcome one of the biggest obstacles to improving the efficiency of national administration.
Ignacy Święcicki
More than one-third of companies plan to invest in 2026
19% of companies have invested in new tangible assets since the beginning of 2026
35% of companies plan to invest in new tangible assets in 2026
43% of construction companies declare they will invest by the end of 2026
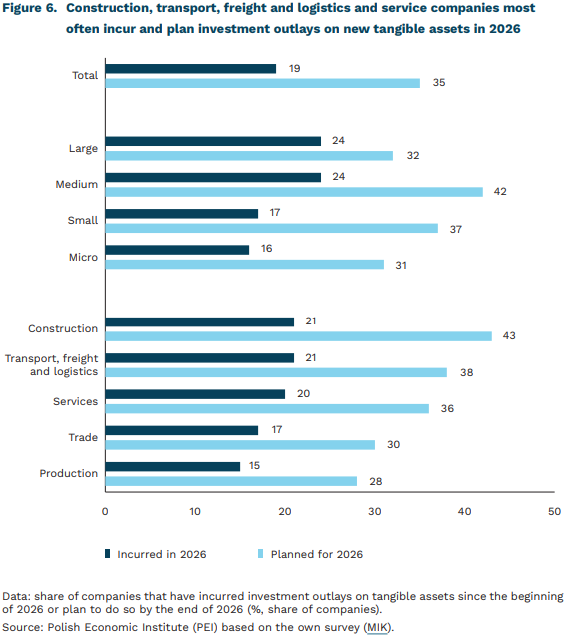
The value of the indicator for investments in the March MIK survey (Monthly Business Climate Indicator) was 82.4 points, which means that most companies did not invest in the last three months. Data from the NBP Quick Monitoring Survey also indicate a deterioration in corporate investment sentiment at the end of 2025. At the same time, according to the NBP, companies did not plan a significant increase in the number of investments in the first quarter of 2026, although they did consider increasing the value of investment outlays, which may suggest scaling up investments that were already planned.
According to the March MIK survey, 19% of companies have invested in new tangible assets since the beginning of 2026, and 35% plan to do so by the end of this year. Large and medium-sized enterprises are the most investment-active: among them, nearly 25% have already incurred investment expenditure. At the same time, as many as 42% of medium-sized companies plan to invest in 2026. Among small companies, 17% have invested, while 37% declared they intend to do so by the end of the year. Micro-enterprises are the least inclined to invest: 16% of the smallest companies reported having made investment outlays, and 31% have plans for the rest of 2026.
Construction, transport, freight and logistics and services are slightly more active in terms of investment. About one-fifth of companies in these sectors have already made investments in new tangible assets this year. By contrast, among companies in trade and manufacturing, investment outlays on new tangible assets were declared by 17% and 15% of companies, respectively. Investment plans for the rest of the year are most often declared by construction companies (43%). Such intentions are also relatively common among transport, freight and logistics (38%) and service companies (36%). In trade and manufacturing, around 30% of companies have investment plans. The unfavourable investment outlook in manufacturing is confirmed by NBP data and the February PMI reading, which suggest that declining new orders may be holding back investment activity.
Compared with the situation two years ago, the share of companies that have incurred investment outlays is similar (20% in 2024 vs. 19% in 2026), while more companies than two years ago have such plans (30% in 2019 vs. 35% in 2026). Two years ago – just as now – large and medium-sized enterprises were the most willing to invest. However, the sectors showing the highest investment activity have changed: contrary to the current situation, these were manufacturing and trade.
The implementation of companies’ investment plans in 2026 may be supported by an inflow of EU funds. At the same time, companies’ investment activity is being held back by geopolitical uncertainty – the attack on Iran contributed to higher oil prices, which is causing concerns about rising transport costs, among other things. Meanwhile, as NBP data indicate, some companies do not plan to invest because they consider their scale of operations to be optimal and demand to be insufficient.
Anna Szymańska
Women perceive discrimination in the labour market but usually believe they are paid fairly
66% of female employees believe that women are treated less fairly than men in matters related to employment, pay and promotions
32% of female employees believe that men earn more than women in similar positions in their workplace
55% of female employees believe their pay is set fairly
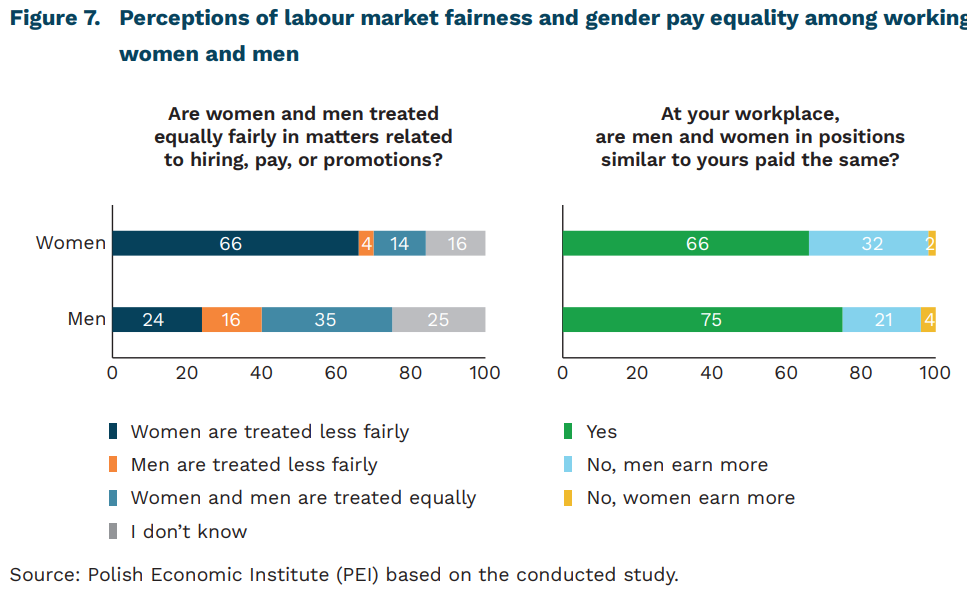
Women are more likely than men to indicate that systemic gender discrimination exists in the labour market. In a study conducted by the Polish Economic Institute3, the majority of surveyed female employees (66%) stated that women are treated less fairly than men in the labour market. Among men, 24% of respondents shared this view, while the most common opinion was that women and men are treated equally (35%). Among women, only 14% selected this response. At the same time, four times more men than women stated that men are treated less fairly (16% compared with 4%).
Women and men most often report that they have not personally experienced gender-based discrimination at work. Among men, the majority of respondents (64%) stated that they had never experienced unequal treatment due to being male, while 20% reported having experienced discrimination. Among women, 38% indicated that they had felt unfairly treated, while 47% reported no such experiences. This pattern differs among mothers of children aged 0-2. In this group, 47% report having experienced unfair treatment, while 37% have not encountered such a situation.
Respondents most commonly believe that their colleagues in similar positions earn the same amount. This view is shared by 75% of men and 66% of women. Meanwhile, 21% of men and 33% of women believe that men earn more in the same positions.
Women are more likely to attribute wage differences to discrimination, whereas men tend to cite factors related to the nature of work and productivity. Among female employees who reported that men earn more than women in comparable positions, 43% pointed to cultural biases and gender role stereotypes. In the corresponding group of men, 21% agreed with this explanation. Men were more likely to highlight differences in productivity (39% vs. 10% among women) and in the types of tasks and projects assigned (35% vs. 25%).
Both women and men generally consider their pay to be fair. On a scale from 0 to 10, 60% of men and 55% of women rated their pay above 5. A similar proportion reported being satisfied with their pay – 61% of men and 57% of women.
Inequalities in the labour market may be indirect or structural, meaning they are not always easily identified as individual experiences of discrimination. Some of these inequalities become apparent in the context of balancing family and work responsibilities, as discussed in more detail in the reports Work and Home – Challenges for Parents and Their Consequences and Mom Returns to Work – Behavioural Barriers and Directions of Support. Moreover, perceptions of inequality may be limited by a lack of access to full wage information within organisations. Greater pay transparency, as guaranteed by EU law, may influence how individuals perceive their own situation and the overall scale of workplace inequalities.
3 The study population consists of salaried employees aged 25-59 working in companies employing 50 or more people and working at least 20 hours per week. A detailed description of the study is provided in the report Pay Transparency – Company Practices and Employee Attitudes.
Iga Rozbicka