Economic Weekly 16/2026, April 24, 2026
Published: 24/04/2026
Table of contents
The defence spending impulse is set to support economic growth
by 2.7 pp. of GDP the share of defence spending increases on average during a typical defence boom, which lasts more than 2.5 years
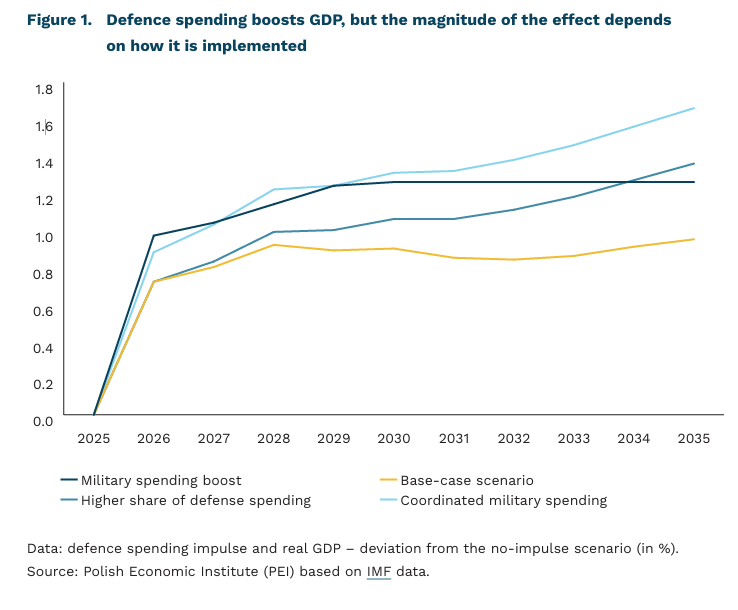
by 1.3 pp. GDP the additional defence impulse in the EU is projected to rise by 2030, with its impact on growth depending on the composition of spending and the degree of European coordination
Europe is entering a period of a stronger defence spending impulse. The IMF estimates that in 2020-2024 around half of countries increased defence outlays, while the share of economies spending more than 2% of GDP on defence rose to nearly 40% in 2024, up from 27% in 2018. In a representative group of EU countries, additional defence spending is projected to increase by 1 percentage point of GDP in 2026 and by 1.3 percentage points by 2030. Poland is among the countries where the scale of this increase has been particularly pronounced, with defence spending rising from 2.2% of GDP in 2021 to an estimated 4.5% in 2025.
Investment is the main channel through which defence spending can translate into more durable growth. In its model for Europe, the IMF shows that a higher share of investment spending strengthens long-term macroeconomic effects by increasing the stock of public capital and supporting productivity. Even stronger outcomes emerge under a scenario of more coordinated defence spending, based on joint procurement and lower import intensity. In such a setting, the defence impulse provides stronger support to investment while reducing pressure on external imbalances.
Defence spending does not operate as an automatic engine of growth. Based on data for 164 countries, the IMF estimates that the average fiscal multiplier of defence spending is close to 1, but varies significantly depending on the method of financing, the persistence of the impulse, the share of imported equipment, and the composition of spending. A typical defence boom raises expenditure by around 2.7 percentage points of GDP, with roughly two-thirds financed through higher deficits. At the same time, within three years of the onset of a boom, the general government deficit deteriorates by an average of 2.6 percentage points of GDP, while public debt increases by around 7 percentage points of GDP. The overall impact on GDP therefore depends not only on the scale of spending, but also on how much of the demand remains within the domestic and European economy.
For Poland and other countries in the region, the key factor will be how strongly the current defence impulse translates into the development of domestic and European industrial capacity. In Poland, equipment spending increased from 0.7% of GDP in 2021 to 2.4% in 2025 and already accounts for more than half of total defence outlays, although a significant share of these purchases has been import-intensive. From a growth perspective, the most important segments are those that generate lasting value added within the domestic and European economy, such as component manufacturing, maintenance and servicing, modernization, infrastructure, software, and R&D activities. The IMF also estimates that a 1% of GDP increase in defence spending by trading partners raises GDP in advanced economies by around 0.2%, with even stronger effects in highly integrated areas such as the EU. This implies that the benefits for Poland can stem not only from domestic procurement, but also from stronger investment demand across Europe and participation in regional supply chains.
Sebastian Sajnóg
The Visegrád Group attracts Chinese megainvestments
32% was the share of the V4 countries in the value of announced Chinese greenfield investments in the EU in 2021-2025
0.47% was the share of China in total inward FDI stock in Poland at the end of 2024
USD 8.3 billion is the value of the largest Chinese investment announced in Hungary
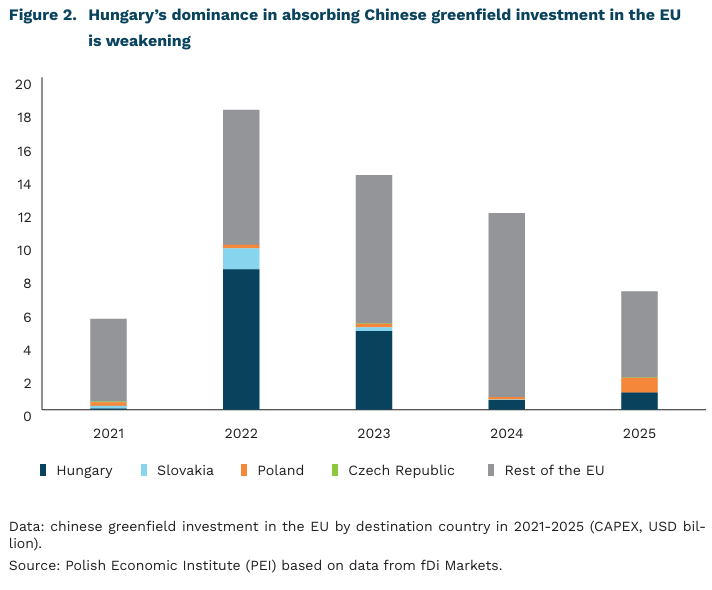
Europe remains the main destination for Chinese investment among advanced economies. According to Rhodium Group, in 2024 the European Union and the United Kingdom together attracted USD 10.5 billion in Chinese investment, accounting for 19.1% of total Chinese investment globally. Of this amount, USD 5.9 billion went to greenfield projects, while USD 4.3 billion took the form of acquisitions, including the largest transaction of 2024 – the acquisition of Techland by Tencent (USD 1.6 billion). This stands in clear contrast to the situation in the United States, where the share of Chinese investment has been steadily declining – reaching just 4% of total Chinese investment in 2024. Chinese investment on the continent is largely concentrated in electromobility, batteries, and green technologies.
Hungary leads in attracting Chinese FDI among the V4 countries, although its position relative to the rest of Europe is weakening. According to data from fDi Markets, 80% of Chinese greenfield investment in the V4 has flowed to Hungary over the past f ive years. Chinese firms announced 37 greenfield projects in Hungary with a total value of USD 14.8 billion, accounting for one quarter of all Chinese investment in the EU. This outcome was driven by megaprojects in the battery and automotive sectors: CATL (over USD 8.3 billion), Eve Energy (USD 1.1 billion), and BYD (USD 655 million). In Poland, one more project was announced (38), but the total value of greenfield investment does not exceed USD 1.7 billion. A similar amount is estimated for greenfield investment in Slovakia. The Czech Republic is the least popular destination among Chinese investors, with only 9 projects announced, worth USD 79 million. In total, the V4 countries accounted for USD 18.3 billion in Chinese greenfield investment in 2021-2025, representing 32% cent of all such investment in the European Union.
According to balance of payments data, the largest stock of Chinese FDI is recorded in Poland, amounting to USD 1.6 billion. However, given the size of the economy relative to the region, the dominance of European investors, and the growing importance of other Asian investors (South Korea, Japan), Chinese FDI accounts for only 0.47% cent of the total FDI stock at the end of 2024, compared with 1.3% in Hungary (USD 1.5 billion), 0.36% in the Czech Republic (USD 799 million), and 0.15% in Slovakia (USD 98 million). The discrepancy between balance of payments data and fDi Markets stems largely from the fact that the BoP records FDI stock at the end of the reporting period, whereas fDi Markets captures declared ex ante CAPEX, which is typically implemented over multiple years. In addition, part of project costs may be co-financed through domestic debt and public funds.
The growing inflow of Chinese investment into Europe has prompted the European Commission to take regulatory action. The EU’s proposed Industrial Accelerator Act, presented in March this year, provides for a requirement to obtain prior approval for investments exceeding EUR 100 million in four strategic sectors if the investor originates from a country controlling more than 40% of global production capacity in a given sector – in practice, the instrument is therefore targeted at China. Approval requires meeting at least four out of six conditions, including, mandatorily, employing at least 50% of the workforce from the EU; the remaining criteria include establishing a joint venture, a 49% ownership cap, IP licensing, R&D expenditure, and a strategy to strengthen EU supply chains.
Dominik Kopiński
In 2025, corporate profitability improved
4.1% was the net turnover profitability of enterprises in 2025
78% of companies reported net profit in 2025
9.5% was the net turnover profitability in the finance and insurance sector in 2025
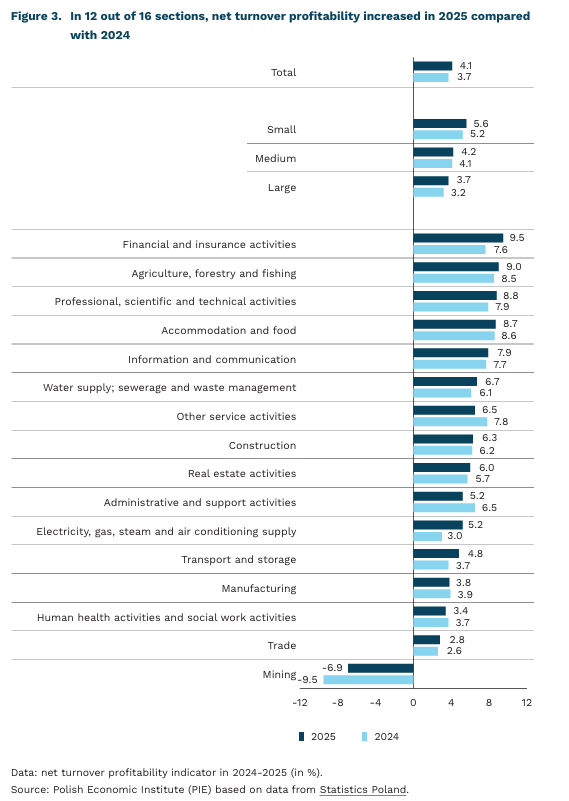
At the end of 2025, the net turnover profitability indicator in small, medium-sized, and large enterprises amounted to 4.1%, according to data from Statistics Poland. This represents a year-on-year increase of 0.4 percentage points and remains below the median for the last four years (4.3%). In 2025, nearly 78% of companies reported net profit and accounted for almost 84% of revenues among small, medium-sized, and large enterprises. Compared with 2024, the cost level indicator declined by 0.4 percentage points to 95%, despite the nominal value of costs increasing by 2.7% year-on-year.
Small companies achieved a higher net turnover profitability (5.6%); however, large enterprises recorded a stronger year-on-year increase in the indicator (by 0.5 percentage points). In 2025, nearly 81% of large enterprises reported net profit, compared with 77% of small firms. Despite their smaller scale of operations, small companies reported higher net profit per full-time equivalent than large enterprises (PLN 79.8 thousand compared with PLN 57.2 thousand). One of the reasons is the cost structure, as the cost level indicator was higher in large enterprises (95.4%) than in small firms (93.5%). The level of reported profit was also influenced by the scale of investment: large companies undertook more investment projects (202.6 thousand investments worth PLN 84.8 billion, compared with 5.5 thousand investments worth PLN 3.8 billion in small enterprises), which increased their costs in the short term.
In 2025, the highest net turnover profitability was recorded in the finance and insurance sector (9.5%), while the largest increases in the indicator value (above 2 percentage points) were observed in mining and electricity, gas, steam and air conditioning supply. Mining was the only sector to report negative profitability among the analysed industries. Net profit was most frequently reported by companies operating in real estate activities, finance and insurance, and electricity, gas, steam and air conditioning supply, where the share of profitable enterprises exceeded 81%. The highest net profit per full-time equivalent was recorded in enterprises involved in electricity, gas, steam and air conditioning supply.
The improvement in enterprise profitability in 2025 was driven by, among other factors, the gradual recovery in demand, lower inflationary pressure, and higher corporate revenues. In 2025, retail sales increased by 4.3% year-on-year (compared with 2.7% growth in 2024), which supported company revenues. The continued moderate level of inflation limited the pace of growth in operating costs, especially for energy, raw materials, and some services. Sales revenues (excluding VAT)[1] increased by 2.9% year-on-year in 2025, whereas in 2024 they had declined by 2.2%. The improved business situation is also confirmed by the results of the Monthly Business Climate Index (MIK), which showed that for most months of 2025, positive business sentiment outweighed negative sentiment among enterprises.
- According to the definition of Statistics Poland, sales revenues and equivalent revenues include revenues from the sale of products, goods, and materials, expressed in actual sale prices after taking into account discounts, rebates, and deductions, excluding VAT. In the calculation variant of the profit and loss account, they include sales revenues of products as well as goods and materials, while in the comparative variant they additionally include changes in product stocks and the cost of generating benefits for own needs.
Aleksandra Wejt-Knyżewska
The global economy is becoming increasingly reliant on electricity
by 800 TWh global electricity demand rose in 2025, which is almost five times Poland’s electricity consumption last year
for 80% of the growth in global electricity demand in 2025 accounted emerging and developing economies (EMDE), primarily China
for 1.5% of global electricity consumption data centres accounted by the end of 2025; according to the IEA, this is set to rise to 3% by 2030
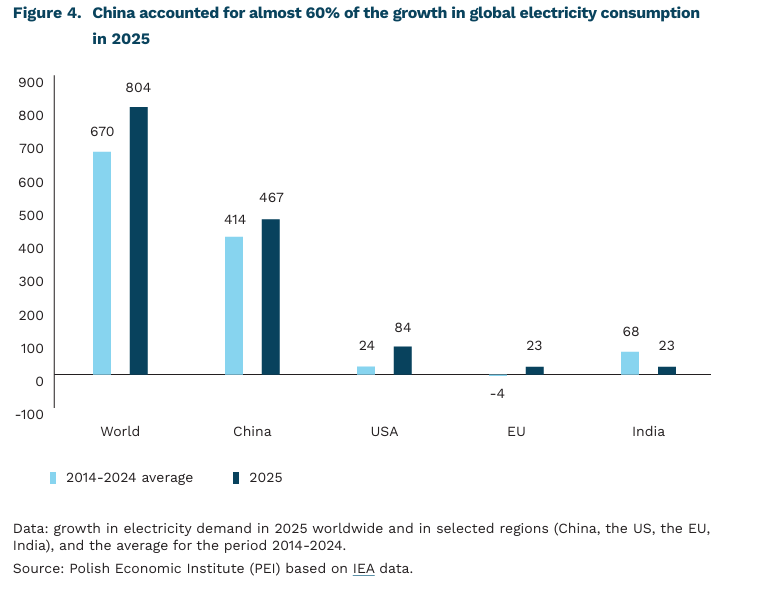
In 2025, global electricity demand increased by around 800 TWh. In comparison, this is 4.8 times more than was consumed in Poland last year. Global demand increased during this period by an amount equal to the total increase in electricity generation from solar and wind sources at that time. This illustrates the scale of the challenge of decarbonising energy systems – low-carbon sources must not only replace existing conventional sources, but also meet the demand from new uses of electricity.
The rapid growth in global electricity demand has led to more experts talking about the world entering the “age of electricity”. Currently, growth is driven by two distinct factors. On the one hand, it stems from providing new populations with access to electricity and improving their standard of living (e.g. through the use of more household appliances) or the industrialisation of developing economies. On the other hand, there is more advanced electrification in developed countries in the building sector (the use of heat pumps and air conditioners), industry, transport (electric vehicles) and through the development of data centres for artificial intelligence. At the same time, in developed countries, improving appliance efficiency is reducing electricity consumption in existing applications.
Global electricity demand grew more than twice as fast in 2025 (3% year-on-year) than energy demand as a whole (1.3% year-on-year). Around 80% of the growth in electricity demand was recorded in emerging and developing economies (EMDE). China dominates this group (accounting for 58% of global consumption growth), with its appetite for electricity growing thanks to ongoing economic development and an increasing number of electric vehicles on the roads. Among the major economies, consumption is also rising significantly in the US – data centres accounted for as much as half of its growth in 2025.
The fastest annual growth in electricity demand – apart from electric mobility – is seen in data centres. In 2025, it stood at 17% year-on-year (70 TWh), bringing their global electricity demand to 485 TWh. The International Energy Agency (IEA) estimates that by 2030, this figure could almost double, reaching 945 TWh[2]. This would correspond to an increase in the share of data centres in global electricity consumption from 1.5% in 2025 to 3% cent in 2030. The impact of data centres on large power systems may be significant due to the fact that they are built in clusters[3] and have a flat electricity consumption profile, which may result in a greater load on the local power grid and an increase in peak power demand across the entire system. According to a new analysis, increasing the operational flexibility of data centres (by partially adapting to the current energy situation within the system) could yield tangible benefits, including the potential to reduce the need to build new on-demand power stations.
2. The figure refers to the base scenario (Base). In the other scenarios, the figures are as follows: 833 TWh (Headwinds), 868 TWh (High Efficiency) and 1008 TWh (Lift-off).
3. The idea is to have a larger number of them located close together within a given area.
Wojciech Żelisko
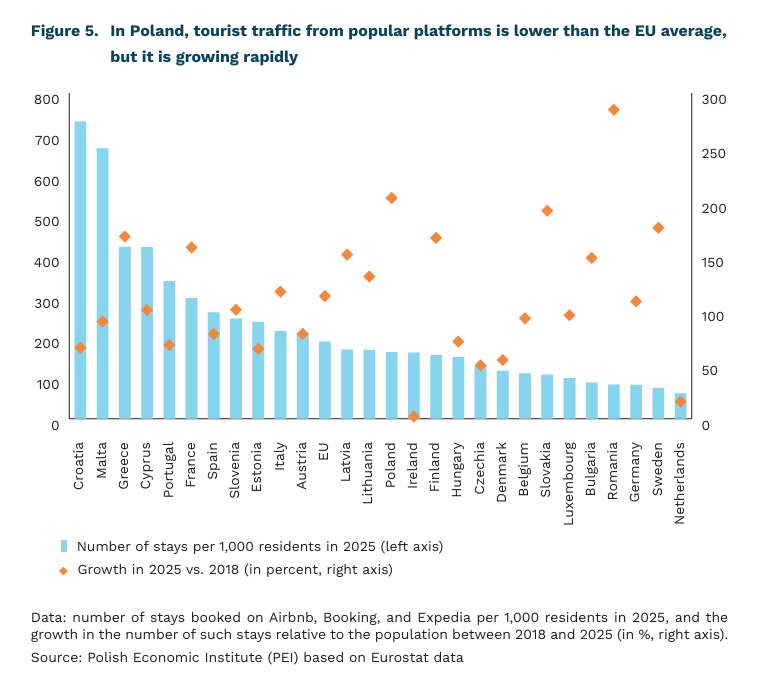
The popularity of accommodation booking platforms is growing in Poland
163 stays per 1,000 residents – that was the rate of bookings made through online platforms (Airbnb, Booking, Expedia) in Poland in 2025
the number of stays per 1,000 people in Poland increased by 203% between 2018 and 2025
Nationwide, the number of properties rented through popular short-term rental platforms in Poland remains lower than the EU average. In 2025, there were 163 stays booked on Airbnb, Booking, or Expedia per 1,000 residents in Poland. This ranks 14th in the EU, with the EU average standing at 190 stays. Leading the way in this regard are popular tourist destinations: Croatia (730 stays per 1,000 residents), Malta (665 stays), and Greece (423 stays). In Spain and Portugal – countries where there is particularly much discussion about the burden of short-term rentals – this figure stood at 261 and 388 stays, respectively. It is important to note that this figure is an average for the country. This means that locally, particularly in popular tourist cities, it will be significantly higher.
Although tourist traffic from popular platforms was lower than the EU average, Poland ranked second in the EU between 2018 and 2025 in terms of the growth in the number of such stays relative to its population. According to Eurostat data, the increase in the number of stays booked on Airbnb, Booking, or Expedia per 1,000 residents amounted to 203% over the seven-year period analyzed. Only Romania saw a higher growth rate (285%). Next in the EU were Slovakia (192%) and Sweden (176%). Across the EU, the number of stays increased by 113% during the period under review.
Short-term rentals in cities where they already account for a large portion of the housing stock have a negative impact on the housing situation. A classic example is Barcelona, where – as Garcia-López et al. point out – in neighborhoods with the highest concentration of short-term rental units, rental (long-term) and sales prices rose by 7% and 17%, respectively, between 2012 and 2016. In turn, a study on Stockholm shows that, during the 2012-2016 period, each short-term rental listing was associated with the removal of an average of 0.15 permanently occupied apartments. At the same time, it is noted that shortterm rentals in the aforementioned Barcelona and the associated tourist traffic generated 1.9 trillion euros in 2023 alone and helped sustain 40,000 jobs.
The European Commission intends to address the issue of short-term residential rentals in areas facing housing shortages in the near future. To this end, Regulation 2024/1028 on the collection and sharing of data on short-term residential rental services will enter into force in May of this year. Landlords will be required, among other things, to register their properties and obtain an identification number, which must be included in rental listings. In Poland the work is currently underway to regulate the short-term rental market.
In Spain, following the introduction of new regulations on short-term rentals, the supply of such properties has dropped significantly. In April 2025, regulations came into effect in Spain requiring, among other things, the registration of apartments intended for shortterm rental. As a result, in the first few months after the new law took effect, over 65,000 short-term rental listings that did not comply with the new regulations were withdrawn. According to data from Spain’s National Institute of Statistics, the number of apartments available for short-term rental in the country fell by 12% year-over-year in the same year (this refers to the change between November 2025 and November 2024).
Jędrzej Lubasiński
The European Commission has selected the winners of the tender for sovereign cloud service providers
EUR 180 million will be the maximum value of public contracts for a sovereign cloud under the EC tender that has now been awarded
85% of the EU cloud market is currently controlled by U.S. providers
2% of the EU cloud market is accounted for by the largest European provider
The European Commission has taken another step toward reducing its dependence on the United States for access to cloud computing services. The Commission’s announcement of the results of a public tender worth up to €180 million for the provision of sovereign cloud services has identified four European providers. Over the next six years, EU institutions will be able to call on the winners to provide cloud services that meet digital sovereignty requirements.
To win the contract, bidders had to meet the guidelines set out in the Sovereign Cloud Framework published last year by the European Commission, at least at the SEAL-2 level. The EU framework defines requirements for providers on a five-level SEAL[4] scale and assesses the sovereignty of their services across eight dimensions of dependency. The minimum level of supplier sovereignty permitted in this tender means being subject to EU regulations and the ability to enforce them, while maintaining material dependencies on entities outside the EU is permissible.
Among the tender winners, one entity is somewhat controversial – Proximus, whose partner is the Franco-American joint venture S3NS, in which Google is involved. The application of SEAL requirements was intended to limit cloud dependency on entities from third countries. However, S3NS is also certified with SecNumCloud 3.2, which it received in 2025; this is the highest possible cloud security standard in France, making the company the first and so far only provider with non-EU participation to have received this rigorous certification level. The French certification ensures access to sensitive data in the local market, such as contracts with public administration, healthcare, or the defense sector. The certification, however, imposes a number of requirements and restrictions, including a complete ban on Google employees accessing S3NS systems. Google’s capital presence has not gone unnoticed by the European Commission – Proximus is the only selected provider to have received SEAL-2 certification, while the remaining three received Level 3 ratings, indicating significant control by European entities.
The EU cloud computing market has been dominated by American providers for years. According to 2024 estimates, American companies account for as much as 85% of the EU cloud computing market, with the three largest providers, the so-called hyperscalers (Google, Microsoft, Amazon), controlling 65% of the market on their own. The largest European cloud providers, Deutsche Telekom and SAP, each control only about 2% of the EU market.
While European entities managed to meet the technical and legal requirements of the tender, setting the bar at the SEAL-2 level and the tender decision itself are also signs of pragmatism – admitting an entity with a minority stake held by Google, despite all the imposed restrictions, ensures access to external technology while maintaining as much control as possible by the EU. The European Commission’s next step toward increasing digital sovereignty is to be the Tech Sovereignty package, which, among other things, aims to harmonize regulations on cloud sovereignty and artificial intelligence within the European Union. From a Polish perspective, the new EU framework could be crucial – compared to France, Poland currently lacks cloud certification that is similarly focused on provider sovereignty.
4. SEAL (Sovereignty Effectiveness Assurance Level) is the level of sovereignty assurance that a provider must meet in order to participate in a public tender for the provision of sovereign cloud services to EU entities.
Jakub Witczak
Low awareness of the need and possibilities for saving among Poles
23% of Poles assess their financial knowledge as very low or rather low
7% recognise the need to increase their knowledge about saving
The latest study on the level of financial literacy, conducted by the GPW Foundation and the Warsaw Institute of Banking, shows that in recent years there has been a significant increase in the proportion of respondents assessing their knowledge as average: 47% compared with 37% in 2025 and 34% in 2024. The share of “average” knowledge has grown at the expense of both those rating their knowledge as low or very low (23% vs 33% in the previous year) and those rating it as high or very high (22% vs 30% in 2025).
In addition to subjective self-assessment, objective knowledge was also tested. The questions covered, among other things, taxation and investing, with respondents able to score between 0 and 4 points in each category.
Categories relating to tax and pension systems performed relatively well (both averaging 2.3 points). Weaker results were observed in categories related to different types of investment (investing – 2.1 points; knowledge of shares and investment funds – 1.6 points).
The surveyed group also demonstrates a relatively low level of familiarity with specific pension investment instruments. The least recognised were IKZE and PPE, with 24% and 23% of respondents respectively having never heard of these forms of capital accumulation. PPK and IKE are more widely known, though 16% and 14% of respondents respectively have not heard of them. The remaining respondents declare that they have heard of these instruments but do not possess detailed knowledge (between 48% and 53%, depending on the instrument).
The lack of familiarity with more advanced financial instruments, such as ETFs or futures contracts (only 13% of respondents have heard of them and know what they are), is not surprising. More concerning is the low awareness of solutions that ensure financial security in old age, as well as the relatively low – and significantly lower than in previous years – percentage of responses indicating that people should save regularly or at least from time to time for a “rainy day” (32% in 2026 compared with 59% in 2025 and 61% in 2024).
The most common sources of knowledge are family and friends (38%) and the internet (34%). The youngest respondents (aged 18-24) are most likely to rely on family knowledge. While placing trust in advice from close circles is understandable, in the case of low levels of economic knowledge within that circle it may lead to the repetition of behaviours that are not necessarily rational or appropriate.
In light of the above findings, which point to gaps in knowledge regarding safeguarding savings, it is surprising that only 7% of respondents identify saving as an area in which they feel a lack of knowledge. These data suggest that existing forms of informing citizens about the need and opportunities to build savings for future needs are insufficient or unconvincing.
Well-designed educational programmes achieve success not only in developed countries with a strong culture of financial education, such as the Netherlands, but also in developing countries, such as Brazil. Programmes that provide young people with knowledge about saving or the functioning of pension systems can lead to better financial management and greater awareness of the consequences of financial decisions.
Maksymilian Pyrkowski