
Economic Weekly 27/2026, July 10, 2026
Published: 10/07/2026
Table of contents
The increase in the number of foreign residents will not mitigate the depopulation of municipalities
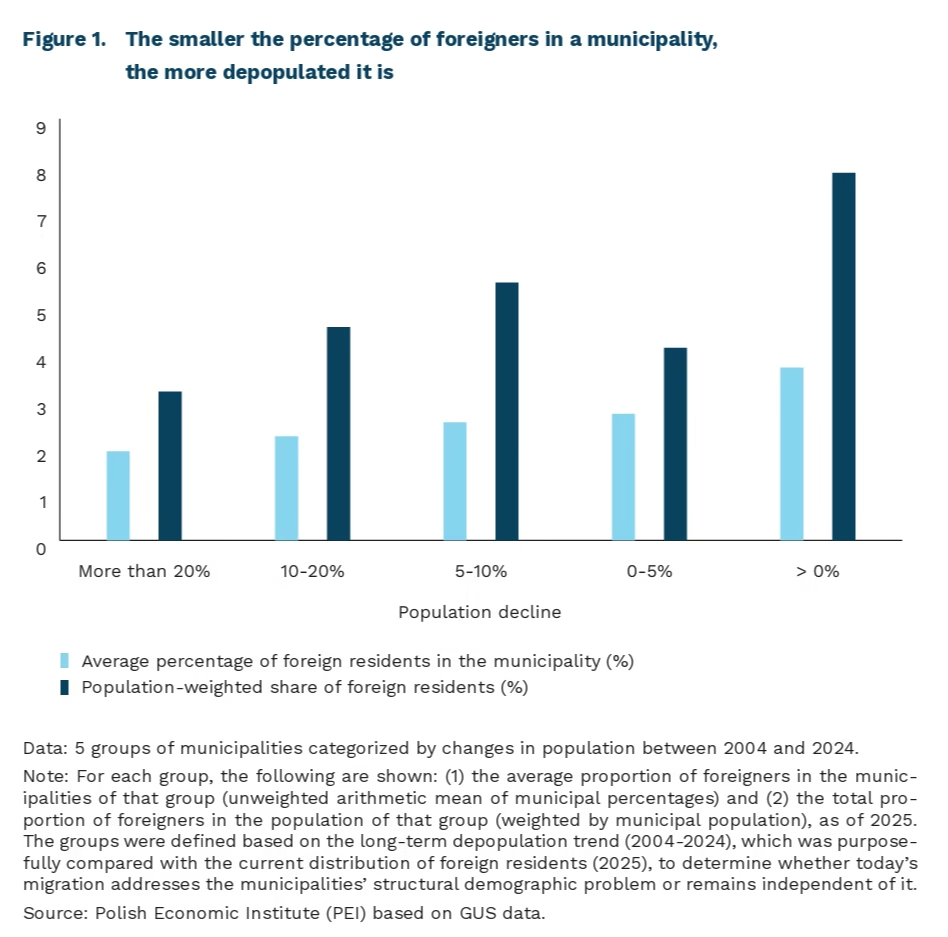
1.9% is the average share of foreigners in the population of shrinking municipalities
3.7% is the average share of foreigners in the population of municipalities experiencing population growth
by 215,000 people, the number of foreigners increased in 2025 compared to the previous year
As of the end of 2025, according to a new, experimental study by the Central Statistical Office (GUS) based on so-called “life traces”, i.e. activity recorded in at least two administrative registers, there were 38.8 million people residing in Poland. This increase is almost entirely due to foreign nationals, whose number rose by 215,000 to reach 2.3 million. Of these, 73% are Ukrainian citizens.
The new data show that foreign nationals are concentrated primarily in regional cities and their functional areas rather than in municipalities severely affected by depopulation. In municipalities that have lost more than 20% of their residents over the past two decades, foreign nationals account for an average of 1.9% of the population. In growing municipalities, however, their share is more than twice as high.
This mechanism is consistent with the logic of labour migration: migrants primarily follow labour market trends, which tend to be weaker in areas where the population is declining fastest. This has also been confirmed by earlier analyses of the flow of Ukrainian war refugees to Poland, conducted at the IRWiR PAN. The spatial distribution of this phenomenon reveals a higher proportion of foreigners in the west of the country, which is linked to the long-established presence of a Ukrainian diaspora. Where a migrant community already exists, the cost and risk of migration for new arrivals are lower.
Although migrants usually choose areas with a stronger economy, there are examples showing that well-managed local policies can alter this pattern to some extent. One such example is Närpiö in Finland – a small agricultural municipality in the south of the country that was experiencing depopulation and is known for its greenhouse farming. As early as the late 1980s, the local authorities decided to actively welcome migrants in order to maintain the region’s vitality and secure a workforce for horticulture and greenhouse operations. As a result, Närpiö now has the highest quality of life of all the rural municipalities that were surveyed and are located outside the influence of cities. The long-term population decline has finally halted and, in recent years, has turned into a slight increase, although it is still far from the levels seen decades ago. This example shows that under favourable conditions, a deliberately implemented migration policy can be part of a strategy for controlled, smart shrinkage – provided the municipality recognises its economic advantage early enough and creates conditions that encourage new residents to settle there permanently.
In Poland, there are also municipalities that are depopulating but which attract foreigners thanks to their economic specialisation. The first type consists of municipalities that benefit from the presence of a major employer or specialised industry. Międzyrzec Podlaski (lubeskie province), despite being far from the western diaspora, has 11% foreign residents, despite a population decline of 12%. Thanks to its location on the east-west corridor and several large industrial plants (in the food and machinery sectors), migrants can find stable employment there.
The second type consists of tourist municipalities where migration primarily responds to seasonal labour demand. Despite a population decline of 8.5% over the past twenty years, Międzyzdroje has as many as 20% foreign residents. Similar patterns can be seen in Dziwnów, Mielno and Hel, the latter of which ranks among Poland’s seven municipalities with the fastest depopulation rates. While such migration helps the local economy, it does not necessarily translate into a lasting improvement in the demographic situation. Seasonal workers meet the current needs of the labour market, but are, by definition, less likely to commit to their place of employment in the long term. Unlike the permanent resident segment, even a well-designed migration policy cannot recreate the factors that made Närpiö a success, such as attracting families, creating conditions for them to settle permanently and integrating them into the local community.
An analysis of new data from the Central Statistical Office (GUS) shows that the mere presence of foreigners will not therefore be a universal remedy for shrinking local communities. This is because migration follows the pattern of economic opportunities rather than depopulation. However, migration can strengthen local development where there is clear economic specialisation and a long-term strategy for attracting and integrating new residents. Without such foundations, an attempt to attract and integrate new residents will be unsuccessful.
Agata Mróz
The final phase-out of Russian gas imports to the EU is an opportunity for Poland
99% of Poland’s natural gas exports were destined for Ukraine in 2025
115% increase in LNG imports to Poland between 2021 and 2025 (from 41 TWh to 88 TWh)
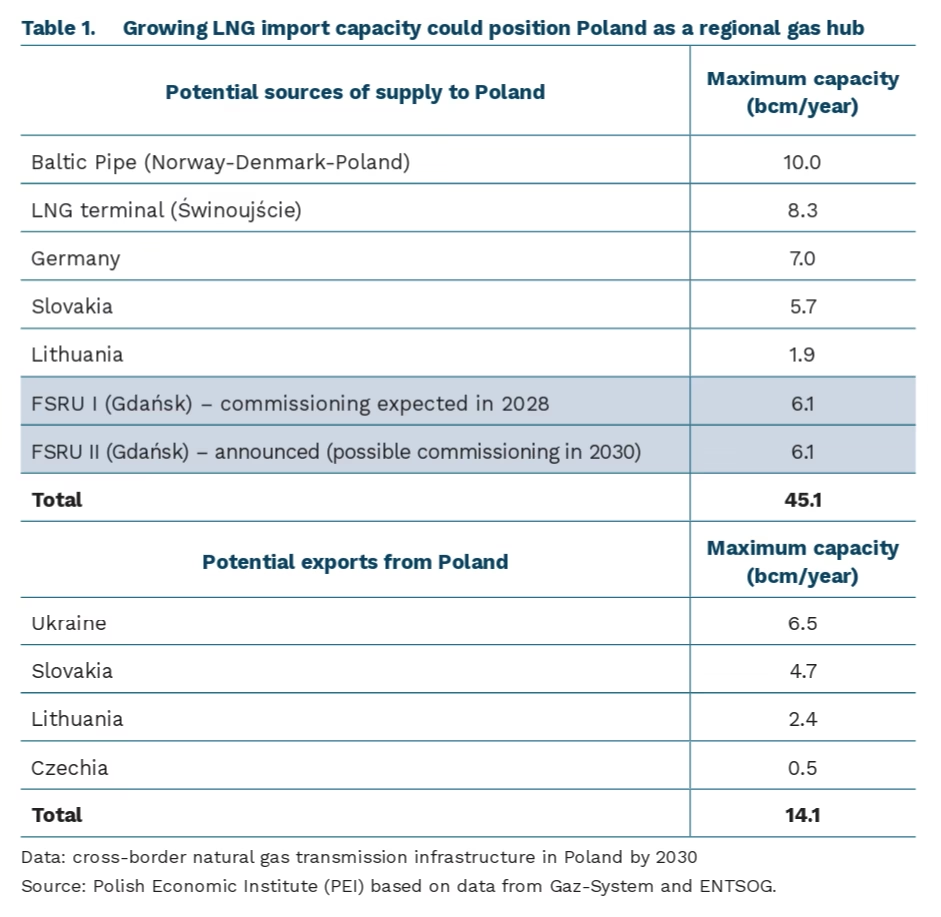
In June 2026, it was announced that a second Floating Storage Regasification Unit facility would be built in the Gulf of Gdańsk. This means that by 2030 Poland could have three LNG (Liquefied Natural Gas) import terminals with a combined regasification capacity of more than 20 bcm of natural gas per year. The Świnoujście LNG Terminal has been in operation since 2016, while the first FSRU terminal in Gdańsk is currently under construction and is expected to become operational in 2028.
The expansion of Poland’s LNG import infrastructure, initiated with the investment in the Świnoujście terminal, was primarily driven by the need to strengthen the country’s energy security through the diversification of gas import sources and, consequently, to eliminate dependence on Russian gas supplies. Between 2021 and 2025, Poland’s LNG imports more than doubled (from 41 TWh to 88 TWh), mainly as a result of the cessation of Russian natural gas imports via the Yamal pipeline. Another key infrastructure investment of the past decade was the Baltic Pipe, commissioned in 2022, which enables natural gas imports from Norway to Denmark and Poland. Poland’s existing technical natural gas import capacity currently amounts to 32.9 bcm per year, which is 63% higher than the country’s natural gas consumption in 2025.
The construction of another FSRU terminal in Gdańsk, with a planned regasification capacity of up to 6.1 bcm per year, will significantly strengthen Poland’s position as a regional gas hub. Although Poland launched cross-border gas interconnectors with Slovakia and Lithuania in 2022, Ukraine has so far remained the country’s key – and almost exclusive – gas export destination. In 2025, Gaz-System recorded a historic high in gas exports through the Polish transmission system: annual cross-border gas flows reached 2 bcm, of which 99% was exported to Ukraine. By contrast, the interconnections with Slovakia and Lithuania have so far seen only minimal utilization. Slovakia remains dependent on Russian gas imports via the TurkStream pipeline, while Lithuania operates its own LNG terminal.
Poland’s importance as a gas transit country is likely to increase in the coming years. This will be driven both by EU legislation requiring the complete phase-out of Russian gas imports by the end of 2027 and by sustained natural gas demand across Central and Eastern Europe, where countries will need to secure alternative sources of supply. Under these conditions, Poland’s LNG infrastructure and cross-border interconnections could significantly enhance its role as a regional gas hub and as a principal corridor for natural gas supplies to countries across the region.
Marianna Sobkiewicz
Global startup capital is shifting toward AI-native and defense technologies
funding for AI-based startups increased by 218% between 2021 and 2025
Poland ranks 33rd in the world in terms of startup ecosystem development
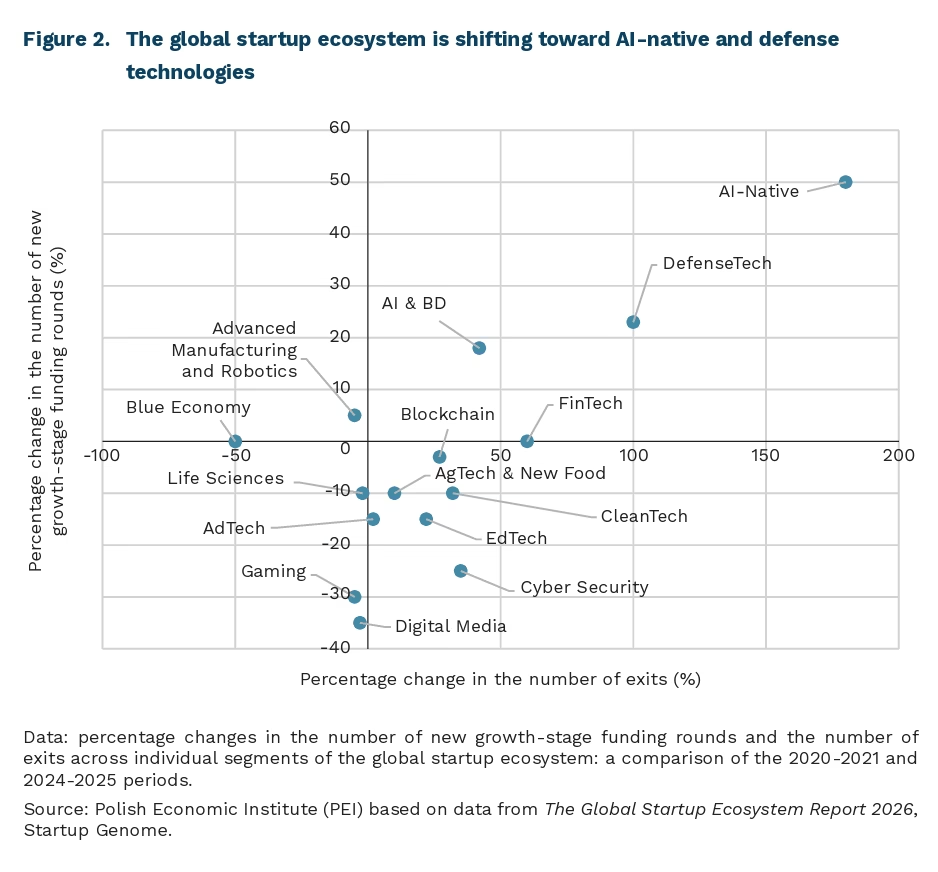
Capital in the global startup ecosystem is increasingly concentrated in the areas of AI-native technologies and defense technologies. This is evidenced by trends in the number of funding rounds for startups in the scaling phase and in investment exits.
Total funding for AI-native startups increased by 218% between 2021 and 2025, while funding for technology companies decreased by 36% over the same period. Data from The Global Startup Ecosystem Report 2026 shows how individual segments of the global startup ecosystem transition from the growth (scaling) phase to the maturity phase, as measured by the number of exits (sales, IPOs). Based on the number of funding rounds and the number of exits, the global startup ecosystem can be divided into three groups of five: growth leaders, emerging sectors, and sectors in a slowdown phase. The first group of the fastest-growing sectors attracting capital includes AI-native, defense technology, and fintech. In addition to these, startups in the AI and big data, and cybersecurity segments are also among the current main beneficiaries of global capital flows.
The second group consists of startups that maintain steady investor interest during the early-stage development phase and secure new funding; however, the increase in investment activity does not translate into an increase in the number of exits. In the sectors analyzed, the number of exits has declined slightly, which may indicate, for example, a lengthening of these startups’ development cycles. This applies to the following segments: blockchain, cleantech, educational technologies (EdTech), advertising technologies (AdTech), and agricultural technologies (AgTech&New Food).
The third group includes startups that are losing investment momentum, which may indicate a decline in investor interest or a prolonged commercialization process. This primarily applies to the digital media, the gaming industry, and blue economy, as well as, to a lesser extent, biotechnology (life sciences), advanced manufacturing, and robotics.
Poland ranks 33rd in the world in terms of startup ecosystem development (based on the 2026 Global Startup Ecosystem Index), and the changes taking place are similar to global trends – particularly with regard to the growing role of AI. This is confirmed by data from the Dealroom database – the Polish startup ecosystem is in a transitional phase of transformation, AI does not dominate in terms of volume (among the available topic tags in startup descriptions, approximately 10% related to AI), but it is rewarded with higher funding (AI companies receive, on average, about twice as much funding as others). As a result, a growing concentration of funding in the AI sector can be observed, suggesting a shift in investor preferences and an increase in the importance of AI-based technologies within the structure of the Polish startup ecosystem.
Magdalena Lesiak
ETFs are becoming a permanent fixture in central bank portfolios
around EUR 2.7 trillion was the value of assets in the European ETF market at the end of May 2026
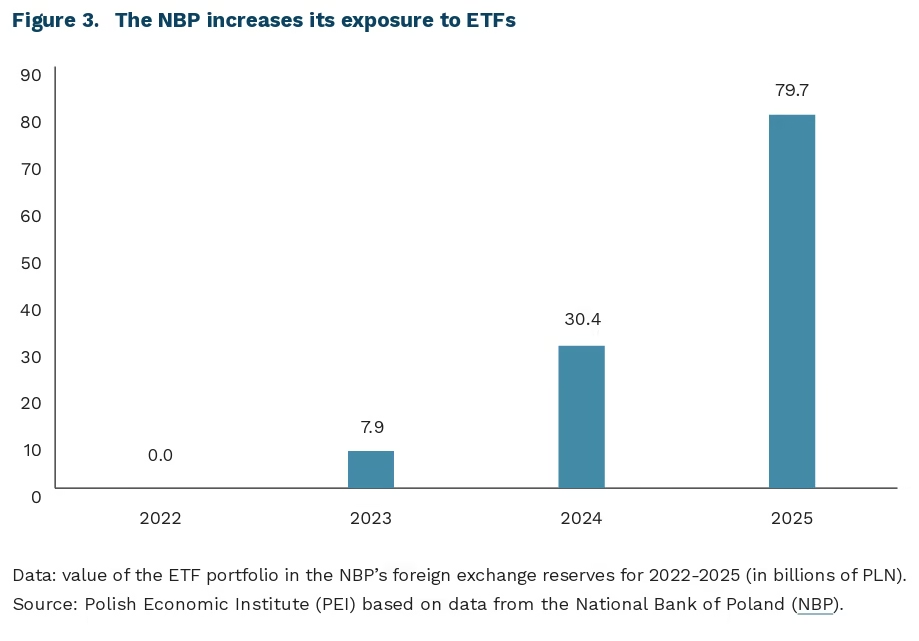
PLN 79.7 billion was the value of the NBP’s ETF portfolio at the end of 2025, ten times more than in 2023
The European ETF market is expanding at a record pace. At the end of May 2026, it comprised 2,625 funds with total assets of EUR 2.7 trillion. Passive products accounted for 97% of the market, while equity funds represented 76% of total assets. Inflows into European ETFs reached a record EUR 326 billion in 2025. According to Bloomberg Intelligence, global assets held in these funds could rise to around USD 35 trillion by 2035, which would imply continued double-digit growth over the next decade. The increasing size of the market, high liquidity and the ability to obtain broad passive exposure mean that ETFs are now used not only by retail investors and investment funds, but also by central banks.
Central banks use ETFs for purposes ranging from reserve diversification to market-stabilising interventions. The Czech National Bank lists exchange-traded funds among its reserve management instruments, while the Bank of Korea invests part of its assets in corporate bond ETFs, although neither institution discloses the value of these positions separately. The Bank of Japan has built the largest portfolio, having purchased equity ETFs since 2010 as an instrument of monetary policy. In September 2025, the holdings had a book value of JPY 37 trillion, or around EUR 200 billion, and selling them at the planned pace of JPY 330 billion per year would take more than a century. The ECB and the Federal Reserve remain considerably more cautious. The ECB allocated 3% of its own investment portfolio, worth EUR 23.1 billion at the end of 2025, to equity ETFs aligned with its climate objectives. The Fed used corporate bond ETFs only during the pandemic and had sold the entire portfolio by August 2021.
ETFs have become an important component of the NBP’s foreign exchange reserves over the past two years. The Bank first reported them in 2023, when the portfolio was worth PLN 7.9 billion. At that time, it included equity funds tracking indices in the United States, the euro area, the United Kingdom, Canada and Australia, including the S&P 500, EURO STOXX 50 and FTSE 100. ETFs themselves were new to the portfolio, but the NBP’s exposure to equity markets was not. As early as 2022, the Bank invested in these markets through equity index futures. The introduction of ETFs therefore broadened the way in which the NBP built its equity exposure: alongside derivatives, it began holding units in index funds, while reducing its positions and trading activity in futures contracts.
At the end of 2025, ETFs accounted for 7.4% of the NBP’s total assets and almost 12% of its core foreign investment assets. Their value rose to PLN 79.7 billion. Since 2025, the Bank has invested not only in ETFs tracking equity indices, but also in funds replicating indices of US investment-grade corporate bonds, while withdrawing from direct investments in this market. Dividend income from ETFs increased from PLN 11.9 million in 2023 to nearly PLN 1.4 billion in 2025, while the sale of fund units generated PLN 2.77 billion in realised gains. Cumulative positive valuation gains reached PLN 10.7 billion. Higher returns have, however, been accompanied by greater volatility, with the annual standard deviation of returns on the equity portion of the portfolio amounting to PLN 9.1 billion. ETFs are therefore beginning to have a material impact on both the NBP’s financial result and its risk profile.
ETFs are attractive to central banks because they provide rapid access to broad and diversified exposure without requiring the selection and management of hundreds of individual securities. Their passive structure, transparency and the high liquidity of the largest funds also facilitate portfolio rebalancing and reduce the operational costs of reserve management.
Sebastian Sajnóg
Less communication, more action? Central banks’ Forward Guidance policies are changing
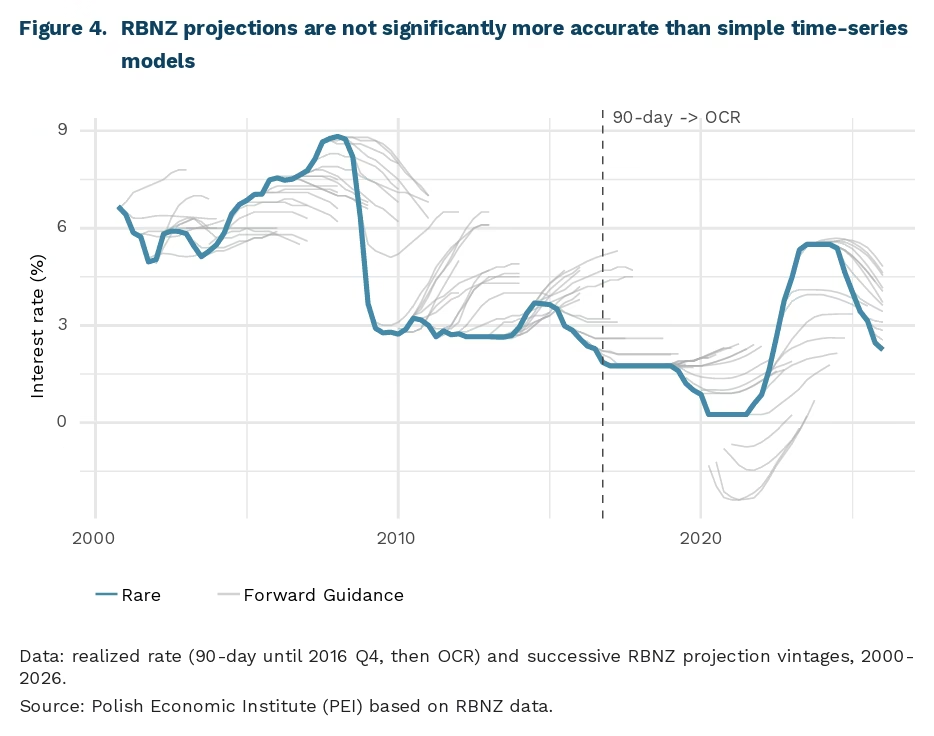
5,83 percentage points is the largest single error made by the Reserve Bank of New Zealand (RBNZ) in forecasting interest rates (forecast from January 2008, horizon – 7 quarters)
0,1 percentage points -> 1,75 percentage points is the mean absolute error of the RBNZ rate forecast (depending on the time horizon – from the current quarter to 2 years)
The importance of Forward Guidance (FG) in central banking actions has diminished since the pandemic. FG is a policy of communicating future interest rate decisions [1]. Credible communication about future moves can influence current behavior, thereby helping to control inflation and economic conditions without actual interest rate changes (Eggertsson, Woodford, 2003). The pioneer of this policy was the Reserve Bank of New Zealand (RBNZ), which in 1997 began publishing non-binding forecasts of its future decisions. Today, however, the role of FG seems to be declining, and the new Fed Chair – Kevin Warsh – was the first to refuse to publish his economic forecasts.
The effectiveness of Forward Guidance is debatable. On one hand, a number of papers suggest that FG policy has a significant impact on markets and economic activity (e.g., Campbell et al., 2012; Woodford, 2012; Del Negro et al., 2015). In an extreme interpretation, it could practically entirely replace interest rate decisions, as pointed out by, among others, former Governor of the Bank of England Mervyn King and former Chairman of the Board of Governors of the Federal Reserve System Ben S. Bernanke. On the other hand, central banks often backtracked on their communication and broke promises – particularly during periods of high uncertainty when FG should have been most effective (e.g., Lagarde in 2020, the EBC in July 2022, the Fed in 2022, the EBC in October 2022). Financial markets, in turn, bet on decisions contrary to the central bank’s communication, actively acting against the bank’s FG (e.g., Schnabel, 2022).
The Reserve Bank of New Zealand’s Forward Guidance did not provide significant advantages in forecasting interest rates. Our comparison of the effectiveness of official RBNZ forecasts against the simplest time series models using Diebold-Mariano tests shows that RBNZ forecasts were directionally correct and slightly more effective, but this difference was practically never statistically significant. The RBNZ forecast error was relatively small over a horizon of a few quarters, whereas interest rate forecasts for 2-3 years out differed on average by as much as 2-3 percentage points from actual data. Therefore, their value for shaping expectations regarding future rate levels is debatable.
The choice of Kevin Warsh as Fed Chair aligns with the trend of scaling back FG. Warsh is a proponent of a strategic review of unconventional monetary policy instruments – including limiting Forward Guidance as well as quantitative easing. A similar aversion to FG was also demonstrated by US Treasury Secretary and Warsh’s former mentor, Scott Bessent. He suggested that during his financial career, the most famous FG tool was used primarily as an “anti-indicator” of future decisions. The IMF Chief Economist and Christopher Waller of the Fed, among others, have also advocated for reducing the role of FG in favor of greater flexibility in interest rate decisions.
In practice, this means shifting the focus toward a much broader communication of the so-called reaction function – that is, less binding disclosure regarding the general stance and the conditions under which interest rate changes can be expected. Warsh’s decisions do not appear to be a revolution, but rather part of a larger trend. In fact, the European Central Bank opted for a similar move more than three years ago, when it began communicating that „[its] decisions will be data-dependent and made on a meeting-by-meeting basis”. It thus blazed a trail for limiting central bank communication with the market, including for the new Fed Chair.
- Formally, two types of Forward Guidance policy are distinguished: Odyssean (the central bank commits itself to fulfilling the communication) and Delphic (a non-binding forecast of its future decisions). The general communication of the reaction function (i.e., conditional forecasts; how strongly and quickly the bank will react to a hypothetical rise in inflation, and how it will react to a GDP recession) can also be considered a specific type of Forward Guidance policy.
Marcin Klucznik, Adam Witek
The Swedish forerunner of Polish Personal Investment accounts (OKI) substantially boosted household participation in capital markets
4.2 million Swedes hold ISK accounts (the Swedish equivalent of Polish OKI accounts)
51% of Swedish household savings are invested in stocks
On 4 July, the Sejm passed the Personal Investment Accounts (OKI) Act, establishing a new savings and investment vehicle scheduled to launch on 1 January 2027. Its key feature is a tax exemption for assets held in the account, provided they do not exceed PLN 100,000 for investment assets (e.g. stocks) and PLN 25,000 for savings assets (e.g. bank deposits). In these cases, the capital gains tax will not apply. Assets exceeding these thresholds will instead be subject to a new tax [2] based on the value of the assets, rather than on the capital gains earned.
The new instrument is intended to support the development of Poland’s capital market by encouraging households to shift their savings from cash and bank deposits into stocks and investment funds. A comparable reform introduced by the Swedish government in 2012 – the Investment Savings Account (Investeringssparkonto, ISK) – successfully achieved this objective.
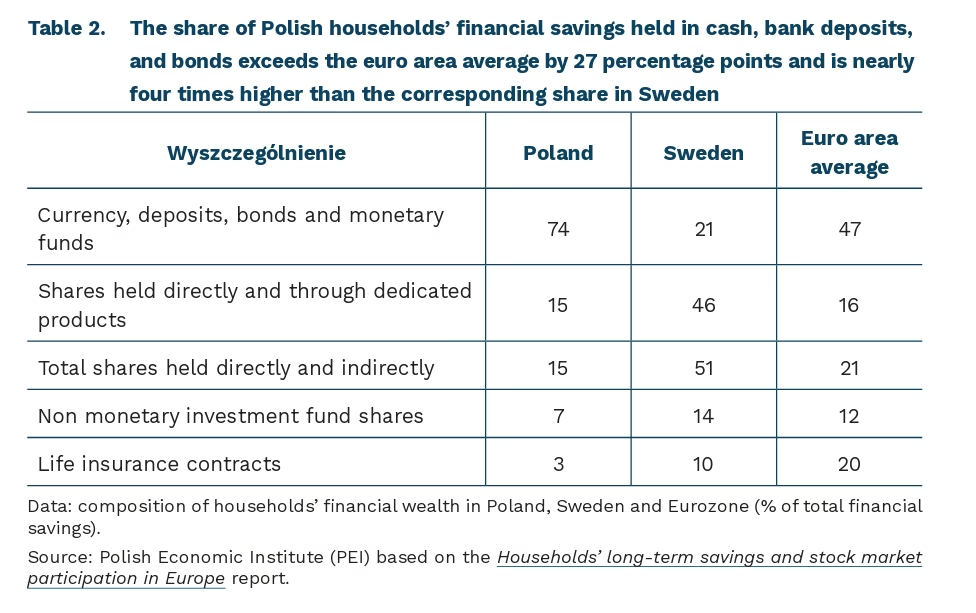
Thanks to the ISK, Sweden now has one of the highest rates of stock market participation in the world. Investing in equities is now widely regarded as part of Swedish culture. Swedish households hold more than half of their financial savings in stocks – roughly twice the average share in the euro area (Table 2). As of 2025, approximately 40% of Swedes held an ISK account.
The authors of the OECD report explain that Swedish households’ high level of participation in the capital market is the result of a long-term government strategy pursued over several decades. However, they identify the Investment Savings Account (ISK) as one of the most successful measures in this area because it combined tax incentives with simplified administrative procedures and lower barriers to entry (in Sweden, children can also hold ISK accounts). The high level of digitalization of public services, together with the development of digital investment platforms, has also played an important role by making the investment process even more accessible.
The report also argues that the increase in Swedish households’ participation in the capital market has been supported by the country’s high level of financial literacy and awareness, noting that Sweden ranks 9th in the OECD/INFE financial literacy ranking. It is worth noting, however, that Poland ranks even higher – 3rd overall. At the same time, Poland scored lower than Sweden in the financial attitudes component of the assessment (57 versus 67 points), reflecting important cultural differences in approaches to personal financial management.
Sweden’s experience also shows that the widespread adoption of ISK accounts was driven by extensive public information and financial education campaigns involving government institutions, banks, and non-governmental organizations (NGOs). These campaigns proved particularly effective because they built on a society in which financial education programs had already been developed and promoted for more than a decade.
Conducting a comprehensive financial education and public information campaign therefore appears to be essential for promoting the widespread adoption of Personal Investment Accounts (OKI) in Poland. Although studies indicate that Poles possess a relatively good level of general financial and economic knowledge, their low participation in the capital market – with 74% of household financial savings held in cash, bank deposits, and bonds – suggests limited knowledge of, and willingness to engage in, less conservative forms of wealth accumulation. Initiatives led by institutions such as the National Network for Financial Education and youth non-governmental organizations can provide valuable examples of good practice. However, communication efforts should also address barriers that are specific to Poland, including low trust in public institutions and weak saving habits. An additional communication challenge will be to clearly explain how Personal Investment Accounts (OKI) differ from existing savings and investment vehicles (IKE, IKZE, and PPK), as well as to whom they are intended to appeal. Tax incentives alone are therefore unlikely to be sufficient.
2. The rate of the new tax will be set at 19% of the National Bank of Poland’s (NBP) reference rate in effect on 31 October of the year preceding the tax year, with a minimum rate of 0.1%. At the current NBP reference rate of 3.75% per annum, the tax on asset value would amount to: 3.75% x 19% = 0.71% per year.
Agnieszka Wincewicz-Price, Karolina Malinowska
Polish companies recognise the value of employee training
44% of companies declare investments in employee skills development
31% of companies declare they can effectively attract and retain talent
63% of construction companies reported problems with staff shortages
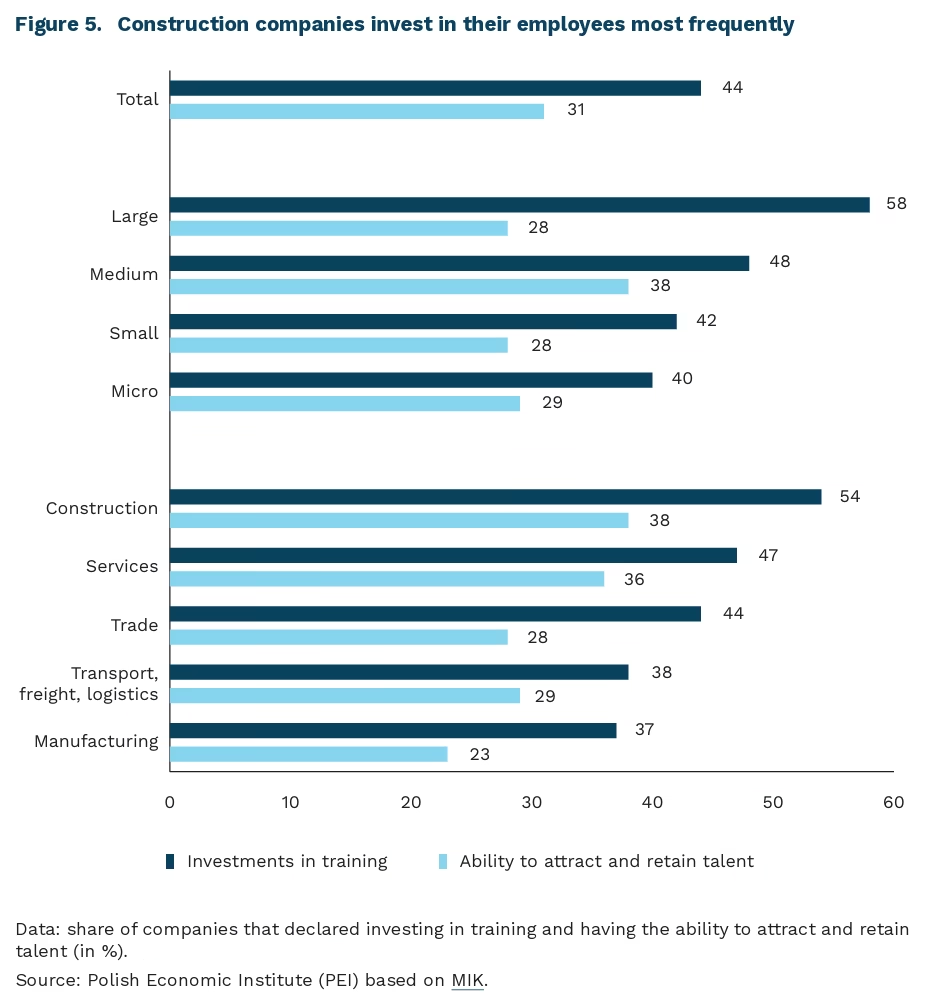
As many as 44% of companies invest in employee skills development – this follows from the MIK (Monthly Business Climate Index) survey conducted in early June 2026. Large companies are significantly more likely to undertake such initiatives (58%), whilst micro-enterprises are the least likely to do so (40%). The sector that places the greatest emphasis on training is construction (54%). By contrast, the manufacturing sector (37%) and transport, freight and logistics sector (38%) are the least likely to invest in human capital.
Slightly more than 3 in 10 companies declare that they can effectively attract and retain talent, according to MIK’s June survey. Interestingly, in this case medium-sized companies rate their employee retention abilities higher than large companies do (38% vs. 28%). As with investment in training, attracting and retaining employees is also most frequently declared by construction and services companies, and least frequently by manufacturing companies. In the case of construction companies, the higher-than-average share of entities investing in human capital and able to retain employees may stem from the fact that, due to a shortage of specialists in the market, companies are forced to train their own staff in order to fill skills gaps and maintain their market position. This is also confirmed by MIK research, in which construction companies most frequently of all sectors report problems related to worker unavailability (in June, as many as 63% of construction companies raised this complaint).
Problems with attracting and retaining qualified workers are also confirmed by a PEI survey from December 2025. More than half of business owners reported difficulties in recruiting staff with the right skills. Consequently, half of companies declared having incurred expenditure on employee skills development, and more than 60% had such plans for 2026. At the same time, it is worth noting that companies do not invest in human capital as often as they declare – possibly deterred by high costs. Rising labour costs were among the most frequently cited barriers to business activity in both the MIK survey and the survey of 1,000 companies.
Employee training is currently one of the conditions for attracting and retaining valuable workers. Employees stay longer at companies that invest in their development. Companies that place strong emphasis on human capital development have 57% higher retention and 23% higher internal mobility than companies with a weak learning culture. At the same time, since providing employees with opportunities for professional development fosters their loyalty to the company, employee engagement also grows in such organisations. This translates into increased productivity, which in turn improves company profitability. Unfortunately, not all Polish companies apply a strategic approach to workforce development based on a comprehensive approach to employee growth. Some employers, despite recognising the importance of current trends, do not plan to invest in skills development. Possible reasons for insufficient investment in human capital, despite awareness of the scale of the problem, may include: reluctance to bear the costs, a lack of good data on employees’ existing competencies, and an inability to measure the return on training. At the same time, companies do not always find it easy to source good trainers in niche, emerging fields such as AI. Some companies may also be considering workforce reductions as they scale up their use of new technologies.
Anna Szymańska
