
Economic Weekly 32/2026, August 14, 2026
Published: 14/08/2026
Table of contents
In most occupations in Poland, wage differences across counties are small or moderate
37.5% of employees in Poland work in occupations with low local wage variability
51.5% of employees in Poland work in occupations with moderate local wage variability
11% of employees in Poland work in occupations with high or very high local wage variability
Employment prospects are increasingly shaped by where people live. In its latest labour market report, the OECD estimated that employment rates across regions in OECD countries can differ by more than 20 percentage points, while regional unemployment rates in the weakest regions can be more than twice as high as in the best-performing ones. This shows that the labour market is not homogeneous. The same education and similar skills can translate into very different chances of finding work, depending on the local economic structure.
These disparities do not stem only from the characteristics of a region’s residents, but largely from the opportunities offered by the place itself. Some of the differences are explained by age structure, education and household characteristics, but the local labour market is crucial, especially the concentration of well-paid jobs in high value-added services in the largest urban centres. Worker mobility reduces these inequalities only to a limited extent, because people from weaker regions often have to migrate far, and those who leave are often more skilled than those who stay, which may further widen the gap.
Since place of residence and the local economic environment have such a strong effect on employment chances, it is worth examining how they translate into wages in particular occupations. In most occupations in Poland, wage variability at county level is low or moderate [1]. In 28 occupations out of 213 [2] with low wage variability, more than 37% of employees work, including sales workers, warehouse workers, hairdressers, cooks, drivers, administrative and office workers, cleaners, nurses and teachers. More than half of all employees in Poland (51.5%) work in 101 occupations with moderate wage variability. These include managers, doctors, specialists in administration, business and finance, but also electricians and energy workers, mechanics and machine operators, construction workers, and manual workers in manufacturing and elementary occupations.
The highest wage variability is found in specialist and niche occupations. High wage variability at county level applies to a relatively large group of occupations (68), but only 10.5% of employees work in them. These include specialists in various fields, programmers and IT workers, engineers, creative-sector employees, researchers and university teachers, and insurance agents. Very high wage variability applies to only 16 occupations, employing 0.5% of workers. These include artists, people working in entertainment and sport, as well as air traffic services personnel, philologists, translators and mining engineers.
In the ten occupations employing the largest number of people in Poland, which account for 34% of employment, wage variability across counties is low or moderate. In these occupations, the coefficient of variation ranges from 4% to 18%. This means that in the most common professions, wages are relatively even across territories, and workplace location matters less for pay than in more specialised occupations.
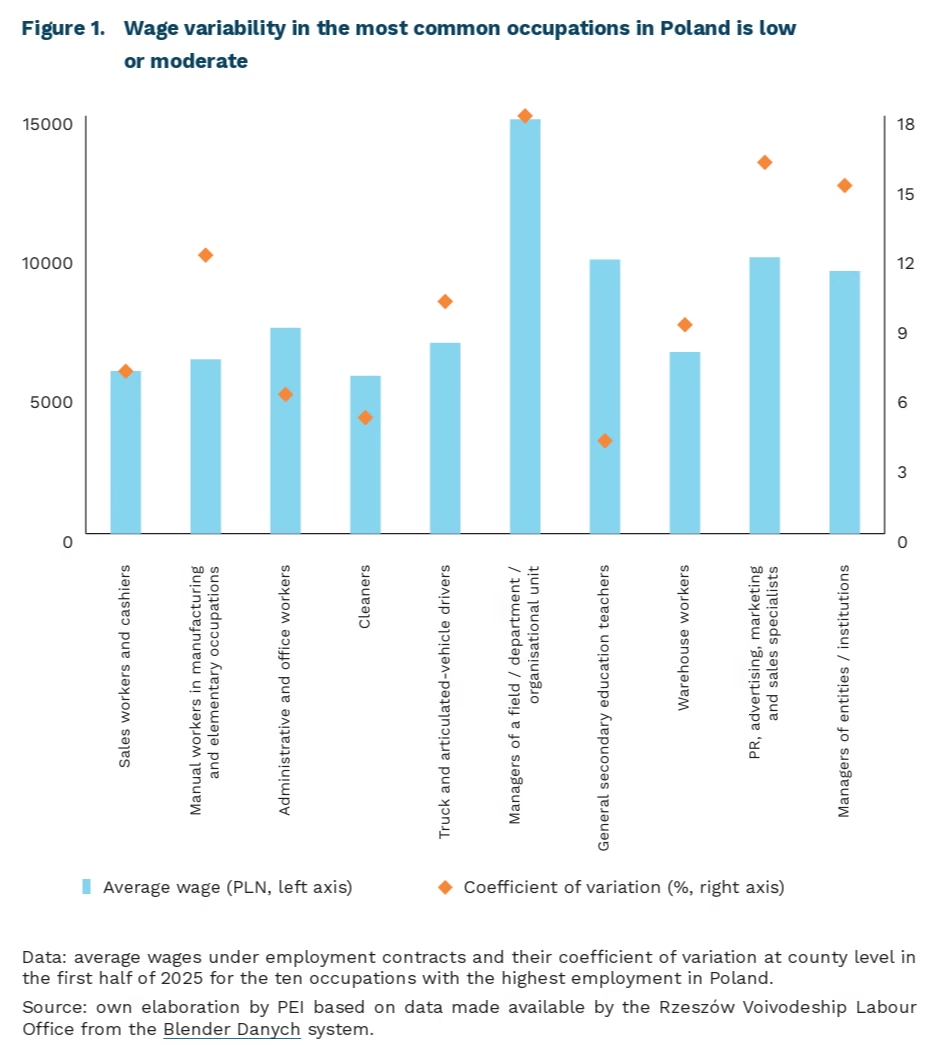
- Wage variability was calculated on the basis of data on average monthly gross wages from employment contracts in the first half of 2025, broken down by occupation and county. The coefficient of variation, defined as the ratio of the standard deviation to the arithmetic mean and expressed as a percentage, was used as the measure of dispersion. The higher the coefficient, the greater the variation in wages across counties within a given occupation. Four levels of variability were adopted: low (coefficient of variation of 0-9.99%), moderate (10-24.99%), high (25-44.99%) and very high (above 45%). In the case of niche occupations, the coefficient should be interpreted with caution, as individual observations and a small number of workers may have a strong impact on the result.
- The classification was prepared for the purposes of the Blender Danych system. It was created by aggregating occupations from the Polish Classification of Occupations and Specializations (KZiS) and is consistent with the list of occupations used in the nationwide Barometr Zawodów survey.
Cezary Przybył
Growing number of companies are adopting AI, but enthusiasm for the technology remains moderate
28.7% of the companies surveyed by PEI across five industries used AI
45% of the service companies surveyed by PEI use AI
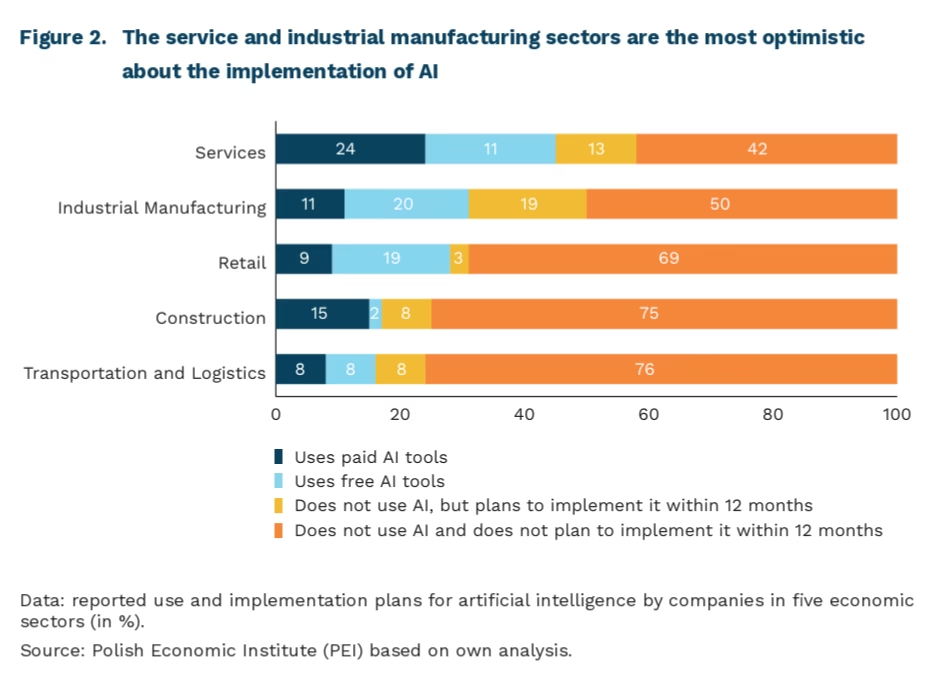
As many as 28.7% of the companies surveyed by PEI report using artificial intelligence (AI), according to August data collected for the Monthly Business Climate Index (MIK) [3]. The highest adoption rates were reported by companies in the services sector, 45% of which have implemented AI, with another 13% planning to do so within the next 12 months. Optimism regarding this group of technologies is also visible in industrial manufacturing, where 31% of surveyed companies use AI, and 19% have plans to adopt it.
Both PEI data and the results of new studies by PARP and the NBP suggest that there has been an acceleration in AI implementation among Polish companies – this is particularly evident when compared to last year’s Statistics Poland (GUS) survey, in which only 8.7% of companies reported using AI. At the same time, the data points to future slow growth in this indicator rather than rapid expansion. In the PEI survey, companies more often emphasize their intention to maintain the current level of AI implementation rather than to expand the scope of AI-supported operations or invest in new paid tools. It is also worth noting that – contrary to media reports – the data do not show that AI adoption is contributing to job cuts in companies.
At the same time, nearly two-thirds of the companies surveyed by PEI do not use AI and do not plan to implement it in the coming year. PARP’s data also shows a significant group of companies – just over one-third of those surveyed – that do not see the potential for AI implementation. A survey by the NBP, which used a slightly different wording for the question, points to a group of companies that have not analyzed the possibilities of using AI or do not see a use for it (44%) – which, however, given the significant media hype, can be seen as an indication that a significant group of companies is not interested in this set of technologies.
Another significant challenge remains the lack of comparability among publicly available data, a point we have already highlighted in a previous issue of the Economic Weekly. In the data described above, some of the discrepancies between the readings are explained by differences among the samples (such as the selected economic sectors or the size of the analyzed companies), while the lack of consistent methods for measuring AI adoption in the business sector limits the ability to compare AI adoption data primarily to the annual publication by the GUS.
The picture that emerges from the above data is not an AI “boom” – despite what is likely a significant increase in adoption compared to the latest GUS reading – but rather a phase of continued experimentation with new tools. We are observing uneven and still limited adoption of the technology, as well as a group of companies that remains cautious, skeptical, or simply uninterested.
3. The survey covers 500 micro, small, medium, and large enterprises across five economic sectors (services, industrial manufacturing, retail, construction, and transportation and logistics) and is conducted on a monthly basis.
Nearly 900,000 heat pumps have been installed in Polish households
20 billion cubic metres less gas is used by European Countries every year thanks to the growing number of heat pumps
855,000 heat pumps had been installed in Polish households by mid-2026
1/5 of the heat pumps sold in 2025 were covered by subsidies under the “Czyste Powietrze” (“Clean Air”) and “Moje Ciepło” (“My Heat”) programs
In 2025, the use of heat pumps saved 25 billion cubic metres (bcm) of gas in China (35% of gas consumption for building heating), 20 bcm in Europe (10%) [4], and 6 bcm in Japan (35%). According to the International Energy Agency (IEA), heat pumps covered 5% of global heat demand and 12% of space heating demand in 2024. Total global manufacturing capacity reached around 145 GW per year in 2024, led by China (about 35%), followed by the United States (25%) and the European Union (20%).
According to the European Heat Pump Association (EHPA), 2.9 million heat pumps [5] were sold in 2025 for household use across 21 European countries [6], a 13% increase compared to 2024. A total of around 30 million units are now in operation in these countries, translating into savings of roughly USD 10 billion yearly on fossil fuels (led by natural gas).
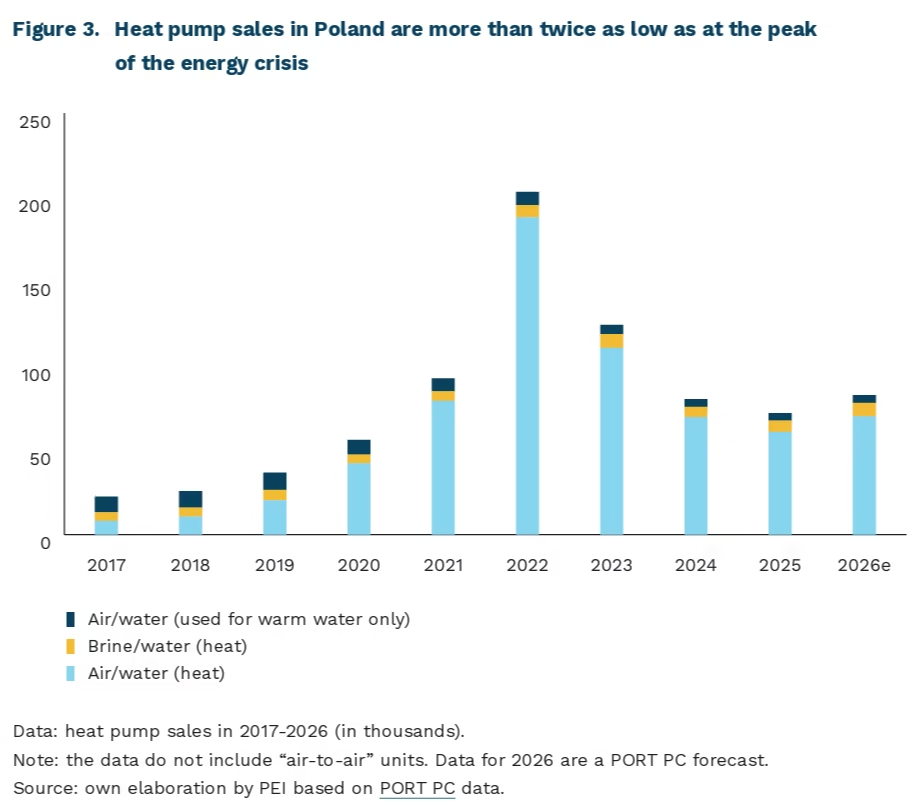
In Poland, 72,000 heat pumps were sold in 2025 (a decline from 2024), though forecasts for 2026 point to a possible rebound as 38,000 units were sold in the first half of this year, and PORT PC (Polish Organisation for the Development of Heat Pump Technology) estimates a possible full-year result of 83,000–85,000. At the same time, most heat pumps sold are not covered by subsidies – of the 72,000 units sold in 2025, only 18,000 were purchased with support from the “Moje Ciepło” (“My Heat”) and “Czyste Powietrze” (“Clean Air”) programs. This is largely the result of changes to the design of the Clean Air program which were intented to oppose abuse – such as the requirement for every application to be backed by a mandatory energy audit, and the program’s temporary suspension in October 2024 (not resumed until 31 March 2025). This transitional period thus led some consumers to decide to buy without subsidies.
According to EHPA, a total of 745,000 residential heat pumps were in operation in Poland in 2024. After factoring in sales data through mid-2026 [7], that figure now stands at around 855,000 units. The current pace of installation growth in Poland may therefore be too slow to meet the targets set out in the more ambitious version of the National Energy and Climate Plan (NECP). Under the With Additional Measures (WAM) scenario, the projected number of heat pumps in residential buildings is expected to reach 1.6 million in 2030 and 3.3 million in 2040. Given the current growth rate of installed units, the With Existing Measures (WEM) scenario appears more realistic, under which the number of individual heat pumps is projected to reach around 1.16 million in 2030 and 2.6 million in 2040. [8], [9].
4. According to EHPA, savings on this account in Poland amounted to 0.7 bcm in 2024.
5. EHPA data for some countries also include air-to-air heat pumps (around 40% of total sales). For Poland, PORT PC data do not include this type of unit. 6. 2025 data for AT, BE, CH, CZ, DE, DK, ES, FI, FR, IT, LT, NL, NO, PL, PT, SE, and the UK, plus estimates based on 2024 data for IE, HU, and EE.
7. PEI’s own estimates based on EHPA and PORT PC data.
8. Scenario assumptions available in Annex 3 to the NECP, Table 2.27.
9. It should be noted that the values forecast in the NECP annex are not official targets — they are merely forecasting assumptions.
Adam Juszczak
Interest among Poles in running their own business is falling
7.3% of Poles aged 18-69 ran their own business or agricultural enterprise in 2025
480,000 sole proprietorships (JDGs) were registered in Poland in 2025
22 JDGs registrations per 1,000 working-age residents were recorded in 2025
In 2025, 7.3% of Poles aged 18-69 were running their own business or agricultural activity, compared with 14.1% in 2021-2022, according to the latest edition of the Human Capital Study (BKL). The scale of the decline should be interpreted with caution, as the way the question was phrased was changed in the latest edition of the BKL. The data on career plans provide a clearer picture. In 2025, nearly 21% of jobseekers were considering setting up a business, whereas in 2017 the figure was 32%, and in 2021-2022 it stood at 26%. The proportion therefore fell by nearly 11 percentage points over eight years. Possible reasons for the declining share of people considering starting a business include the rising minimum wage, the tax burden and economic uncertainty caused by crises (the pandemic, the full-scale war in Ukraine).
In 2025, nearly 480,000 sole proprietorships were registered, according to CEIDG data. This means that for every 1,000 Polish residents of working age, 22 applications for business registration were submitted, compared with 20 in 2019. The difference between the number of registrations and applications to terminate a business was 13 per 1,000 working-age residents – the same as in 2019. This means that, in terms of the number of businesses being set up and wound up, the situation remains at pre-pandemic levels. It should be borne in mind that businesses terminated in 2025 may have been registered in previous years; therefore, this result does not show the survival rate of newly established businesses.
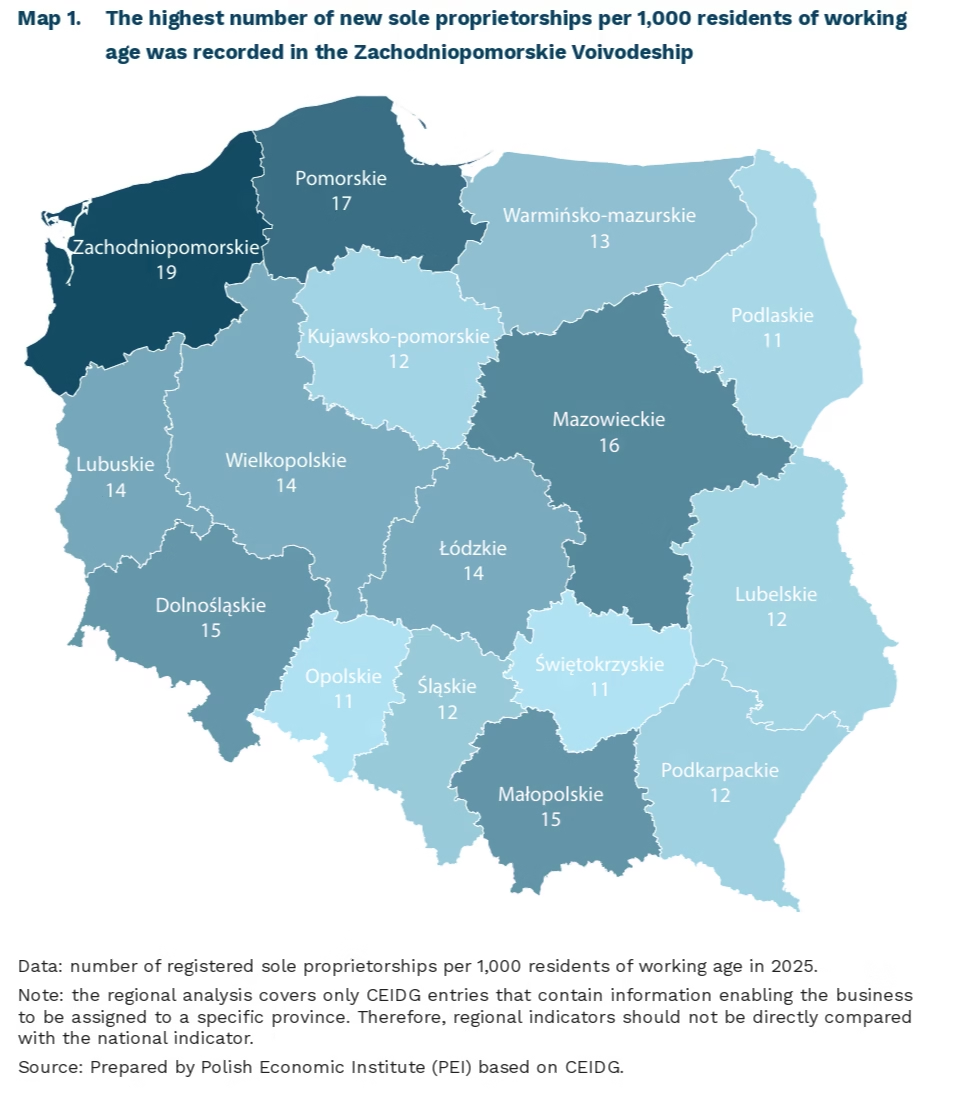
In 2025, the highest numbers of new sole proprietorships per 1,000 working-age residents were registered in Zachodniopomorskie (19), Pomorskie (17) and Mazowieckie (16) voivodeships [10]. These same regions led the way in 2019, recording 22, 20 and 18 registrations respectively. The lowest values in 2025 were recorded in Opolskie, Podlaskie and Świętokrzyskie voivodeships, at 11 each. The largest difference between the number of registrations and applications to terminate a business was recorded in Pomorskie and Zachodniopomorskie, at 10 per 1,000 working-age residents in each, while the lowest values were recorded in Kujawsko-Pomorskie, Podlaskie and Świętokrzyskie (at 5 each). Compared with 2019, the value of the indicator decreased in all provinces, with the largest decline – by 4 – recorded in the Lubuskie, Wielkopolskie and Zachodniopomorskie provinces. Context for these results is provided by the Global Entrepreneurship Monitor survey: among people who discontinued a business in 2024, 35% cited a lack of profitability, and 28% cited political, regulatory and tax conditions. In Europe, an average of 10% of respondents cited the latter reason.
The decline in interest in running one’s own business is accompanied by a relatively high number of newly registered businesses. This is not necessarily a contradiction. Some companies operate for only a short time, are suspended or closed down. Conversely, some sole proprietorships are established when employees move from employment contracts to B2B arrangements, sometimes at the request of their employer. Such a change may be intended to reduce employment costs, while for some people accepting this form of cooperation may be a condition for remaining in the labour market. All these cases are treated as economic activity, even though they do not always involve the development of an independent business, and the available data do not allow the scale of dependent self-employment to be determined. Decisions to establish, suspend or terminate a business may have been influenced by changes introduced in recent years, including changes to the rules for calculating and deducting health insurance contributions, and the increase in the minimum wage, which has an impact on the costs of employing staff and the level of preferential contributions for entrepreneurs. The effects of these changes were not the same for everyone – they depended, amongst other things, on the sector, income level and form of taxation. Entrepreneurship in Poland is becoming more volatile and more difficult to assess unequivocally.
10. Not all applications specified the province in which the business is carried out.
Aleksandra Wejt-Knyżewska
The European Innovation Ranking primarily reflects differences in the wealth of EU countries
23rd out of 27 Poland’s position in the latest European Innovation Scoreboard
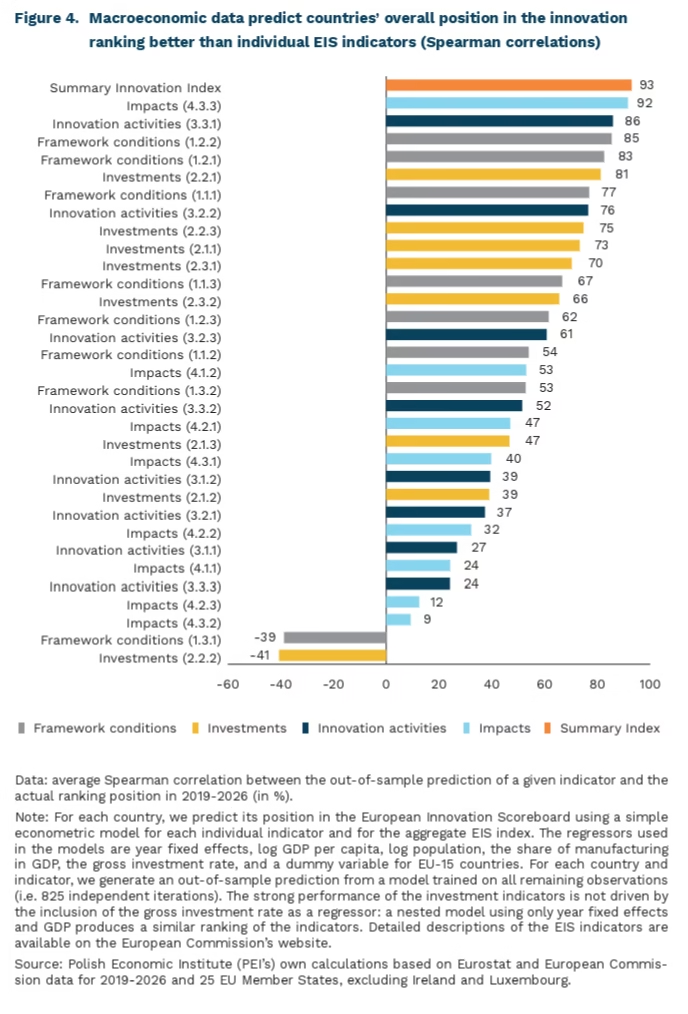
93% the accuracy with which a country’s EIS ranking score can be predicted using, among other factors, GDP
Poland is consistently classified as an “Emerging Innovator” in the European Innovation Scoreboard (EIS). In the latest EIS edition, Poland ranked 23rd out of 27 EU Member States. Its score was equivalent to 65% of the EU average. Using 32 indicators grouped into four pillars – framework conditions, investments, activities and impacts – the EIS aims to assess the innovation performance of EU Member States, both relative to the EU average each year and in terms of changes over time.
Innovation indices such as the EIS are strongly correlated with a country’s level of development. To illustrate the scale of this relationship, PEI estimated countries’ positions in the EIS ranking, as well as their scores on all EIS indicators, using econometric models. The models relied exclusively on readily available macroeconomic statistics (GDP per capita, population, the share of manufacturing, the gross investment rate, and a 0-1 dummy for “old” EU Member States) and included no variables directly measuring innovation. Despite this, the models reproduce countries’ ranking positions with near-perfect accuracy and explain 93% of the variation across countries’ relative positions. A country’s EIS position is therefore largely a function of its level of development.
Poland’s position in the EIS ranking says little about changes in its innovation performance. Hard data point to systematic improvement. For example, between 2019 and 2025, Poland’s GDP per capita increased from 74% to 81% of the EU average. Over the same period, Poland’s absolute EIS score increased by 16.3 points, i.e. 40.6% faster than the EU average.
The positions of individual EIS indicators are, however, more difficult to replicate. This may be due to two effects:
- First, individual innovation indicators may contain substantial statistical noise. At the aggregate index level, this noise is averaged out, producing a more stable measure of innovation performance that, naturally, must also reflect information about GDP.
- Second, not all EIS indicators may have a strong link to economic outcomes. Examples include emissions (a public policy objective), high-tech goods imports (a measure of integration into global trade), expenditure on innovation other than R&D (which is difficult to measure), and design-related patents (which have a weak link to innovation and technology).
The construction of indices such as the EIS warrants further discussion. In its current form, the aggregate index has limited informational value, as it almost entirely replicates information on a country’s GDP, which is easier and faster to obtain. At the same time, the individual indicators include both variables that are strongly related to innovation performance (and therefore closely linked to GDP) and public policy objectives with no direct link to economic outcomes or innovation (e.g. public spending on innovation and technology imports).
It would therefore be advisable to narrow the scope of indices such as the EIS – either to measuring the long-term potential to generate innovation or to evaluating specific, sectoral public policies. In the first case, this would mean an index focused on the scientific sector and the commercialization of research. In the second, it would mean focusing on narrower areas, but measuring them more precisely (e.g. digitalization, green technologies or robotics).
Marcin Karolak
Europe has a problem financing innovative companies
more than 50% of investments by VC funds based in the EU went to companies outside the EU between 2015 and 2025
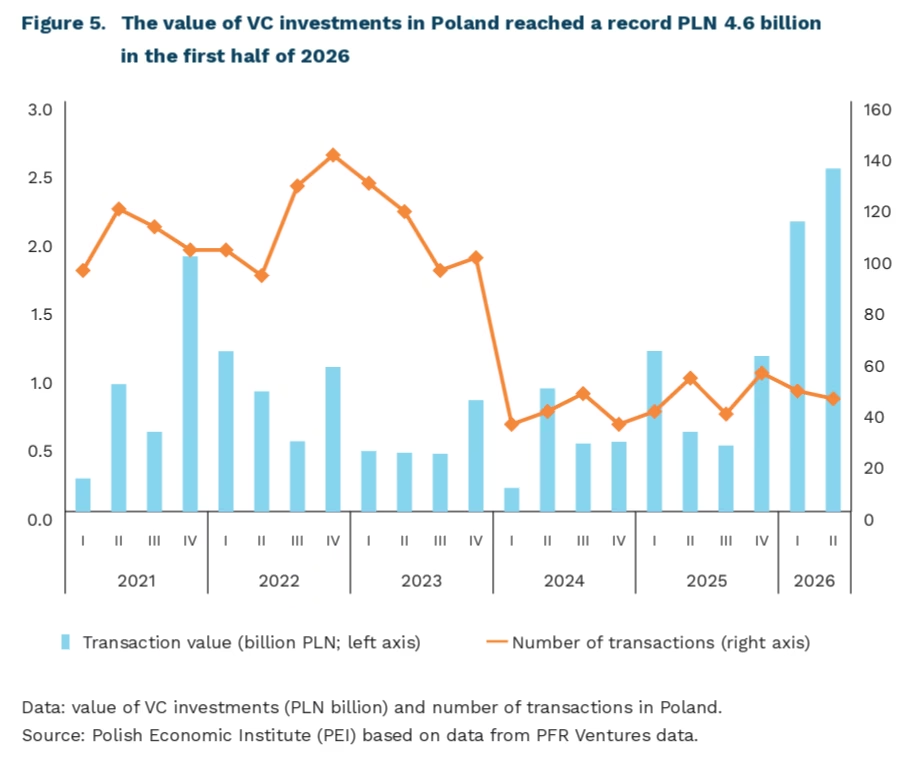
PLN 4.6 billion was the value of financing in Poland’s domestic VC market in the first half of 2026
Europe has a problem financing innovative companies once they begin competing for global scale. According to the latest analysis by the ECB, US Venture Capital (VC) funds collectively manage around EUR 930 billion, compared with approximately EUR 150 billion managed by funds based in the European Union. The difference is more than sixfold, and the gap widens in successive funding rounds as companies’ capital needs increase. At the same time, between 2015 and 2025, more than 50% of investments by EU-based VC funds went to companies outside the Union, while US funds invested only around 20% of their capital outside the United States. A company may therefore be established on the strength of Europe’s scientific and research base, while its capital is provided by a US investor, and its subsequent IPO or sale may also take place outside the EU.
Recent examples from Poland show how difficult it is to attribute the success of a technology company to a single country. In the first half of 2026, Poland’s domestic VC market reached a record PLN 4.6 billion in financing, more than in the whole of 2021, which had previously been the record year. However, around PLN 3.7 billion, or more than 80% of the total, was accounted for by just two transactions: ElevenLabs and ICEYE. At the same time, the founders, research teams, legal headquarters and investors of such companies are associated with different countries – in these cases, the United States and Finland, respectively.
The source of Europe’s problem is not only the smaller scale of the European market, but also the structure of savings and the investor base. In the United States, pension funds, foundations and other large institutions play a much greater role in financing VC funds. These institutions can commit capital for many years and accept high levels of risk. In Europe, their role is considerably smaller, and the resulting gap is more often filled by public institutions. In 2023, pension funds in the EU accounted for around 5% of the capital raised by European VC funds, compared with more than 50% in the United States. The ECB also points out that European companies that failed to secure VC financing are, on average, larger and grow faster than comparable US companies. This in turn suggests that the problem facing some European firms may not be a lack of potential, but rather more difficult access to the capital needed for further growth.
Not everyone agrees, however, that Europe’s main problem is simply a shortage of VC funding. Economists Luis Garicano and Per Strömberg point to Sweden, which does not have an exceptionally large domestic pool of VC capital, yet ranks among Europe’s leaders in terms of the number of unicorns. In their view, the earlier stage of ecosystem development is crucial – specifically, its ability to consistently create companies that eventually become attractive to VC funds. The Swedish model is based, among other things, on a mechanism whereby founders and employees of successful technology companies, following exits, themselves become investors or mentors and finance the next generation of start-ups. From this perspective, Europe may face two bottlenecks at the same time: an insufficiently effective mechanism for creating new companies in some countries, and too little capital to scale the best of them.
Therefore, Europe’s challenge is not only to increase the supply of capital at the scaling stage, but also to create conditions in which the earlier successes of entrepreneurs and investors can support subsequent generations of companies. Only by combining these two elements can Europe become more effective at financing the continued development of innovative enterprises.
Piotr Kamiński
A higher share of local content strengthens the local social fabric
from 40% to 70% increase in the share of Norwegian oil-sector companies with international sales increased between 1995 and 2005
20% the weighting given to the social value criterion in public tenders introduced as part of the public procurement reform in Greater Manchester
Local content has the potential to be one of the most significant elements of industrial policy. It strengthens resilience to external crises, reduces dependence on international supply chains, and helps retain capital within the country. As we wrote in the May PEI report, between 2021 and 2024, foreign companies accounted for 7.7% of domestic public procurement contracts in the Polish public procurement market. Measures aimed at increasing the share of domestic content – understood as maximizing the participation of Polish companies in government procurement – are aligned with the strategy announced this year by the Ministry of State Assets and represent an important and long-awaited step forward in Poland’s approach to industrial policy. In its current form, however, this approach largely reduces local content to hard, quantifiable financial indicators and procurement volumes. It is worth noting, however, that in countries with more extensive experience in this area, local content is understood more broadly – as a multidimensional tool for building inclusive institutions that, alongside providing a direct boost to GDP, foster the long-term social and educational development of regions.
An example is the Norwegian model of energy-sector governance, under which the government incorporated investments in education and innovation into its local content requirements. A key element of the so-called “Norwegian Model” was involving foreign corporations in building local capabilities by supporting domestic suppliers and engaging national research and educational institutions. This approach shifted the focus from simple market protection towards building full international competitiveness. The international attractiveness of the industry built in this way is reflected in the fact that, between 1995 and 2005, the share of Norwegian companies with international sales increased from 40% to 70%, accompanied by significant geographical diversification. A clear division of responsibilities between government administration and commercial entities contributed to reducing corruption and market monopolization while strengthening institutional stability. This strategy demonstrates that systemic local content requirements can lay the foundations for developing human capital and a domestic technological base.
The value of a broad approach to local content is also demonstrated by the UK experience, particularly in the context of Andy Burnham’s plans for nationwide decentralization of public procurement, rewarding contractors that invest in local employment and education, and introducing local content requirements at the national level. Following the systemic success in Greater Manchester, where, as mayor, he decentralized public procurement and increased the weighting of the social value criterion in tenders to 20%, Burnham is proposing to extend these solutions to the national level. Public procurement designed along these lines provides a direct boost to local employment, retains capital within the region, and strengthens social cohesion. His programme envisages decentralizing industrial policy, retaining the majority of tax revenues directly in the regions, and rewarding contractors that invest in the local workforce. This strategy is reinforced by the latest UK government guidelines, which require public procurement spending to directly support local employment and vocational training in every region of the country, giving the younger generation genuine opportunities to enter employment or education – earn or learn.
The next step, following the implementation of basic local content requirements in Polish public procurement, could be to gradually require investors to establish programmes that combine gainful employment with proven educational pathways. In the Polish context, for example, it would be worth considering incentives for offshore wind investors in the Baltic Sea and for the nuclear power plant to co-create sponsored vocational classes in local technical schools in Pomerania. In addition, educational support from contracting authorities and the state could be linked to the gradual removal of material barriers by providing scholarships and free transportation for students from smaller towns.
Hubert Brączkowski
