
Economic Weekly 33/2026, August 21, 2026
Published: 21/08/2026
Table of contents
Global trade policy is at its most restrictive on record, yet trade keeps growing
61% year-on-year increase in global imports of AI-related equipment (computers and servers, their parts and integrated circuits) in January-May 2026
2nd the position reached by computers and servers in Poland’s export ranking, up from 7th place in 2024
4.5% the effective US tariff rate on AI-related products at the end of 2025
Global trade policy is now more restrictive than at any point since measurements began. The WTO-IMF Trade Policy Activity Index, which tracks trade policy measures across 197 economies, reached its highest level since the series began in 2010. Between January and May 2026, it averaged 412 points, almost twice its 2024 level of 214 and around one-quarter above the 2025 average. The increase has been driven almost entirely by restrictive measures — tariff hikes, import bans and quantitative restrictions — whose sub-index reached a record high in March 2026. The tightening has been concentrated in G20 economies. According to the WTO, the value of global imports affected by new restrictions quadrupled over the past year, reaching the highest level in the 15-year history of its monitoring.
Despite this, global trade continues to grow rapidly, although AI-related equipment accounts for almost half of the increase. Global merchandise trade volumes rose by 3.5% quarter on quarter in Q1 2026 (CPB), while the value of global imports in January-May was 10.7% higher year on year. Almost half of this increase — 4.7 percentage points out of 10.7 — came from a narrow category of data-centre equipment: computers and servers, their parts and integrated circuits. Imports of these products rose by 61% year on year, and their share of global imports has doubled in two years. Other electronics added another 2 percentage points, while rising prices of precious metals and fuels contributed around 2.5 percentage points. Pharmaceutical imports, by contrast, declined. All other sectors of the global economy combined contributed just 1.4 percentage points to the increase in the value of world trade.
The fact that trade values continue to rise despite tariffs is not a paradox: tariffs do not necessarily suppress imports during an investment boom, particularly when capital goods are deliberately exempted. The tariffs introduced in 2025 were concentrated on consumer goods and largely spared investment goods. At the end of 2025, the effective US tariff rate on AI-related products was only 4.5%, compared with 12.1% for other goods, as around 69% of AI-related imports were covered by exemptions.
Poland shows a similar pattern. Computers and servers have become the country’s second-largest export category and the main driver of export growth. Their exports rose by 53% year on year in H1 2026 to EUR 6.1bn, making them Poland’s second most important export product after automotive parts, up from 7th place in 2024. The main destinations are European data-centre hubs: the Netherlands (+62%), Germany (+55%), Ireland (+209%) and Sweden (+106%). Despite growing faster than the EU average of 34%, Poland slipped from 4th to 6th place among EU exporters, overtaken by Hungary and Ireland. Total Polish exports increased by 4.64% year on year in H1 to EUR 191.7bn, while imports rose by 5.1%. Imports of computers and components also surged, by 39% overall — including 55% from China and a fivefold increase from Taiwan. Available data suggest that this is not simply a case of re-exports: the main driver of Polish export growth is configured server systems (+119% year on year), which Poland barely imports. Part of the increase, however, is most likely related to the configuration and distribution of imported equipment — a question that can only be settled once data on sold industrial production become available. The growing dependence of trade growth on a single product category means that a correction in AI investment or the extension of trade restrictions to computer equipment could quickly expose stagnation in the rest of global trade.
Aleksandra Sojka, Agata Mróz
Polish companies raise prices more because of their own pricing history than because of costs incurred
33% of companies will raise the price of their main product or service in Q3 2026
44% of trade companies raised prices in Q2 2026
40% of large companies plan to raise prices in Q3 2026
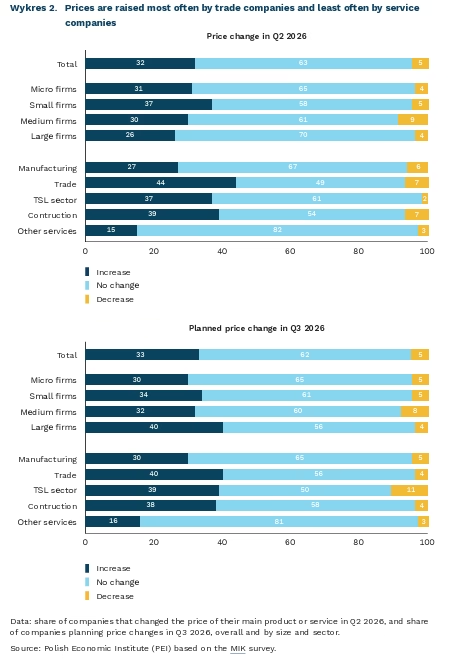
In Q2 2026, 32% of companies raised prices, and 33% of companies plan to raise them in Q3 — according to the August survey of the Monthly Business Climate Index (MIK). 3% of companies left their price lists unchanged, and 5% lowered them. Prices were raised most often by trade companies (44%) and construction companies (39%), and least often by service companies (15%). Plans to raise prices in Q3 were also most common among trade companies (40%), though a similar share of companies considering price increases can be found in the TFL (transport-forwarding-logistics) sector (39%). Among companies that raised prices, small enterprises stand out, with as many as 37% of them having done so. In turn, plans for price increases in Q3 show a significant share of large companies (40%).
The share of companies raising prices quarter-on-quarter changed markedly: 22% in Q4 2025, 45% in Q1 2026, and 32% in Q2 2026. This is based on three waves of surveys conducted by PIE in February, May, and August, respectively. The spike recorded in Q1 this year was not related to a worsening assessment of business barriers — reported concerns about economic uncertainty, labour costs, and energy prices remained at a similar level during that time. A more likely explanation is factors typical of the start of the year, such as price-list updates and the rise in the minimum wage, rather than a sudden deterioration in companies’ situation. However, a partial effect of the March disruptions on the fuel market linked to the situation in the Middle East cannot be ruled out — this is visible in the spike in the materials-shortage barrier during that period.
The best predictor of whether a company will raise prices is whether it has already done so before. A company that raised prices in a given quarter is more than three times as likely to plan another increase as a company that left prices unchanged, and this relationship is stable across all three survey waves. The second important signal is plans to raise wages, together with perceived barriers related to labour costs and economic uncertainty. Trade and construction companies combine both these elements more than twice as often as service companies (27% and 24%, versus 11%) — these are the companies most likely to enter into a series of price increases.
The government’s cut in VAT on fuel, which took effect on 17 August 2026, illustrates well the difference between an ad hoc intervention and a lasting pricing mechanism. From 17 to 31 August, VAT on fuel fell from 23% to 8%, and maximum prices returned at petrol stations. This is relief mainly for private drivers returning from holiday — transport companies, which already deduct VAT on fuel purchases, will barely feel the cut, since what matters to them is the net price, not the gross price. A two-week change in the tax rate therefore does not change the real costs of running a business, nor the wage pressure which — as the MIK data show — shapes companies’ pricing decisions over a much longer horizon.
Independent macroeconomic data point in the same direction, although the figures are not directly comparable. According to the NBP Quick Monitoring Survey from July, as many as 55.8% of companies expect prices of their products or services to rise in Q3 — mainly due to rising input costs. This is a higher share than in the MIK survey, which may result from a different sample and a different question wording (the NBP asks about expected price dynamics, rather than a decision already taken to raise prices) — however, both surveys consistently point to growing price pressure in the coming months. NBP’s July inflation projection also raised the CPI forecast for 2026 to 2.9%, pointing to energy costs and the cost of doing business as the main risks. At the same time, the pace of wage growth and minimum-wage increases is clearly slowing compared to previous years, which in the coming months may partly ease cost pressure from the labour side
Katarzyna Dębkowska
Wage pressure is easing, but labour costs continue to weigh on businesses
6% y/y increase in the average gross wage in the enterprise sector in June 2026.
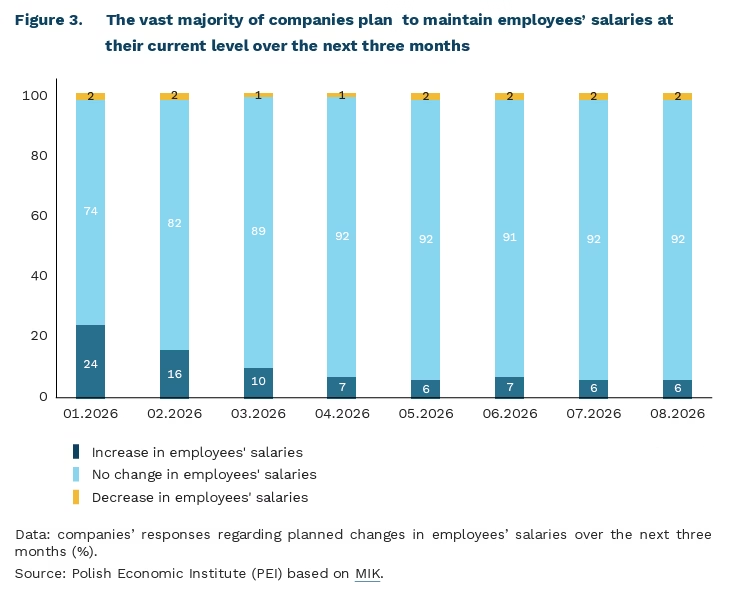
92% of companies plan to maintain employees’ salaries at their current level over the next three months
60% of companies cite labour costs as a barrier to doing business in the August Monthly Business Climate Index survey
In June 2026, the average gross wage in the enterprise sector increased by nearly 6% y/y, but wage growth is slower than in previous years, according to Statistics Poland (GUS) data. Data for the first half of 2026 also confirm a slowdown in wage growth. At the same time, wage growth was below the long-term average of 8.4%, as indicated by data from the National Bank of Poland’s (NBP) Quick Monitoring Survey. The slowdown in wage growth was broad-based and occurred across all major sectors of the economy. This is most evident in the services sector (a y/y decline to 7.1% from 13.6% in the fourth quarter of last year), and least evident in the construction sector (the difference is 0.1 percentage points). Slower wage growth is not the result of a single reading, but a broader phenomenon affecting most of the economy.
As many as 92% of surveyed companies to maintain employees’ salaries at their current level over the next three months, while 6% plan increases, according to the August Monthly Business Climate Index (MIK) survey. Compared with January this year, the share of companies planning no changes to salaries increased by 18 percentage points, whilst the share declaring increases fell by the same amount. NBP data point in a similar direction, although the levels of the two indicators are not directly comparable due to methodological differences. In the second quarter of 2026, the share of companies planning wage increases in the following quarter fell q/q to 29% (a fall of 2 percentage points), compared with a long-term average of 34% cent. The average size of planned wage increases stood at 4.5%, compared with a long-term average of nearly 6% cent. Companies are not only planning increases less frequently, but the scale of the planned changes is also lower.
In the August MIK survey, 60% of companies declared that labour costs were a significant barrier to doing business. In the first quarter of 2026, labour costs increased by almost 7% y/y, but their growth rate was below the long-term average (by 3.1 percentage points). At the same time, the share of labour costs in companies’ operating costs remained broadly unchanged at 15%. The slower rate of cost growth does not imply a significant reduction in their importance for businesses. After several years of rapid wage growth, companies are starting from a relatively high level of employment costs, which may limit their willingness to grant further pay rises.
Employment in the enterprise sector was 0.9% lower y/y in June 2026 (GUS). The vast majority of companies surveyed stated in all surveys this year that they planned to maintain current employment levels (80% cent in August). Companies were more likely to plan to hire new employees than to reduce employment (average over the last eight months: 11% vs. 8%). At the same time, employee mobility is weakening. In the first quarter of 2026, 15% of respondents had changed jobs in the previous six months (4 percentage points less y/y), whilst one in ten respondents was actively seeking work (a y/y decrease of 2 percentage points). The average time spent looking for a job has increased from 3.3 to 4.5 months. The observed lower labour mobility and greater difficulties in changing jobs may weakening employees’ bargaining power, which further reduces pressure for wage growth, even though some firms continue to complain about difficulties in finding suitably qualified staff.
The changes observed in the labour market point to a gradual easing of wage pressure. Companies are less inclined both to grant pay rises and to increase employment, while employees are changing jobs less frequently and need more time to find a new position. This does not mean, however, that the issue of labour costs is disappearing. From the businesses’ perspective, it is primarily the rate of increase that is falling, rather than the burden of costs itself, which remains high. If demand for labour continues to weaken, wage pressure may gradually ease. However, this will not be a uniform process across the entire economy, as in sectors with persistent labour shortages, pressure for pay rises may remain significantly stronger.
Aleksandra Wejt-Knyżewska
Greater Pay Transparency May Affect Job Satisfaction Among Employees
6.68 points is the average level of job satisfaction among employees in Poland, rated on a scale of 0-10
5.81 points is the average level of satisfaction with pay among employees in Poland, rated on a scale of 0-10
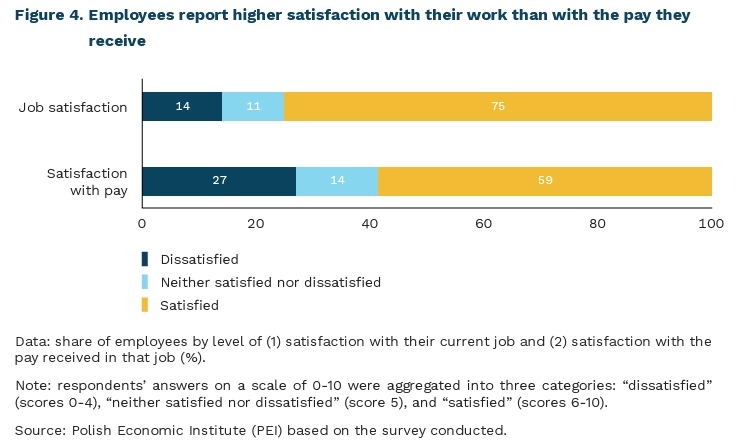
Most employees are satisfied with their job — according to a PIE survey conducted at the end of 2025 [1]. Employees were asked to rate their overall job satisfaction on a scale from 0 to 10, ranging from “very dissatisfied” to “very satisfied”. The average score was 6.68 points. Overall, 75% of respondents reported being satisfied with their job.
Differences in satisfaction levels between individual groups of respondents, distinguished by demographic characteristics and workplace characteristics, were relatively small. Men reported slightly higher average job satisfaction than women (6.76 points vs. 6.60 points). The youngest employees (aged 25-34) reported slightly lower satisfaction than those aged 35-59 (6.56 points vs. 6.73 points). Among occupational groups [2], office workers were the least satisfied with their jobs (6.28 points), while managers (7.09 points) and workers performing elementary occupations (7.08 points) reported the highest levels of satisfaction.
Job satisfaction and satisfaction with pay are correlated. However, satisfaction with pay was slightly lower, with respondents giving it an average score of 5.81 points. Moreover, respondents were more likely to report being dissatisfied with their pay than with their job overall (27% vs. 14%).
Job satisfaction is influenced, among other factors, by employees’ pay relative to that of their colleagues. One of the best-known studies in this area showed that providing employees with better access to information about their colleagues’ salaries in an academic setting reduced job satisfaction among those earning below the median. However, no increase in satisfaction was observed among employees earning above the median.
Meanwhile, most employees in Poland do not know how much their colleagues earn. In a survey published by PIE in December 2025, only one in four respondents declared that they knew the exact remuneration of all or some of their colleagues.
The implementation of new regulations in Poland stemming from the EU Pay Transparency Directive may therefore affect employee satisfaction. Among other provisions, the Directive introduces the right to request information on the average pay of colleagues in similar positions. Our latest survey experiment shows [3] that access to such information may affect job satisfaction, particularly among employees who learn that they earn less than people in similar positions. Importantly, providing justification for pay differences only partially mitigates this effect.
In our survey conducted last year, only one in three employees reported that they would request information on the average pay of their colleagues. Nevertheless, under the increased transparency requirements envisaged by the Directive — including, for example, a ban on confidentiality clauses and pay gap reporting in organisations employing more than 100 people — the mechanism described above may operate regardless of employees’ willingness to request information about their relative pay levels.
Employers should therefore review their pay structures and eliminate any unjustified pay differences. Although the changes have not yet been implemented, employers should take action early to ensure that greater access to pay information strengthens employees’ perception of fair pay rather than becoming a source of declining job satisfaction and, consequently, lower employee engagement.
- The survey population comprised employees aged 25-59 working for companies employing 50 or more people, for at least 20 hours per week. A total of 3 215 respondents participated in the survey.
- Based on the Polish Classification of Occupations and Specialisations (KZiS).
- The results will be published on 24 August this year.
Iga Rozbicka
Work experience affects wages, but not to the same extent in every profession
65% more earns an experienced foreign language teacher than a new employee
1% more earns an experienced hairdresser than a new employee
14.7% more earns an experienced employee in Poland than a new employee in Poland
Wage inequalities at the national level are primarily due to differences within local labour markets rather than between them. By comparing five Western countries over four decades, Bauluz and co-authors (2024) showed that differences in average wages between local labour markets — defined as areas where employment can be found without migrating — account for only 2-8% of total wage variance, depending on the country and period. The remaining part is explained by variation within such areas.
Potential factors contributing to this wage variation may include age structure, educational level and occupation, amongst others. The latter is the focus of two Polish studies. Piotr Szulc demonstrated that differences in employment structure account for a significant proportion of variation in average wages. Cezary Przybył, on the other hand, analysed the distribution of wage variation within individual occupations and showed that, in most of them, location alone accounts for relatively little of the variation in wages. Due to data availability, both of these analyses are based on county-level averages and do not directly test the same phenomenon as Bauluz et al. (2024), who use data on individual employees. In this paper, however, we examine the role played by work experience in wage variation [4] .
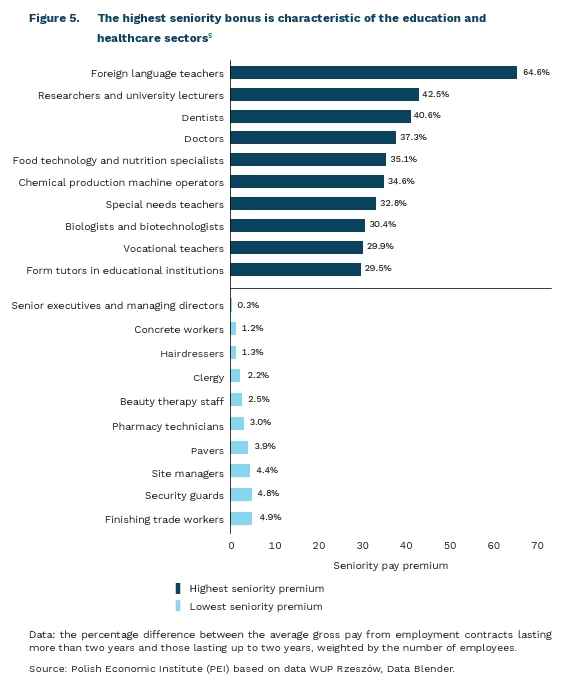
Work experience always pays off. Amongst Poland’s 144 most popular professions, there is not a single one in which the seniority bonus is negative or zero. The extent to which this effect is felt varies enormously: the difference is more than 200-fold between an occupation in which length of service counts for practically nothing (directors and managing directors) and one in which it counts significantly (foreign language teachers). The median length-of-service premium is 14.7%.
Those in education and healthcare benefit most from having more than two years’ service. The ten occupations with the highest pay supplements include foreign language teachers, researchers, university lecturers, dentists, doctors, food technology and nutrition specialists, chemical production machine operators, special needs teachers, biologists, biotechnologists, vocational teachers, and form tutors in educational institutions. At the opposite end of the spectrum are finishing trade workers, security guards, site managers, pavers, pharmacy technicians, beauty therapy staff, clergy, hairdressers and concrete workers.
The pattern observed does not appear to be random: seniority carries real weight where there is a formal, codified career progression pathway, often in the public sector (e.g. teaching grades, medical specialisations and academic titles). Conversely, seniority loses its significance where recruitment mainly takes place from the external labour market without a formal 'seniority’ structure, as is the case in beauty or hairdressing services.
4. The financial benefits resulting from work experience were calculated as the percentage difference between the average gross pay under employment contracts lasting more than two years and those lasting up to two years, weighted by the number of employees. For the analysis, 144 (out of 211) occupations with a total workforce of at least 20,000 people were selected, excluding niche occupations where individual observations could significantly distort the result. Part of the observed premium may reflect not only a reward for seniority as such, but also a general increase in pay over time (indexation) and — in regulated professions — a formal leap in qualifications (e.g. obtaining a medical specialism). The data covers only employment contracts registered with ZUS; it does not include self-employment or those insured under KRUS.
5. Classification prepared for the Data Blender system. It was created by aggregating occupations from the Polish Classification of Occupations and Specialisations (KZiS) and is consistent with the list of occupations used in the nationwide Occupational Barometer survey.
Agata Mróz
Employment of Young Workers in the U.S. Is Declining in Professions Vulnerable to AI
by 11% the employment among young American workers declined in professions most vulnerable to automation
19% the gap in employment growth for young American workers in automation-vulnerable professions compared to the growth rate in less vulnerable professions
According to researchers at the Stanford Digital Economy Lab (SDEL), there is no basis for concluding that artificial intelligence (AI) is displacing jobs at the economy-wide level. Total employment in the U.S. increased by approximately 6% between November 2022 and June 2026, while employment in occupations most vulnerable to AI replacement rose by 4%.
The situation is different regarding employment among young workers (ages 22-25). In this age group, employment in the two quintiles most vulnerable to the impact of AI fell by about 11%, while in the remaining quintiles it rose by as much as 10%. According to SDEL, employment among young people in professions with high exposure to AI (e.g., jobs related to software engineering or customer service) is 19% lower than the level it would have reached had it grown at a rate comparable to that of their peers in less vulnerable sectors (as recently as 2025, this gap stood at 15%).
Similar conclusions emerge from data published by „The Economist”: when comparing the percentage of graduates entering the workforce before and after the emergence of AI, those in fields with the highest exposure to AI suffer the most. In occupations within the most at-risk quintile, employment fell by 6.6%, compared with a 1.5% decline in the least vulnerable quintile. The researchers note that this phenomenon stems from a gradual slowdown in the posting of new job openings, rather than layoffs or employee resignations. According to „The Economist”, the number of job postings published in May 2026 on Handshake — a platform used to post job openings for university students — was 50% lower than in 2022.
Researchers from SDEL point out that it is too early to definitively conclude that AI is responsible for the decline in employment among young workers. First, the differences between young workers who are more and less vulnerable to being replaced by AI diminish when education is taken into account. Second, the method used in the study does not imply causation but only co-occurrence, which limits the ability to draw conclusions.
Researchers from the London School of Economics (LSE) offer an alternative explanation. Analyzing data from the U.S., the U.K., Canada, and Australia, they indicate that the main reason for the decline in employment among junior workers is the spread of remote work. The authors argue that the frequent attribution of the entire effect to the development of AI stems from the high correlation between the two phenomena (jobs that are easier to automate with AI are more likely to be performed remotely). According to the LSE, remote work increases supervision costs and makes it more difficult to onboard and mentor young employees, which reduces the profitability of investing in entry-level workers.
Existing research does not provide sufficient evidence to unequivocally conclude whether the decline in youth employment is caused by the development of AI. Although the results indicate a correlation between the phenomena, researchers exploring the topic often refrain from making definitive statements. To track these changes more closely, SDEL plans to introduce AI Economic Indicators — metrics that measure the impact of AI on the economy and the labor market. Rather than giving in to quick conclusions about young workers being pushed out of the labor market, it is now crucial to develop reliable analytical tools to distinguish the impact of AI from structural changes, such as the rise of remote work.
Michał Potasiński
The bull market draws Poles into the capital market
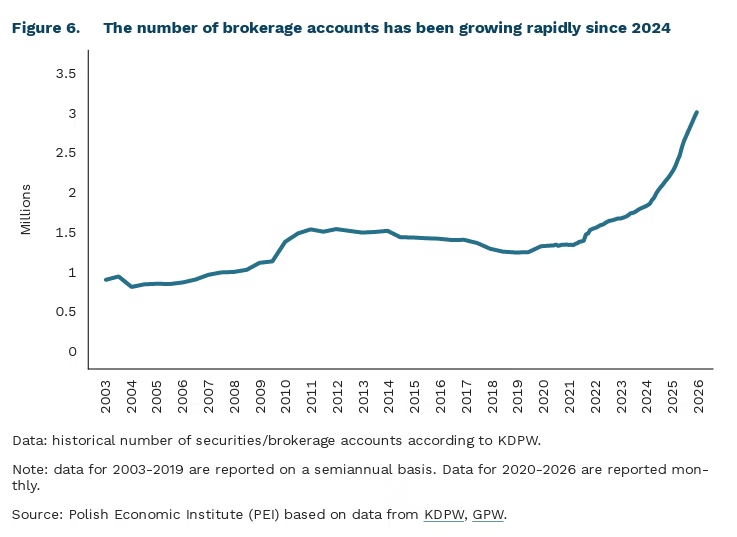
2.97 million securities accounts were held with banks and brokerage houses at the end of July 2026
by 1.36 million their number has increased since the end of 2022 (equivalent to an 85% rise)
The number of securities accounts in Poland has approached 3 million. At the end of July, banks and brokerage houses maintained 2.97 million accounts, 54,000 more than a month earlier and 753,000 more than a year earlier. Growth has clearly accelerated in recent years. The market crossed the 1.5 million threshold back in 2011, but it took until the end of 2022 to add the next 100,000 accounts. Since then, the number of accounts has increased by around 1.36 million. KDPW data do not mean, however, that Poland has nearly 3 million investors. One person may hold several accounts, and the statistics cover accounts maintained by KDPW participants rather than the number of unique individuals. The increase in the number of accounts also does not necessarily translate fully into interest in the Warsaw Stock Exchange, as some clients use them to invest in foreign markets.
The bull market on the Warsaw Stock Exchange is supporting interest in investing. WIG20 began its current upward trend in autumn 2022, and in August 2026 it closed above 4,000 points for the first time. The broad WIG index also reached record highs. Rising stock prices have been accompanied by changes in the brokerage services market. Lower transaction costs, the development of investment apps, broader access to foreign equities and ETFs, and the growing popularity of IKE accounts have made it easier to start investing and have supported long-term saving. The scale of these changes has been particularly visible since 2024. In 2025 alone, the number of accounts increased by 565,000, more than twice as much as a year earlier. Strong market conditions are not the only source of growth, but historically periods of large gains and major public offerings have encouraged inflows of new investors.
Individual Investment Accounts (OKI) will therefore be introduced at a favourable moment for the capital market. Poles will be able to use them from 1 January 2027. Income from assets held in OKI accounts, including capital gains, interest and dividends, will not be subject to the capital gains tax. Investment assets of up to PLN 100,000 will also be exempt from the asset-value tax, with up to PLN 25,000 of this limit allowed to take the form of savings. The Ministry of Finance estimates that by 2040 the scheme could channel an additional around PLN 74 billion to the Warsaw Stock Exchange. The current wave of account openings means that OKI will not be launched in a market lacking interest in investing. The challenge will rather be to turn this interest into systematic capital accumulation and to increase the role of the capital market in household savings.
Growing interest in investing is particularly visible among younger people. In the 2025 Nationwide Investor Survey by SII, the share of the youngest age groups and of people with less than five years of investment experience increased markedly. More than 60% of investors under the age of 35 declared that they added funds to their portfolio at least once a month, while 53.8% of all respondents indicated saving for retirement as their main investment goal. The survey points to a change taking place among the active part of the investor base. There is still considerable room for development. According to Eurostat, in 2024 cash and deposits accounted for 51.9% of the financial assets of Polish households, compared with an EU average of 30.6%. Poland was one of only two EU countries where their share exceeded half of total financial assets. At the same time, the financial assets of Polish households amounted to just 94.1% of GDP, compared with 219.2% across the EU. The record number of securities accounts is therefore primarily a signal that the base of potential investors is expanding. The next step should be an increase in the amount of capital invested in the market.
Sebastian Sajnóg
