
Economic Weekly 34/2026, August 28, 2026
Published: 28/08/2026
Table of contents
An increasing number of people are moving from Germany to countries in Central and Eastern Europe
37,000 more people left Germany for CEE countries than arrived there in 2025
13,600 the net migration balance with Germany was in Poland’s favor in 2025
13,000 the net migration balance with Germany was in Bulgaria’s favor in 2025
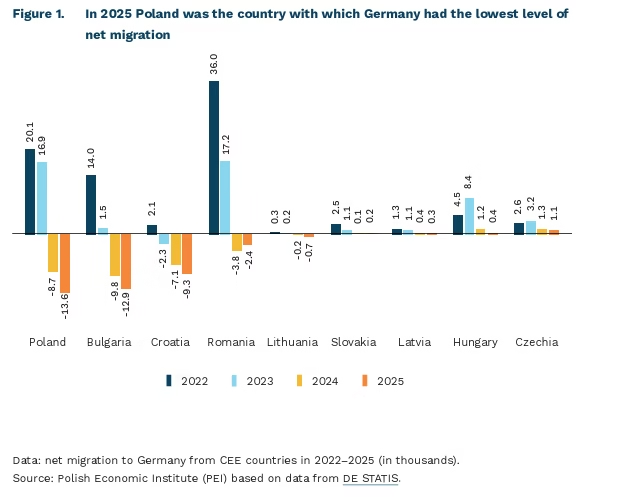
In 2025, the outflow of migrants from Central and Eastern Europe (CEE) continued in Germany. A total of 37,000 more people left Germany than arrived from the nine countries in the region (Poland, Bulgaria, Croatia, Latvia, Lithuania, Romania, Slovakia, the Czech Republic, and Hungary) [1] . This figure is 10,600 higher than in 2024. Just two years earlier-in 2023-the net migration balance between Germany and the CEE countries stood at over 47,000 migrants in Germany’s favor. The latest figures indicate that the data for 2024 were not a one-time anomaly.
Four countries were primarily responsible for Germany’s negative net migration balance with the CEE region in 2025. Germany’s net migration balance with Poland stood at -13,600 people and was the lowest not only among the analyzed CEE countries but also among all 119 countries [2] for which statistics are available. At the same time, Poland was the CEE country for which Germany’s net migration rate in 2023-2025 fell the most in nominal terms: from +17,000 to -13,600. The second country with which Germany recorded the lowest net migration rate was Bulgaria: -13,000 people. In addition, Germany had a clearly negative net migration balance with Croatia (-9,300 people) and Romania (-2,400 people). Of these four countries, only Romania’s 2025 figure is higher than the previous year’s, when 3,800 more people left Germany than arrived.
Germany’s negative net migration balance with Poland is primarily the result of a decline in the number of people leaving Poland for Germany. Compared to 2013-when net migration from Poland to Germany was at its highest level in the past fifteen years-the inflow in 2025 fell by 66%. At the same time, the number of people leaving Germany for Poland decreased by 36%. Over the past decade, therefore, we have seen a decline in both migration flows, though the number of arrivals from Poland to Germany has been falling at a faster rate. A different situation was observed in Bulgaria and Romania. There, the migration balance was primarily influenced by an increase in the number of people leaving our western neighbors.
In 2025, Germany’s net migration balance of people from abroad was at its second-lowest level since 2011 (after the 2020 figure). In total, 332,000 more people arrived in our western neighbor than left. This represents a 35% decrease compared to 2024, when the net migration balance stood at 511,000 people. The countries from which the largest net inflows of migrants to Germany occurred in 2025 were: Ukraine (+95,000), India (+38,000), Syria (+26,000), Turkey (+24,000), and Afghanistan (+19,000). However, each of these countries saw a year-over-year decline (ranging from -7% for migration from India to -65% for Syria). In some cases, this was due to the tightening of immigration and asylum laws introduced in Germany in 2025.
However, these factors do not affect the migration of citizens from CEE countries and other EU member states. In the countries of our region, the economic situation in the region is far more important. According to Eurostat data, for the past three years, Germany has experienced lower economic growth than the nine CEE countries analyzed earlier. Economic conditions translate into greater demand for labor and faster wage growth, which increases the expected benefits of emigration for potential economic migrants. An economic slowdown in the destination country will have the opposite effect.
- This refers to citizens of countries other than Germany. The remainder of the analysis also refers to migrants classified by the German Federal Statistical Office as “Foreigners”.
- We do not include the “unknown” country category here.
Jędrzej Lubasiński
Poland promoted to S&P's elite club
S&P, as the 3rd major index provider – after FTSE Russell and STOXX – has classified Poland as a developed market
0.15% estimated weight of Poland in the S&P Developed BMI basket, compared with 1.3% currently in the S&P Emerging BMI basket
S&P Dow Jones Indices has announced that Poland meets, and even exceeds, developed market standards. S&P’s methodology takes into account both quantitative and qualitative criteria, assessing factors such as the level of economic development, market size and liquidity, and accessibility for foreign investors. Poland’s gross national income per capita stands at around USD 25 520, well above the USD 15 000 threshold S&P requires. According to the data S&P used, in 2025 Poland’s total market capitalization reached about USD 292B, while median daily trading value was around USD 364M, meaning the size and liquidity thresholds for classification were exceeded several times over. Under this decision, Poland will join the S&P Developed BMI in September 2027 as the 27th country. In parallel, S&P also considered downgrading Egypt’s classification but ultimately left its status unchanged.
This is another important milestone in integrating the Polish market with the group of developed markets. In September 2018, FTSE Russell and Stoxx granted Poland developed market status, making it the first Central and Eastern European country classified this way by FTSE Russell. S&P Dow Jones Indices is now the next major index provider to take a similar step. The most notable holdout remains MSCI: Poland isn’t currently on its watch list of candidates for promotion to Developed Markets. South Korea is a good example of MSCI’s caution, as it stayed on that watch list for several years without ever being promoted. This shows that meeting quantitative criteria alone isn’t enough; the real-world experience of global investors and how well market infrastructure functions also matter.
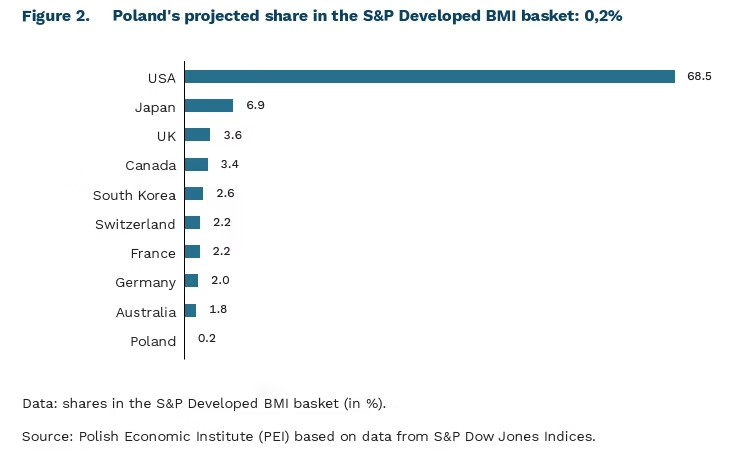
Poland’s low weighting comes not just from the size of its domestic market, but also from the very high concentration of global indices. In the S&P Emerging index, three countries – Taiwan, China, and India – account for nearly 75% of the index. In the Developed basket, meanwhile, the United States alone accounts for nearly 70% Looking only at free float [3] capitalization, Poland’s weight in the Developed basket will be comparable to Norway’s (0,2%) and Ireland’s (0,1%), partly because the free float of Poland’s largest companies is limited, with significant stakes in many of them still held by, among others, the State Treasury.
Poland’s estimated weight in the S&P Developed basket is 0,15%, versus 1,3% currently in the Emerging basket. However, the pool of capital benchmarked to developed markets is 8-9 times larger than the pool benchmarked to emerging markets. So, looking at real value rather than percentage alone, Poland doesn’t necessarily lose out from the promotion. The real benefits, in the form of capital inflows, will play out gradually: the market capitalization of companies listed on the Warsaw Stock Exchange (GPW) is around 30%, versus an EU average of 50%, leaving the market plenty of room to grow and draw in capital
3. Free float is the portion of a listed company’s shares that remains in free circulation and is available to investors in the market.
Wojciech Leoszkiewicz
Despite measures taken by the EU, China’s share of European imports keeps rising
EUR 196 billion the EU’s trade deficit with China reached in the first half of 2026
car imports from China to Poland have increased 2.5-fold, while those to the EU grew by more than 1.5-fold
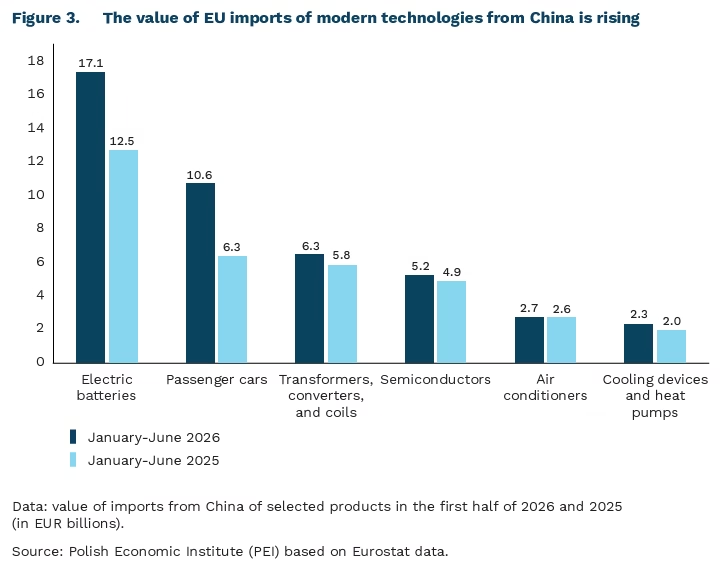
Although the EU is striving to implement policies aimed at enhancing its economic security, both China’s share of European imports and the trade deficit with China continue to grow. The deficit rose by more than 9% year-over-year to a record high of 196 billion euros, while imports increased by more than 5%. Just two product categories – automobiles and electric batteries – account for as much as one-third of the increase in the value of imports. Over the course of the year, these categories saw a combined 1.5-fold increase (by EUR 9 billion), which, compared to the first half of 2019, represents a 50-fold and 10-fold increase, respectively. The third-largest product category driving import growth in the EU is data processing equipment (including computers and servers). Imports in this category increased by EUR 1 billion year-over-year, which translates to only a 6% year-over-year increase and a 30% increase compared to 2019. This points to China’s dynamic growth in the production of automotive and battery products in recent years, largely thanks to intensive government support in these sectors (including subsidies, tax breaks, and funding for innovation).
China also plays a significant role in trade in other products related to the low-carbon economy or climate change adaptation. These include electrical transformers, wind turbines, photovoltaic panels, heat pumps, and air conditioners. Interestingly, imports of portable and other than wall types air conditioners (the narrow category HS8415.82) from China rose by 52% in the first half of the year; however, total imports of air conditioners – including the most important category of wall-mounted units – did not increase. This may be the result of shifts in delivery timing or an increase in the declared value of exports. The figures do not indicate an increase in imports of products in this category from any other non-EU country.
Poland’s imports from China follow a very similar pattern: the largest increases were reported in the automotive sector and in data processing equipment. Car imports from China increased 2.5-fold compared to 2025. Total imports from China to Poland rose by 11% and compared to 2019 – they doubled. Strong growth was also recorded in oxometallic salts (used, among other things, in battery, chemical, and metallurgical industries), monitors and projectors, and other electrical equipment and parts.
In the case of cars imported into the EU, the impact of tariffs has been limited. The growth in electric car imports has slowed, but this is mainly due to Western manufacturers shifting production of electric vehicles to Europe. Chinese manufacturers are also investing in factories on the continent, primarily in Spain, Hungary, and Slovakia. Chinese manufacturers have also significantly increased sales of internal combustion engine vehicles in the EU, which are not subject to tariffs. The total share of Chinese manufacturers in new vehicle sales reached nearly 10% in the European market and over 12.5% in Poland. Battery imports have also risen sharply. This points to insufficiently broad tariffs and a long-term threat to European manufacturers from China. The growth in car production in China has meant that the EU is no longer the world’s largest car manufacturer.
The Americans have reduced their trade deficit with China, but they fear this is evidence of tariff evasion. The growing presence of Chinese products in Europe is significant not only for the EU’s competitiveness but may also affect trade relations with the US. In a newly published White House report titled The Great Transshipment Scam, the team led by Peter Navarro – Trump’s economic adviser and a leading opponent of cooperation with China – points out that many countries have become exporters of Chinese products to avoid tariffs. It names 40 countries, including Poland, as a “hidden transshipment network”, though it notes that some of these changes may result from the relocation of production rather than tariff evasion. Poland is listed as part of a “Central European belt” that processes Chinese components, which ultimately end up in the US in later stages. To curb tariff evasion, customs authorities are to make greater use of artificial intelligence – dubbed the “American border detective” – designed to assess the risk of tariff fraud.
Marek Wąsiński, Aleksandra Bielawska
The European Union needs a significant expansion of photovoltaic waste recycling capacity
200 Mt of PV waste the world will produce globally by 2050
25 Mt of PV waste the EU will produce by 2050
nearly 13-fold the increase the EU needs in PV waste recycling capacity by 2050
According to the International Renewable Energy Agency (IRENA), the cumulative mass of photovoltaic (PV) panels reaching end-of-life is projected to reach 200 Mt globally by 2050. This marks a significant upward revision from IRENA’s earlier 2016 estimates, which projected 60–78 Mt by 2050.
Under IRENA’s scenario [4], the market value of materials recovered annually from endof-life PV panels is projected to exceed USD 810 million by 2030, reach USD 6 billion by 2040, and surpass USD 20 billion by 2050. Nearly half of this value will come from recovered aluminium, followed by silver (33%), silicon (11%), and copper (7%). By weight, however, glass and polymers are expected to account for the largest share of globally recovered materials (over 75%).
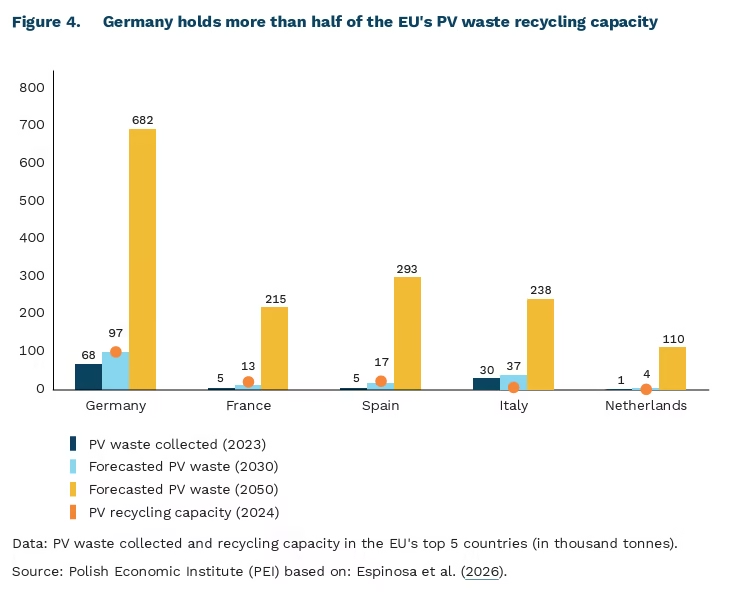
In the EU countries, the mass of PV panels that have reached the end of their useful life is expected to exceed 25 Mt, growing by 2.2 Mt per year through 2050. At the same time, recycling capacity across all EU countries stood at just 170,000 tonnes in 2024 – nearly 4 times less than today’s needs (600,000 tonnes), and as much as 12.5 times less than may be required 24 years from now. In 2023 [5], Germany generated the most PV waste (68,000 tonnes) of any EU country, but it is also the country that hosts more than half of the EU’s current PV recycling capacity (99,000 tonnes/year) — five times more than the next two countries, Spain (22,000 tonnes/year) and France (20,000 tonnes/year).
Poland reports significantly lower collected PV waste volumes — under 600 tonnes in 2023 [6]. This is largely a result of Poland’s solar boom starting later than in many other EU countries. Modern PV panels have a lifespan of around 25 years, whereas 10 years ago Poland’s total installed PV capacity stood at just under 200 MW, compared with 27 GW as of June 2026. The rapid growth in PV capacity, particularly after 2020, means Poland will nonetheless need to prepare for a substantial volume of PV waste in the 2040–2050 period. (Despite its currently small waste volumes, Poland is already named as one of the notable exporters of such waste to Germany, alongside Italy, Greece, and Spain).
4. The scenario assumes efforts to limit temperature rise to a maximum of 1.5°C above pre-industrial levels.
5. EU countries have 18 months from the end of the calendar year to report electrical waste data. Eurostat then needs a further three months to process it. For this reason, 2024 data is not expected until Q4 2026.
6. It should be noted that in Poland’s case this figure varies significantly from year to year — just over 300 tonnes in 2021, but as much as 1,500 tonnes in 2020.
The development of AI could drastically increase inequalities between countries and within societies
40 years – that is how large the gap in AI adoption could be between developed and developing countries, according to a simulation conducted by the IMF
by 30 years – effective education reform could accelerate AI implementation in poorer countries, according to a simulation conducted by the IMF
Researchers at the International Monetary Fund (IMF) outline scenarios for how artificial intelligence (AI) will affect inequalities among Asian countries. They argue that unless appropriate measures are implemented, the ongoing development of AI will widen the gap between developed and developing countries and exacerbate social inequalities. The methodology is based on a simulation of Asian countries’ development from 2024 to 2100 using an overlapping generations model (OLG). Countries differ in terms of demographics, capital stock per worker, and factor productivity. In the model, AI is a new, expensive technology requiring extensive infrastructure; it replaces the labor of low- and medium-skilled workers while assisting specialists.
Simulations show that faster AI adoption could lead to a significant increase in inequality among countries. In every scenario, AI development increases the share of capital in national income at the cost of the share of labor, disproportionately affecting young and low-skilled workers. Faster AI development in wealthy countries triggers a sharper rise in global interest rates, increasing borrowing costs for developing countries. Because AI implementation requires substantial investment, high capital costs delay its adoption in poorer countries. In the IMF’s worst-case scenario, the poorest countries may adopt AI as much as 40 years after developed ones.
More optimistic authors from the World Bank (WB) argue that adapting AI solutions to the local context could allow developing countries to “achieve in a decade what would otherwise take a century.” They suggest adopting small, low-cost AI solutions to improve education, healthcare, and agriculture. The WB’s optimism is based on data: in low- and middle-income countries, only 4.5% of jobs are at risk of automation (compared to as much as 14.2% in wealthy countries). However, in terms of access to the infrastructure needed for AI development, poorer countries are far behind developed nations.
Both institutions (the IMF and the WB) agree on the necessary actions. According to IMF’s simulations, reforming the education system effectively accelerates the implementation of AI in poorer countries by as much as 30 years, which translates to approximately 2% more annual growth. It is also essential to meet the infrastructure requirements necessary for AI development, to focus AI implementation on increasing productivity without replacing human labor, and to implement targeted social transfers.
Neither the IMF nor the WB analyzes the long-term consequences of a lack of so-called “technological sovereignty” – that is, the dependence of processes on foreign suppliers. The authors do not distinguish between the origins of AI technologies, which is crucial in the context of security and dependence on tech giants or global powers. Since European countries, including Poland, are struggling with this problem, it is difficult to expect that poorer countries will be able to develop independent technology on their own. By implementing solutions promoted by the WB without their own computing infrastructure, developing countries expose themselves to numerous dangers, such as sabotage and blackmail, as well as a lack of control over technology costs, which could exacerbate global inequalities.
Ultimately, although the IMF and the WB identify internal barriers and the potential for economic growth associated with AI, their lack of consideration for digital sovereignty represents a serious gap in their projections. Without securing their own computing infrastructure and technological independence, the reforms proposed by both institutions could, in practice, entrench a new form of global subordination of developing countries to external technology providers.
Jakub Witczak, Michał Potasiński
Negative sentiment prevails in construction, but signs of improvement are emerging
98.0 points the MIK value in construction in August 2026
2.2 percentage points the year-on-year decline in construction and assembly output in July 2026
12% of construction companies plan to take on new employees in the next three months
In August, negative sentiment prevailed over positive among construction companies, according to data from the Monthly Business Climate Index (MIK). The index reached 98.0 points in August, falling below the neutral level (100 points). Sentiment among construction companies deteriorated compared to the previous month. This was driven by an increase in the proportion of companies reporting a decline in sales value (by 4 percentage points) and a smaller share of companies planning to hire new employees than in the previous month (by 6 percentage points). Slightly fewer companies also declared that they had undertaken investment in tangible or intangible assets in the past three months.
The declarations of surveyed companies point, however, to a possible improvement in the coming months. The share of companies reporting an increase in orders rose slightly (by 3 percentage points month on month and 5 percentage points year on year), while companies reporting insufficient production capacity relative to their order books continues to outnumber those with excess capacity. Furthermore, in the construction sector, companies planning to increase their workforce continue to outnumber those planning redundancies over the next three months (12% vs. 9%).
In July 2026, construction and assembly production was 2.2% lower than a year earlier (after eliminating the seasonal factors) and 3.8% lower than in June 2026, according to GUS data. Among the factors contributing to this some companies pointed to irregular nature of post-completion settlements, which were more severe than usual for this time of year. The decline in output was felt to varying degrees by companies operating in different construction sub-sectors. The largest decline was recorded by companies carrying out specialised construction activities (down 6.4% year on year and 12.4% month on month), while a markedly smaller decline was seen among companies involved in the construction of buildings (down 1.8% year on year and 3.9% month on month) and those whose basic type of activity was civil engineering works (down 0.2% year on year and 3.0% month on month). By contrast, the figures on the profitability of construction firms are positive. According to GUS, the net turnover profitability indicator reached 4.2% in Q2 2026, representing an increase both relative to Q1 2026 and to the corresponding quarter of the previous year.
The situation in construction and the outlook for the future vary depending on the specific sub-sector. In civil engineering construction, where the main investor is often a public institution, the development outlook remains stable, provided no sudden changes occur in the market that would cause a significant rise in operating costs. In residential construction, the first half of the year was stable, though varied depending on location. A slight upturn also appeared in individual house building. Forecasts suggest, however, that developers will approach the launch of new projects more cautiously than in previous years. According to company declarations in MIK surveys, as well as PFR data, the barrier whose severity has increased the most is rising energy prices, which are having a significant impact on the growth of operating costs.
Anna Szymańska
Are Digital Media a Trap for the Knowledge-Based Economy?
An increasing body of research points to the significant impact of digital media use on, among other things, well-being, social interactions, and cognitive functioning. However, despite widespread concerns and a growing number of empirical studies, the findings remain largely inconclusive. In particular, they do not explain how the short-term effects of using digital devices demonstrated under laboratory conditions translate into long-term changes.
The authors of a recent article published in Nature Human Behaviour have proposed a theory that helps fill this gap. They suggest that frequent use of digital media does not so much impair cognitive abilities as reduce the inclination to engage in mental effort. Low-effort engagement with digital content, which provides immediate gratification, compensates for the discomfort associated with more demanding tasks (hence the habit of reaching for one’s phone while studying or carrying out professional duties). Over time, the habit of shifting attention toward less demanding activities makes them seem more rewarding (they require less effort while producing faster results) than more difficult tasks that require greater deliberation. In the long run, it becomes increasingly difficult to sustain effort on activities whose results take much longer to materialize, such as deepening one’s knowledge and developing the persistence needed to find practical applications for it. Importantly, this process is usually unconscious, and its automatic nature becomes stronger with repeated experiences of redirecting attention toward stimuli available on digital platforms.
This theoretical framework helps explain several well-known and widely practiced behaviors, such as cognitive offloading, also referred to as the “Google effect.” This phenomenon reflects a shift in the allocation of effort when externally searching for information is less costly than memorizing it internally, potentially weakening memory consolidation. A similar mechanism may help explain the effects of the growing availability of generative artificial intelligence tools. When tasks such as summarizing, writing, or problem-solving can be performed with minimal effort through external systems, the perceived subjective value of sustained cognitive engagement may decline relative to the ease of delegating these tasks to AI.
The authors of the article argue that the gradual reduction of cognitive effort in carrying out everyday tasks (e.g., abandoning demanding activities due to boredom or fatigue before they produce tangible results) limits the development of the skills and competencies needed to achieve specialization and mastery. Sustained effort is essential for knowledge acquisition to be cumulative and to lead to lasting growth in knowledge—a point well understood by educators.
Empirical confirmation of the mechanism proposed by the researchers would suggest that we are facing a paradox of the knowledge-based economy. Digital technologies radically reduce the cost of accessing information, but they also make it more difficult to invest effort in absorbing challenging material, solving complex problems, or experimenting. Counteracting this trend requires changes in educational strategies (aimed at both children and adults) that teach not only how to use digital tools, but also how to engage with digital technologies deliberately and over extended periods in contexts that require cognitive effort. The authors also call for greater responsibility on the part of regulators and technology companies, recommending design changes to digital media settings that would strengthen users’ agency—for example, prompts encouraging users to specify their purpose for using a platform, automatic interruptions to scrolling, or feedback systems that make opportunity costs more visible.
Agnieszka Wincewicz-Price
