
Economic Weekly 36/2026, September 11, 2026
Published: 11/09/2026
Table of contents
Geography does not explain the increase in the number of decisions on development conditions
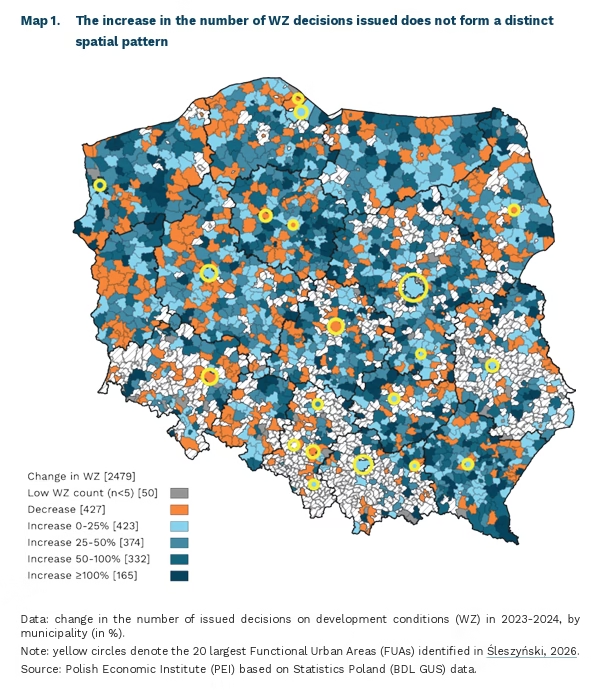
25.6% increase in the number of decisions on development conditions (WZ) in an average municipality in 2024 compared to 2023 (in 2018-2019, prior to the reform, this growth was approximately 0%)
66% share of decisions concerning residential development among all decisions on development conditions in an average municipality in 2024
For the past two years, we have observed a significant increase in applications for the establishment of development conditions (WZ). The median growth in the number of issued WZ decisions reached 25.6% year on year in 2024 compared to 2023 (the average, inflated by a few municipalities experiencing extreme growth, reached 36%). This is likely because landowners wanted to submit their applications before the repeatedly postponed deadline, finally set for 1 September this year. After this date, municipalities without a general plan – over 60% of all municipalities – and without a local spatial development plan (which has been optional for years), lost the ability to issue WZ decisions.
This phenomenon is most likely a temporary side effect of the spatial planning reform introduced on 24 July 2023. This reform restricted the ability to issue new WZ decisions to planning zones that allow residential construction and – in the absence of a local plan – to built-up area completion zones (OUZ). These zones and areas will be designated in general plans. Under the new regulations, every municipality will be required to produce such a document separately from local spatial development plans, the latter of which remain non-compulsory and cover approximately 30% of the country’s area. Consequently, the reform imposes stricter conditions on applicants seeking WZ decisions. Specifying the deadline for the new regulations to come into force encouraged applicants to take advantage of the existing, more flexible submission terms.
Residential zones are designated based on an assessment of demand for new development. The baseline for this assessment is the population figure on which new development areas are planned. This figure is established on the basis of the demographic forecast for a given municipality by Statistics Poland (GUS), with a margin of +/- 30%. However, this process only considers undeveloped land and ignores redevelopment areas. Consequently, residential areas can currently be planned for a population 10 million larger than the population anticipated by the GUS 20-year forecast. In 2024, a significant majority of WZ decisions – as many as 66% – were issued for residential purposes. This growth compared to 2023 (median 25.6%) is substantially higher than during the pre-reform period. For instance, from 2018 to 2019, municipalities in the median range for WZ decisions did not see an increase in these figures year-on-year. Even municipalities in the upper quartile, which saw the highest increase in WZ decisions, experienced an increase of less than 22% (i.e. less than the 2023-2024 median).
One might expect the increase in issued decisions to be concentrated in suburban areas of large cities. However, spatial autocorrelation analysis shows that the increase in WZ decisions is not concentrated in specific areas. There is no visible correlation with proximity to metropolises or large cities. The pattern shown on the map resembles a series of independent local decisions. This phenomenon affected both growth-oriented and depopulating municipalities to a similar extent, so it is difficult to explain it through housing demand alone. It is difficult to assume that the same economic principles operated in areas from which people leave more often than they build as in suburban municipalities. However, it cannot be ruled out that, in both types of municipality, the statutory deadline merely accelerated the submission of applications that would have been filed anyway. Despite this possibility, the uniform statutory deadline remains the simplest explanation as to why the spike encompassed municipalities with such diverse demographic situations.
Agata Mróz
Poland produces mainly basic components for data centers
655 the number of products identified as essential for building a data center
72.6% the increase in the value of imports of data center construction equipment to the U.S. in 2025 compared to 2023
in 102 product groups (out of 164), the manufacturing of products necessary for building a data center is located in Poland
Building a data center requires the purchase and installation of several hundred products, of which as many as 655 are identified as essential. As the importance and use of artificial intelligence grows, these products are playing an increasingly significant role in international trade. At the same time, access to them and domestic production capabilities may give rise to a new set of trade dependencies and lead to problems similar to those already identified in the semiconductor sector.
The growth in global trade in data center equipment accounts for nearly half of the total growth in global merchandise trade, and in the United States alone, the value of imports of these products increased by 72.6% in 2025 compared to 2023 (while the value of total imports rose by 11%). These imports account for nearly one-quarter of all U.S. imports.
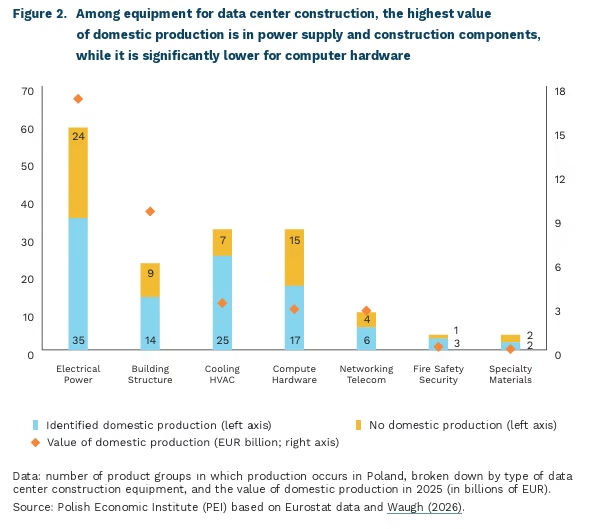
As pressure grows for the development of data centers in other countries, including Poland, the importance of understanding trade dependencies and domestic production capabilities is increasing. A limitation here is the availability of data – trade data is significantly more detailed than data on domestic production, so it is not easy to precisely determine the scale of domestic production of the equipment necessary to build a data center. Domestic production data published by Eurostat allow for the identification of 164 product groups, which include all products necessary to build a data center. Of these, domestic production in Poland was identified in 102 groups, while no such production was found in 62 product groups. In contrast, European production (in at least one EU country) was identified in all product groups except two.
Considering the value of production in Poland, it is worth noting the relatively high share of products classified under the Electrical Power and Building Structure groups. In contrast, the value of Computer Hardware production is low – yet this is also the product group with the highest technological sophistication and the greatest value generated. The products that make up a data center can be divided into the following categories: Compute Hardware, Electrical Power, Networking Telecom, Cooling HVAC, Fire Safety Security, Specialty Materials and Building Structure. According to the authors of the list of products needed for data center development, the largest share consists of products related to Electrical Power (35% of all products); however, in terms of value, those related to Compute Hardware dominate.
A comprehensive analysis of domestic dependencies in the data center construction sector requires combining data on domestic production with data on imports; however, a preliminary analysis suggests that as data centers in Poland expand, a significant portion of the components will need to be imported. Another significant limitation is the method of reporting production data and the ability to link trade data with production data. The above data are based on relatively broad product groups, which may mean that the presented production figures overestimate the value of products used in data centers (a broader range of products is included). However, they represent a first step toward determining the economic impact of the further development of data centers in Poland.
Ignacy Święcicki, Michał Potasiński
Remittances reflect the changing profile of Ukrainian emigration
USD 7.9 billion in remittances were sent by Ukrainian migrants from around the world to Ukraine in 2025
21.5% was the year-on-year decline in the net earnings of short-term Ukrainian migrants in 2025
29% was Poland’s share of total remittances to Ukraine in 2025
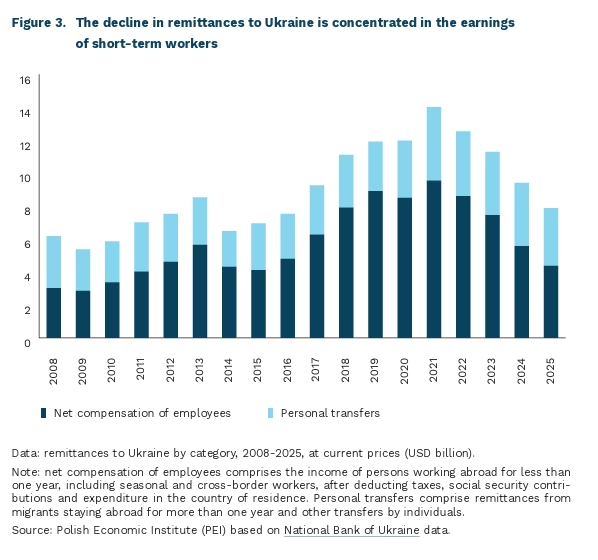
Ukraine has for years been one of the largest recipients of remittances [1] in Europe, but their inflow into the country has been declining since the end of 2021. In 2025, they amounted to nearly USD 7.9 billion, down 16.3% year-on-year. The decline was driven by a drop in net compensation of employees, including seasonal and cross-border workers, which fell by 21.5% year-on-year. Personal transfers, comprising remittances from migrants staying abroad for more than one year as well as other transfers by individuals, proved more resilient: they decreased by 8.7% year-on-year, while preliminary data for the first half of 2026 indicate a 13.3% year-on-year increase.
Changes in the level and structure of remittances point to a transformation in the profile of Ukrainian emigration. The war has fostered family reunification and the permanent settlement of Ukrainians abroad, which naturally reduces the pool of remittance recipients in Ukraine, while the transition from temporary employment to permanent residence has been facilitated by the liberalisation of access to the EU labour market. In 2022, temporary protection removed the requirement to obtain work permits, which had previously been used by seasonal workers. As a result, the importance of seasonal and cross-border migration has declined: in 2025, short-term migration accounted for 55.5% of total remittances, compared with over 68% in 2021. The way these flows are measured also matters: once a migrant’s stay exceeds one year, they become a resident of the host country and statistics record the amount actually remitted rather than their earnings.
The demographic structure of migrants has also changed. After 2022, men working abroad played a smaller role, as the departure of men aged 18-60 subject to military service was restricted, while the importance of women with children increased; they are typically in a more precarious economic situation in host countries. This is reflected in the structure of private transfers: despite the collapse in the income of short-term workers, other current transfers sent by individuals have remained at around USD 2 billion annually since 2023. The form of support is also changing – some of the diaspora’s engagement is shifting from remittances to humanitarian assistance, while the financial capacity of senders themselves is being constrained by economic pressures in host countries.
The geographical diversification of the diaspora is progressing. Poland remains the largest source of Ukrainian remittances, although its share fell from 33.1% in 2021 to 29% in 2025, while the role of the United States, the United Kingdom and the Czech Republic has increased; in 2025, they accounted for 14.1%, 9.1% and 8% of the total pool, respectively. As migrants’ stays become more permanent, geographical proximity matters less, while living standards and earning opportunities in the destination country become more important. Consistent with this is the observed decline in the role of informal transfer channels, such as carrying money and goods across the border – a method typical of short-term circular migration.
The impact of these changes on Ukraine’s exchange-rate stability remains limited, as the country’s main source of external financial support is now assistance from Western countries. Meanwhile, the international reserves of the National Bank of Ukraine are projected to approach USD 70 billion by the end of 2026, according to its forecasts. The significance of remittances lies elsewhere: they finance household consumption and cushion short-term fluctuations in income, so their decline may affect consumption in households where remittances have accounted for a significant share of income. As migrants’ stays abroad become longer, remittances typically lose importance because migrants’ income and expenditure become concentrated in the host country. Declining remittances may therefore indicate not only changes in income conditions but also weakening ties with the home country – people sending money to Ukraine are almost one and a half times more likely to return than those who do not.
- Remittances are household income received from abroad, generated mainly as a result of temporary or permanent migration of individuals abroad.
Hubert Pliszka
In most EU countries, the Pay Transparency Directive will be implemented late
5 EU Member States have transposed the provisions of the Pay Transparency Directive into their national law
The deadline for transposing the Pay Transparency Directive into national law expired in June this year. Its main objective is to narrow the gender pay gap by increasing the transparency of pay and of the rules for setting it in the workplace.
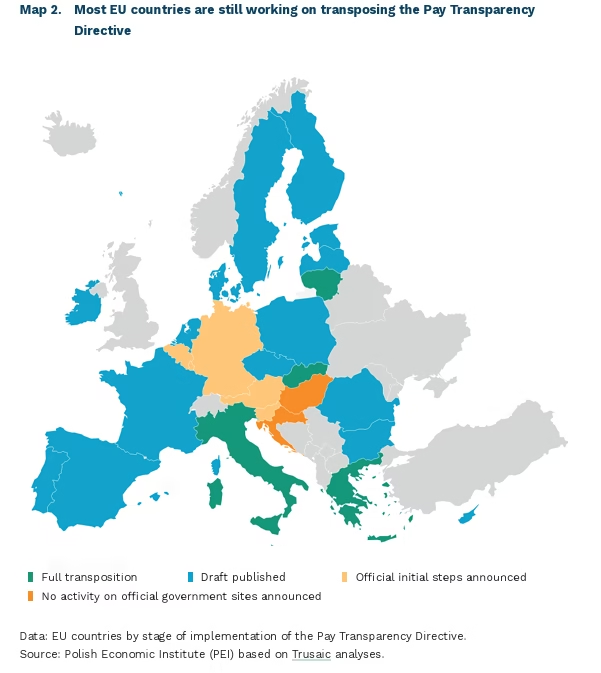
Only 5 EU Member States have completed the transposition of the Directive so far. In Italy, Slovakia and Malta, the provisions have already entered into force. In Lithuania, most of the arrangements are in operation; the exception is the provisions concerning the pay system and reporting, which will take effect in late December and early January. In Greece, in turn, the key provisions will apply from 1 November.
In Poland, some of the arrangements arising from the Directive are already in place, but work on transposing the most important provisions is still under way. In December 2025, an amendment to the Labour Code was adopted, introducing an obligation to inform candidates of the proposed pay before an employment contract is concluded, a ban on asking candidates about their current or previous pay, a ban on pay secrecy clauses in contracts, and an obligation to use gender-neutral job advertisements and job titles. The latest draft act implementing the remaining elements – job evaluation, the right to comparative information on co-workers’ pay, and pay-gap reporting – was published in April 2026.
In most countries, as in Poland, draft legislation on the implementation of the Directive has already been published. In others, even where no official legislative draft has yet been published, preparatory work or consultations on how to implement it are under way. In Germany, an amendment to the existing Pay Transparency Act is being prepared, but the draft has not yet been published. In Slovenia, a working group has been set up to prepare the draft. In Austria, in turn, the draft has been referred for internal political consultation, and its further progress is the subject of discussions between the governing parties and the social partners. So far, Croatia and Hungary are the only countries that have taken no official steps. Delays in transposing the Directive stem largely from protracted consultations and coordination processes. Concerns relate, among other things, to the additional administrative burden on employers and to the protection of personal data.
In many countries, pay transparency rules are already in place and only require alignment with the requirements of the EU Directive. This applies above all to employers’ obligations relating to pay-gap reporting. Countries in which such reporting requirements were already in force include, among others: Austria, Belgium, Denmark, Finland, France, Ireland, Italy, Lithuania, Portugal, Spain and Sweden. In Germany, meanwhile, the Pay Transparency Act, which entered into force in 2017, already provides for the right to information on the pay levels of co-workers in similar positions.
Implementation of the Directive may have positive effects on the labour market. Experience from other countries shows that the comprehensive mechanisms provided for in the Directive, which combine information obligations with tools for enforcing pay transparency, have the potential to narrow the pay gap, as we indicated in our report. Our latest experimental study, in turn, shows that disclosing pay inequalities may increase the willingness of lower-paid employees to negotiate their pay, and thereby help to eliminate unjustified pay differences – not only those related to gender.
Iga Rozbicka
Polish exporters underuse the internet as a tool for promotion and sales growth
51% of exporters introduced innovations in 2023-2025
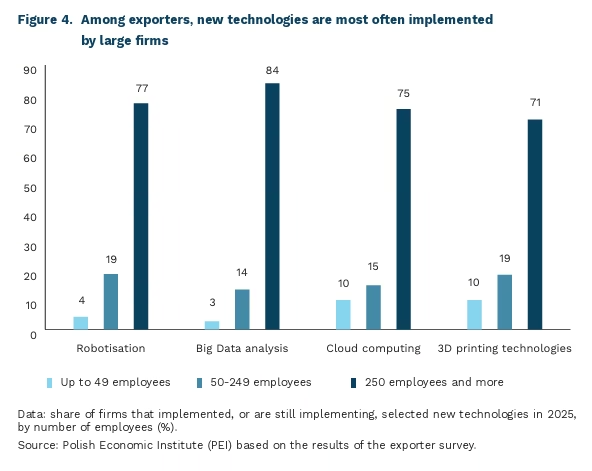
35% of exporting firms used robotisation in 2025
22% of exporters ran a foreignlanguage website in 2025
The level of innovation among exporting firms is higher than among enterprises in Poland overall. Among the exporters surveyed by PIE, as many as 51% declared that they had introduced innovations in 2023-2025 [2] – significantly more than the 36.5% of firms reporting such activity in GUS surveys. Earlier PIE research [3] found that in 2025 the share of firms investing in R&D stood at 14.3% of all firms surveyed. Among exporters, however, the share of firms investing in this area was twice as high, at 28%. Innovative exporting firms tend to be large companies from high-technology sectors. A relationship is also visible between innovativeness and the business model adopted – firms targeting other businesses (B2B) are more innovative than those targeting individual consumers (B2C). In addition, innovative firms compete more frequently on non-price factors.
One in three firms exporting goods has implemented or is implementing robotisation (35% of firms). This share among exporters has remained stable – in 2022-2024 the average share of firms that had implemented or were implementing this technology stood at 34%. This result is nearly twice as high as in the 2025 PIE survey covering Polish firms overall, among which 18% of enterprises were implementing automation and robotisation. It should be noted, however, that the PIE exporter survey significantly overrepresents large firms (48% of the sample), and the use of robotisation is strongly correlated with firm size – larger entities more frequently use industrial robots.
On the other hand, exporters make less use of the internet as a tool for selling or promoting products abroad than firms operating on the domestic market. In 2025, only one in three exporters used this type of support, most commonly in the form of running a foreign-language website (22% of firms), a presence on social media (7%), and promotion on foreign websites (5%). The picture for firms operating in Poland overall is different. According to GUS data, in 2025 68% of firms had their own website, and 48% used social media in their operations.
The way exporting firms operate may also be shaped by the fact that around 80% of them operate under a B2B model. Sales abroad take place mainly within established capital ties and group affiliations, rather than through the acquisition of new sales markets, specific contracts or customer orders, or participation in trade fairs. On the other hand, operating on foreign markets requires firms to continuously increase their productivity and competitiveness. This explains the higher share of innovative firms and the greater openness to new technologies observed among exporting firms.
2. According to the results of the PIE survey of exporting firms, conducted by GUS in April 2026 on a sample of 342 firms.
3. A survey of enterprises conducted by PIE in December 2025 on a sample of 1,000 firms.
Katarzyna Sierocińska
Manufacturing loses momentum after summer upturn
29% of manufacturing companies recorded a decline in new orders in September
45% of manufacturing companies have no need to invest
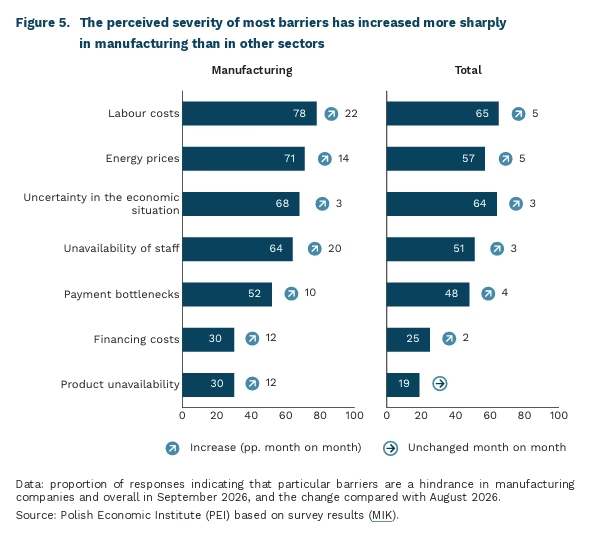
78% of manufacturers report rising labour costs, and 71% rising energy prices
As recently as August, manufacturing was the sector with the largest prevailing positive sentiment over negative – according to the Monthly Business Climate Index (MIK) – but in September it recorded a sharp decline (by 7.7 points month on month and 6.1 points year on year), falling below the neutral level (99.7 points). The deterioration is part of a broader slowdown in European industry, which is also reflected in the PMI index for Poland.
The decline in sentiment is driven primarily due to a weakening inflow of orders and a growing mismatch between demand and companies’ production capacity. In September, significantly more manufacturers recorded a decline in new orders (29%) than an increase (8%). At the same time, 17% of companies considered their production capacity excessive relative to their current order portfolio. The fall in the index may therefore be the result of a problem that has been building up for several months, which has only now clearly affected companies’ self-assessment.
Weaker sales prospects are also constraining companies’ investment activity. As many as 60% of companies undertook no investment in the past three months, and among these, as many as 45% declare that they currently have no need to do so. This is a slight increase compared to the previous month, but manufacturing companies had also shown limited investment activity in earlier months. This points to a cautious approach to growth in conditions of uncertain demand.
Manufacturing companies continue to operate under strong cost pressure. The most frequently cited barrier remains labour costs, considered burdensome by 78% of manufacturing companies. Second are energy prices (71%), and third – uncertainty in the economic situation (68%). It is also worth noting that in September, manufacturing was the sector that most frequently reported the majority of operational barriers. Moreover, indications for all barriers to operations in this sector are at their highest level since the beginning of the year. In September, the burden of rising labour costs and labour shortages increased particularly sharply. The September deterioration may therefore be attributable to an accumulation of cost burdens and staffing problems alongside a simultaneous weakening of demand.
The manufacturing sector has entered a phase of heightened caution. At the same time, companies are facing weaker demand, spare production capacity, limited willingness to invest and persistent pressure from labour and energy costs. These are not yet unambiguous symptoms of a crisis, but rather signs that the effects of the earlier upturn – which had allowed manufacturing to maintain relatively strong results during the summer months – are running out.
The situation of Polish manufacturers is also shaped by processes taking place in the European and global economy. European industry remains under pressure from weak foreign demand, high costs of the energy transition, and growing competition from Asian manufacturers. In addition, companies are operating in conditions of heightened geopolitical tensions, disruptions in international trade, and ongoing technological change. In such conditions, a weakening of orders translates more rapidly into a deterioration in business climate assessments and greater investment caution.
Anna Szymańska, Katarzyna Zybertowicz
