Economic Weekly 38/2025, September 26, 2025
Published: 26/09/2025
Table of contents
Generative AI Increasingly Automates Work
39% share of job-related prompts to AI chatbots aimed at full task delegation
40% share of US employees who used AI in their professional tasks in 2025
36% share of job-related prompts to Anthropic’s Claude concerning programming code
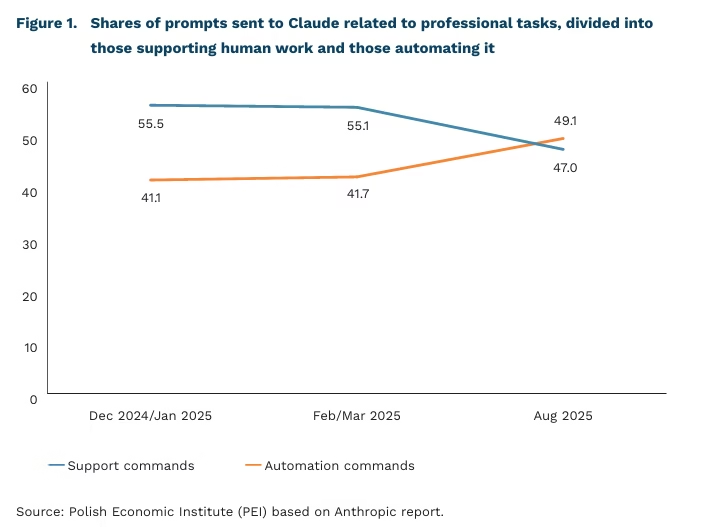
Generative artificial intelligence (AI) is increasingly being used to automate professional tasks, according to the latest edition of a study published by AI lab Anthropic. For the f irst time, the share of prompts indicating task automation with Anthropic’s Claude model has exceeded those designed to support human work. Moreover, the share of prompts aimed at full task delegation to GenAI reached 39%, i.e. an increase of 12 percentage points compared to the end of 2024.
According to a Gallup survey, as many as 40% of US employees report using AI for professional tasks. This is nearly double the 2023 figure, when only 21% declared such use. The rapid pace of AI adoption means that just over seven months after Anthropic’s previous report, clear shifts in the use of its Claude model are already visible.
Coding remains the dominant professional task assigned to Claude (36% of all tasks), but the nature of coding prompts is evolving. Debugging requests are becoming less frequent, while full program creation is increasingly common – a sign of growing AI effectiveness and a step toward full automation. At the same time, the use of Claude for domain-specific professional tasks is rising, particularly in education (12.4%) and scientific applications (7.2%).
Usage of Claude varies strongly across countries and correlates with income measured by GDP per capita. In countries with lower per-capita chatbot usage(1), tasks are more concentrated, primarily coding, and more often involve full task delegation. In higher- income countries with broader adoption, task diversity is greater, with more prompts related to education, science, and business, and a stronger emphasis on knowledge acquisition and human-supportive tasks.
Despite continuous improvements in GenAI models and rapid employee adaptation, companies still struggle to identify the most strategic business areas for AI deployment. A recent MIT study highlights the scale of failed implementations, with 95% of GenAI projects ending unsuccessfully. At the same time, employees are increasingly adopting these tools informally, often outside official security and data-protection procedures, to speed up and simplify their work. This reveals a significant gap between the official availability of generative AI in companies and the much higher share of employees who use it in practice.
- Usage per capita was measured by an index combining the frequency of Claude use with the size of the working-age population.
Jakub Witczak
Parents’ Socio-Economic Status Shapes Access to Higher Education in Poland
36% share of household income inequality in Poland attributable to gender, place of birth, or parents’ socio-economic status
11% share of Poles aged 25-34 whose parents both lack upper-secondary education that attain higher education
79% share of Poles aged 25-34 with at least one parent holding a higher-education degree who also attain higher education
According to the latest OECD report To Have and Have Not – How to Bridge the Gap in Opportunities, on average at least one-quarter of household income inequality in OECD countries can be attributed to factors beyond individual control (gender, place of birth, or parents’ socio-economic status), i.e. inequality of opportunity. This means that a significant share of disparities is shaped by inherited circumstances rather than personal effort or merit. Despite some convergence, the conclusion from the widely cited 2018 report A Broken Social Elevator? How to Promote Social Mobility remains valid: socio-economic background has a lasting impact on life outcomes.
In Poland, inherited characteristics account for 36% of household income inequality, i.e. well above the OECD average. Similar levels are observed in Chile, Spain, Luxembourg, and Belgium, while only Ireland, Portugal, and the United States record higher shares. By contrast, in Iceland, Denmark, and Finland, just 15% of inequality is linked to factors beyond individual control.
In most OECD countries, parents’ socio-economic background, and specifically their education and occupation, accounts for more than 60% accounts for more than 60% of inequality of opportunity. Poland, together with Hungary, Lithuania, and Slovakia, belongs to the group of countries where gender and place of birth play a marginal role, while parental status (both mother’s and father’s) is decisive.
Breaking the link between parents’ socio-economic status and educational attainment is crucial to improving social mobility. One way to achieve this is by ensuring equal access to higher education, since educational attainment is closely tied to labour-market outcomes. Adults with higher education earn, on average, 54% more than those with only upper-secondary education.
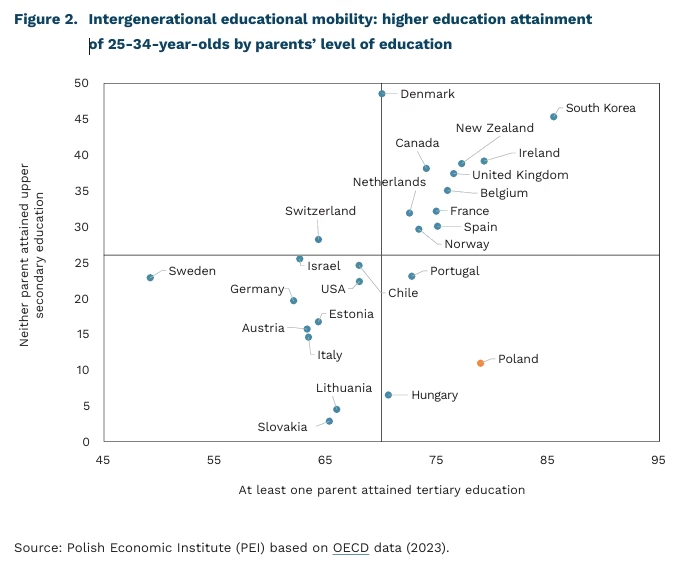
The likelihood of attaining higher education among young Poles whose at least one parent has a university degree is more than seven times higher than among those whose parents did not complete upper secondary education(2). Poland has the largest gap in intergenerational transmission of higher education among OECD countries. Only 11% of 25-34-year-olds whose parents did not complete secondary school obtain higher education, compared with 79% of those with at least one parent holding a degree.
Poland’s position relative to the OECD average has not improved since 2012. The share of young adults with higher education whose parents had not completed secondary education fell from 16% to 11%, while the share among those with at least one parent with higher education remained unchanged at 79%. By contrast, in Denmark the proportion of young adults whose parents had not finished secondary school but who themselves attained a university degree rose from 28% to 49%. Significant progress has also been recorded in the United Kingdom and Belgium. The OECD emphasises that early childhood education and care (ECEC) are the most effective tools for levelling the playing f ield. High-quality preschool programmes have the greatest impact on children from low socio-economic backgrounds, reducing educational disparities even before further stages of schooling begin.
2. The term ‘sticky floor’ (OECD terminology) is used to describe this type of phenomenon, referring to the persistent limitation of opportunities for social and educational advancement caused by inherited socio-economic characteristics that make it difficult for individuals to break through the barrier to higher levels of career, education, or income, despite their efforts and personal merits.
Cezary Przybył
Urban Populations Have Been Shrinking for 20 Years
1998-1999 the only period in the past 25 years with a positive migration balance for Polish cities
53,000 number of residents who left cities in 2022
5 number of voivodeships with a cumulative positive migration balance between 1998 and 2024
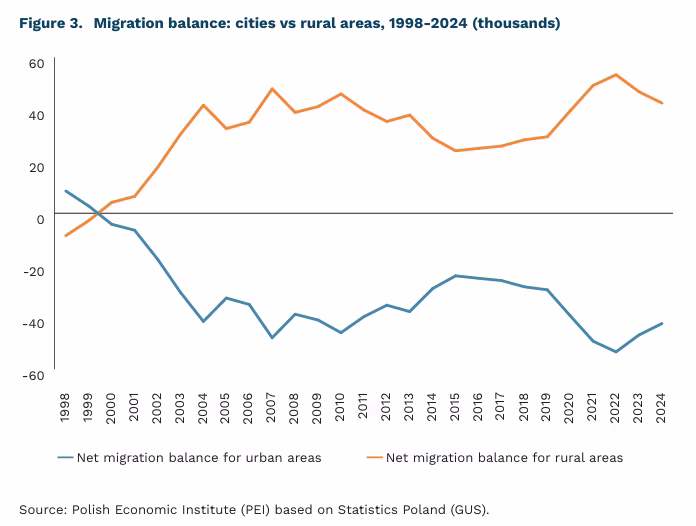
The latest Statistics Poland (GUS) data on internal migration (permanent residence) confirm that Poland has been experiencing suburbanisation for around 25 years. There has been a steady outflow of residents from cities to neighbouring municipalities, resulting in a negative migration balance for many cities. In contrast, the migration balance for rural areas has been positive, indicating the growing attractiveness of living outside major metropolitan areas.
Cities recorded a positive migration balance only in 1998 and 1999 (+8,500 and +2,700 people, respectively). The lowest negative balance was noted in 2022 (-53,300), while rural areas posted a record-high positive balance (+53,300). This was likely driven by lifestyle and work changes accelerated by the COVID-19 pandemic, although the pandemic merely catalysed a pre-existing trend of migration from cities to rural areas.
Between 1998 and 2024, only five voivodeships had a cumulative positive migration balance: Mazowieckie (+320,500), Małopolskie (+92,900), Pomorskie (+82,600), Wielkopolskie (+47,400) and Dolnośląskie (+39,500). Mazowieckie stands out as the only voivodeship with positive balances for both cities and rural areas, underscoring the continuing attractiveness of the capital as a place of residence and the strong suburbanisation around it.
Internal migration in Poland is not only the result of individual decisions but also a ref lection of deep-rooted regional inequalities. People leave less developed regions due to a lack of jobs, insufficient public services, and inadequate transport infrastructure. This trend not only exposes but also reinforces Poland’s spatial development imbalances.
The voivodeships with the largest negative migration balances between 1998 and 2024 are those with weaker infrastructure and limited access to major labour markets. The most affected regions include Lubelskie (-124.3k), Śląskie (-80.0k), Warmińsko-Mazurskie (-66.3k), Świętokrzyskie (-65.5k), and Podkarpackie (-58.4k). These areas lack strong pull factors – they offer few development opportunities and have higher unemployment rates than the national average. Śląskie represents a special case: despite being an industrialised region with relatively low unemployment, population outflows are likely driven by the ongoing economic transformation, including mine closures and industrial restructuring.
Similar dynamics are visible in other EU countries. Internal migration reflects persistent regional disparities and the depopulation of peripheral areas. According to Eurostat, less developed regions in Central and Eastern Europe, Southern Europe, and in peripheral parts of Germany, France, and Italy are losing residents to dynamic metropolitan areas and their surroundings, which attract young and educated populations. This process accelerates population ageing and leads to the closure of schools and public services in weaker regions, while more prosperous areas continue to strengthen their demographic and economic significance. The phenomenon thus deepens regional development disparities across the EU and represents one of the main challenges for cohesion policy.
Katarzyna Zybertowicz
Ukraine Dominates Poland’s Iron Ore Imports
1.4 tonnes average iron ore required to produce 1 tonne of steel in blast furnace technology
93.6% share of Ukraine in Poland’s iron ore imports in 2024
73.4% share of non-EU suppliers in EU iron ore imports in 2024
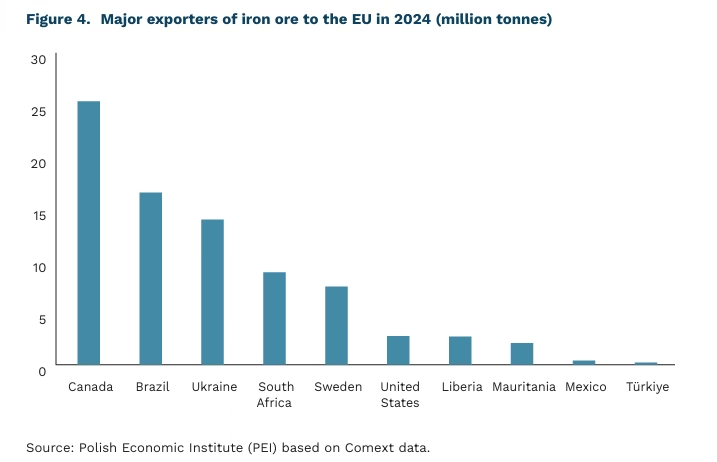
In 2024, non-EU suppliers accounted for 73.4% of the EU’s iron ore imports. The EU’s own deposits are relatively small and mostly depleted. Sweden remains the only significant producer, exporting 7.5 million tonnes of iron ore to EU countries in 2024. Beyond Sweden, the main external suppliers were Canada (25.4m tonnes), Brazil (16.6m tonnes), Ukraine (14.0m tonnes), and South Africa (8.9m tonnes). Imports from Russia to the EU dropped sharply year-on-year, from EUR 53.5m to EUR 1.3m in 2024. For Poland, Ukraine is virtually the sole supplier, accounting for 93.6% of total iron ore imports. Between 2015 and 2024, Ukraine’s share increased from 70.1% to 93.6% of total iron ore imports. Between 2015 and 2024, Ukraine’s share rose from 70.1% to 93.6%, largely due to the phase-out of imports from Russia, which in 2015 accounted for 12.4% of Poland’s total iron ore imports.
Iron ore is an essential raw material for steel production in the blast furnace–basic oxygen furnace (BF+BOF) process, one of the two dominant steelmaking technologies alongside electric arc furnaces (EAF). Producing one tonne of steel in the BF+BOF route requires an average of 1.4 tonnes of iron ore. Although scrap steel is the primary input in the EAF process, it sometimes also requires iron ore as an additive. According to the World Steel Association, on average 0.6 tonnes of iron ore are used to produce one tonne of steel. Global demand for steel rose sharply in the first two decades of the 21st century, driving a 118.5% increase in iron ore demand between 2005 and 2021.
The decarbonisation of steel production is expected to accelerate the role of electric arc furnaces, reducing the volume of iron ore needed per tonne of steel produced. A forward-looking technology for the sector is the direct reduction of iron ore with hydrogen (DRI/H₂), in which hydrogen replaces coking coal as the reducing agent used in blast furnaces. This process requires high-quality iron ore (so-called DR-grade) with an iron content of at least 67%. In 2022, such ore accounted for only 4% of global iron ore trade. In Europe, the Swedish company LKAB is a pioneer in the production of high-grade iron ore.
Marek Wąsiński, Marianna Sobkiewicz
Canada–EU Trade Boosted Under CETA
EUR 3.2 billion estimated annual contribution of CETA to EU GDP
70% increase in the value of Polish exports to Canada between 2016 and 2024
2,866 number of Polish firms exporting to Canada under CETA in 2017–2022
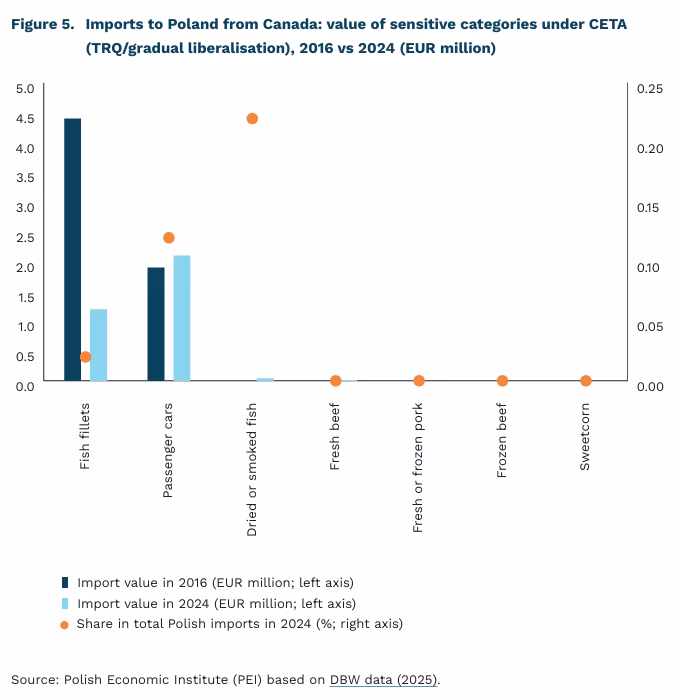
On 21 September 2025, eight years had passed since the start of the provisional application of the Comprehensive Economic and Trade Agreement (CETA) between the EU and Canada. Since January 2024, the agreement has been in full force with no remaining transitional periods. Tariffs have been eliminated on approximately 98.6% of Canadian and 98.7% of EU tariff lines, with transitional periods lasting up to eight years. In agriculture, 90.9% of tariff lines gained duty-free access immediately, while tariff-rate quotas and exemptions were retained for the most sensitive products (notably cheese imported into Canada, and meat and maize imported into the EU).
A comparison of ex ante forecasts with actual ex post outcomes shows moderate alignment with initial macroeconomic estimates. Sustainability Impact Assessment (SIA) projections anticipated a long-term increase in EU real GDP of 0.02-0.03%. In practice, the realised effect has been EUR 3.2 billion annually – equivalent to about 0.02% of EU GDP, but materialised over a shorter horizon. Bilateral trade increased by 65% between 2016 and 2023. In agriculture, contrary to expectations, Canadian exporters used only 3% of their beef quota and 1% of their pork quota, mainly due to differences in sanitary standards.
For Poland, imports from Canada have tripled since 2016, reaching EUR 0.6 billion in 2024, while exports rose by 70% to EUR 2 billion – generating a positive trade balance of EUR 1.4 billion. The trade structure reflects modern value chains: 27.74% of Polish exports consisted of turbojet engine parts, 11.38% of lithium-ion batteries, and 5.71% of complete turbojet engines. On the import side, pharmaceuticals (20.1%) and aircraft engines (14.25%) were dominant. The number of Polish firms exporting to Canada increased from 2,076 in 2012-2016 to 2,866 in 2017-2022.
In several product categories, Canada recorded a significant increase in its share of EU imports, but these were not areas relevant for Polish exports to the EU market. The categories included radioactive chemical substances and isotopes, mineral and chemical fertilisers, iron ore, diamonds, precious metals, soybeans, aircraft, hormones, aluminium, and wheat. Apart from aluminium and wheat, none of these categories accounted for more than 0.1% of Poland’s total exports to the EU.
In foreign direct investment (FDI) on both sides of the Atlantic, the scale has grown, though CETA’s impact remains moderate and uneven. EU FDI in Canada increased by an average of EUR 40 billion annually (from EUR 220bn to EUR 260bn), while Canadian FDI in the EU grew by EUR 44 billion (from EUR 166bn to EUR 210bn). However, Canada’s share in the EU’s investment portfolio has declined, as US and Chinese investment destinations have expanded even faster. The limited effect on FDI partly reflects the fact that CETA’s key investment provisions are still awaiting ratification by 10 EU member states. At the same time, Poland and Canada are bound by a bilateral investment protection agreement.
The services sector, a central element of CETA, recorded a 44.4% increase in EU–Canada trade. Telecommunications, IT, and transport services grew particularly strongly. In Poland, trade in services with Canada tripled, but similar growth dynamics were also observed in relations with the United States. In goods trade, growth with the US was likewise comparable. This suggests that the rise in Polish–Canadian trade may not stem primarily from CETA preferences, but rather from a combination of non-tariff factors.
Aleksandra Sojka
Ukraine’s Economic Growth is Losing Momentum
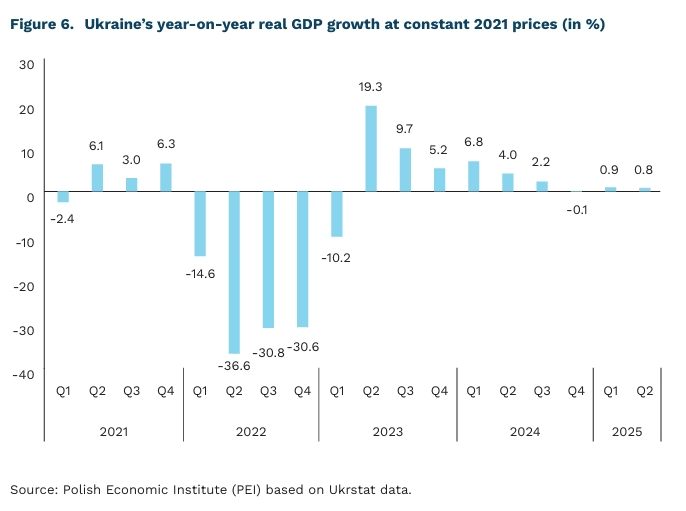
0.8% year-on-year growth of Ukraine’s real GDP in Q2 2025
77.3% Ukraine’s real GDP over the last four quarters relative to the 2021 pre-war level
In 2025, Ukraine’s economy has entered a phase of clear slowdown. Preliminary Ukrstat data show that real GDP grew by just 0.8% y/y and 0.2% q/q in Q2 2025. A key challenge remains the persistent imbalance between labour demand and supply, driven by worker shortages, which is weighing heavily on economic activity. Real GDP for the past four quarters stands at 77.3% of the 2021 level, prior to the outbreak of war. Future prospects depend on the course of events. Under the baseline scenario, assuming continued international support and no further escalation of hostilities, GDP growth in 2025 will be around 2%, with gradual recovery expected in 2026 as logistics improve and production capacity is rebuilt.
Against this backdrop of weak economic activity, disinflation is advancing. After peaking in May at 15.9% y/y, inflation fell to 13.2% in August, driven by increased supply of new agricultural products and a resulting decline in food prices. Another important factor is the restrictive monetary policy of the National Bank of Ukraine, which has kept the key policy rate at 15.5%. The central bank projects inflation to fall to around 10% y/y by year-end and to gradually approach its 5% medium-term target. On the other hand, strong nominal wage growth – up 17% y/y in September – remains a source of inflationary pressure. The labour market continues to face strain due to mobilisation and migration.
The external environment remains difficult, with public finances heavily reliant on foreign assistance. In August, the European Union disbursed the fourth tranche under the Ukraine Facility, worth over USD 3 billion, as well as the seventh tranche of macro-financial assistance, worth USD 1 billion. The budget deficit is expected to reach around 22% of GDP this year, with plans for 2026 pointing to roughly 18.4% of GDP. Defence and security expenditures will again dominate, projected at about 27.2% of GDP. Consequently, a large fiscal deficit, dependence on international aid, export constraints at land borders and ports, and persistent wage pressures remain structural features of Ukraine’s macroeconomic landscape.
Piotr Kamiński
Financial and Structural Incentives Have Limited Impact on Fertility Growth
2% average annual global decline in the total fertility rate (TFR)
20% decline in the TFR in Nordic countries after a short rebound in the early 2000s
The pace of the decline in the total fertility rate (TFR) is accelerating, surprising even the most cautious forecasters. This trend now extends to countries such as Turkey, Egypt, and India, where fertility levels projected for 2100 have already materialised in the third decade of this century. Globally, the average annual decline in the TFR – currently estimated at 2% – doubled in the 2000s and has accelerated again in the current decade. Even in the Nordic countries, which recorded a rise in births at the start of the century, the TFR has since fallen by about one-fifth compared with 2010.
The effectiveness of public policy incentives to encourage childbearing is increasingly being questioned. This applies not only to financial measures such as tax breaks or direct transfers, but also to parental-leave extensions and provisions enabling fathers to share long-term childcare. To date, these measures seem to have benefited mainly those who would have chosen to have children regardless of tax or labour law provisions. Financial transfers function more as support for lower-income families than as true incentives to have (more) children, especially as larger families are now more common among the aff luent. An emerging challenge is the growing proportion of women choosing not to have children at all or limiting family size to one child. According to UN data, in 2024 the number of women of reproductive age who want children is nearly equal to those who do not.
Analysts increasingly see opportunities to reverse negative demographic trends in productivity-enhancing technologies, particularly those based on AI. Higher labour productivity, they argue, could not only boost GDP but also free up time by reducing working hours. In conditions of rising wages, this could encourage not only the wealthiest but also the middle class to start families.
If shifting cultural trends are the main driver of demographic change, techno-optimism about boosting fertility (along with expectations tied to shorter working weeks) may face significant social limitations. In an ageing society, young parents will increasingly encounter fewer peers starting families, and it is precisely the example of others and the lived experience of close relatives and friends that have an often underestimated influence on reproductive decisions.
A proposal currently included in the draft development strategy for Poland, i.e. the need to improve the social image of family and parenthood, may paradoxically prove to be a more effective tool for fostering the desire to have children and alleviating concerns about parenthood than the financial and structural measures implemented so far.
Agnieszka Wincewicz-Price