Economic Weekly 43/2025, October 31, 2025
Published: 31/10/2025
Table of contents
US and EU Sanctions on Russia’s Energy Sector Strike at the Kremlin’s Main Source of Revenue
557 number of ‘shadow fleet’ vessels sanctioned by the EU to date
Approx. 20% decline in Russia’s energy export revenues in January–September 2025 compared with the same period in 2024
1% Russia’s projected GDP growth in 2025 (IMF forecast)
The administration of Donald Trump has imposed sanctions on Russia’s two largest oil companies – Rosneft and Lukoil – shortly after the United Kingdom introduced similar restrictions. Together, these companies account for around three-quarters of Russia’s oil production and exports. Under the new US sanctions, American institutions, businesses, and individuals are prohibited from cooperating with Rosneft and Lukoil. Moreover, secondary sanctions may extend to financial institutions and enterprises in third countries that maintain cooperation with the sanctioned firms.
The impact of these new American sanctions on the Russian economy will depend on how strictly the United States enforces them, including against entities in third countries that attempt to circumvent restrictions. Effective enforcement is key to cutting off a crucial revenue stream for the Kremlin. These are the first sanctions against Russia announced during Donald Trump’s current term in office. During his first presidency (2017-2021), Trump frequently resorted to such instruments, introducing sweeping sanctions against China, Russia, and Iran, among others.
A day after the United States announced its restrictions, the European Union unveiled its 19th sanctions package. Its primary goal is to tighten existing measures, with a strong focus on the energy sector – the backbone of Russia’s state revenues. The new package includes, among other things, a ban on the import of Russian liquefied natural gas (LNG) from 2027, sanctions on Gazprom Neft and Rosneft, and restrictions on a further 117 vessels of the so-called ‘shadow fleet’. These actions are aligned with the REPowerEU plan, which envisages a complete phase-out of EU imports of Russian fossil fuels.
The sanctions come at a time when the Russian economy is already slowing down. According to IMF forecasts, GDP growth will amount to 1% in 2025 and 1.3% in 2026. Meanwhile, war-related spending is rising faster than revenues, resulting in a record budget deficit despite recent tax increases. The new sanctions will erode Russia’s pricing advantage on energy exports, weaken one of the state’s key revenue channels, and complicate the implementation of numerous extraction projects involving sanctioned entities, including Lukoil’s ventures in Africa and the Middle East. In the longer term, the EU’s withdrawal from Russian gas will be particularly significant, as redirecting these exports is difficult. In the first nine months of 2025, the value of gas imported by the EU from Russia via pipelines and as LNG was more than three times higher than that of direct oil imports.
The sanctions may also create difficulties for importers of Russian energy. Russia’s main buyers are now China, India, and Turkey. Rosneft, for example, supplies crude oil to China via pipeline, while India and Turkey profit from refining Russian oil and re-exporting it. Within the EU, Russian oil still reaches Slovakia and Hungary, and Russian LNG is imported by Belgium, France, and Spain – from where it is indirectly redistributed to other European buyers, including Germany. Sanctioned companies still own assets within EU member states, such as refineries and fuel stations. As a result of the new measures, Lukoil has decided to sell off its foreign assets, including refineries in Bulgaria and Romania.

Jan Strzelecki
Warsaw Region Second in the EU for Employment Rate Among People Aged 20-64
75.8% average employment rate of people aged 20-64 in the EU in 2024
+5.7 p.p. increase in the EU employment rate among people aged 20-64 between 2016 and 2024
-1.9 p.p. decline in the coefficient of variation of the employment rate across EU regions between 2016 and 2024
In 2024, the average employment rate in the European Union reached a record 75.8%, continuing the upward trend observed since the post-pandemic recovery began in 2022. However, regional disparities remain evident, with the EU labour market still divided between high- and low-employment areas. Nearly half of NUTS 2 regions (46.5%) achieved the 78% employment target set out in the European Pillar of Social Rights Action Plan – a 2017 document establishing 20 key principles on employment, social protection, and equal opportunities in the EU. The remaining regions continue to fall short of this benchmark, illustrating persistent regional inequalities in labour market performance across the Union.
The Warsaw Capital Region ranked second in the EU in 2024 in terms of the employment rate among people aged 20-64, reaching 86.2%. Only Finland’s Åland Islands recorded a slightly higher rate (86.4%). At the opposite end of the spectrum are peripheral and economically lagging regions, particularly in southern Europe, for example, Calabria (48,5%), Campania (49.4%), and Sicily (50.7%) in Italy. The gap between the regions with the highest and lowest employment rates thus exceeds 37 percentage points, highlighting the scale of regional labour market inequalities within the EU.
Between 2016 and 2024, the EU employment rate rose by 5.7 percentage points. The fastest growth was observed in Greek regions, where employment rebounded strongly after a deep decline in the previous decade. For instance, in Western Greece, the rate rose by as much as 15.8 p.p., from 51.0% to 66.8%. In Poland, the strongest growth was recorded in the West Pomeranian region (up 12.8 p.p., from 64.8% to 77.6%). A significant decline was noted only in north-eastern Romania (-5.3 p.p.), mainly due to the sharp downturn in 2021, when the COVID-19 pandemic hit the local economy and labour market particularly hard.
Over the past eight years, employment disparities between and within EU member states have gradually narrowed. This is confirmed by the decline in the standard deviation of the logarithm of the employment rate from 0.13 in 2016 to 0.10 in 2024. A reduction of σ by 0.03 points over eight years indicates moderate regional convergence. This trend is also reflected in the 1.9-percentage-point decrease in the coefficient of variation of employment rates across EU regions and within all member states – most notably in Spain, where it fell by 3.4 percentage points.
Recent labour market literature increasingly highlights spillover effects – the phenomenon whereby employment changes in one region affect neighbouring areas. Research by Chocholata and Furkova (2023) shows that such effects are particularly strong in less-developed EU regions, where up to half of total employment changes stem from external influences. Spillovers were observed up to the fourth-order neighbourhood, meaning that impacts extend well beyond direct neighbours. These findings suggest that regional employment differences stem not only from local economic conditions but also from broader spatial interconnections.

Dominika Prudło
Poland Has the Lowest Level of Labour Market Slack in the EU
5.0% labour market slack in Poland
11.7% average labour market slack in the EU
Poland’s labour market slack stands at 5.0%, the lowest level among all EU member states. For comparison, the EU average is 11.7%, corresponding to 26.7 million people aged 15–74 whose work potential remains unused.
Labour market slack refers to the underutilised potential of the labour force. The indicator includes four groups: the unemployed, part-time workers who wish and are available to work more, people available for work but not actively seeking it, and those seeking employment but temporarily unavailable. In practice, it shows the share of the population that could work more hours or take up employment. The lower the level of slack, the tighter the labour market, and in Poland this buffer is currently exceptionally small.
The EU has been steadily reducing its unused labour potential, although significant differences between countries remain. The EU-wide slack rate fell from 18.6% in 2015 to 11.7% in 2024. In Poland, it decreased from 13.1% to 5.0%. The extremes within the Union illustrate this gap: Spain (19.3%), Finland (17.9%), and Sweden (17.8%) report the highest values, while Poland (5.0%), Malta (5.1%), and Slovenia and Hungary (6.3% each) record the lowest.
Among young people (aged 15–24), labour market slack is typically higher than in other age groups. In Poland, it stood at 16.6% in 2024, i.e. slightly below the 2021 level (17.5%) and well below the EU average of 28%. Nevertheless, this figure remains roughly three times higher than the overall slack rate. Young people tend to change jobs more frequently, pursue education, or combine study with work, which partly explains the elevated rate. In Poland, such arrangements are less common than in Western Europe, where part-time employment is more widespread. The highest youth slack rate is found in Sweden (50.1%), and the lowest in the Czech Republic (14.1%) and Germany (14.2%).
Labour reserves in Poland are becoming increasingly limited. In 2024, only 0.2% of the extended labour force consisted of job seekers temporarily unavailable for work, and 1.1% were available but not actively seeking employment. Thus, the largest share of slack comes from the unemployed and underemployed. Across the EU, the share of people available but not seeking work stands at 2.7% – more than twice the Polish level.
These low values indicate that the Polish labour market is now operating close to full capacity. The registered unemployment rate is near the natural rate of unemployment, while hidden reserves such as those economically inactive for caregiving or health reasons are difficult to mobilise quickly. At present, during the post-slowdown recovery period, slight labour market cooling is not a concern. However, as economic activity accelerates, the situation could quickly reverse: soon, it may be labour shortages – not job shortages – that once again become one of the main challenges for Polish businesses and the labour market as a whole.

Sebastian Sajnóg
Polish and European Chemical Industries Follow a Similar Path of Emission Reduction
1,843 PJ (approx. 512 TWh) energy consumption of the chemical and petrochemical industry in the EU in 2023
54 million t CO₂e emissions from the EU chemical industry covered by the EU ETS in 2024
4.8 million t CO₂e emissions from the Polish chemical industry covered by the EU ETS in 2024
The chemical sector is the largest industrial energy consumer and ranks third globally in CO₂ emissions. In 2023, the chemical and petrochemical industries were the largest industrial users of energy in the EU. Their total energy consumption amounted to 1,843 PJ (around 512 TWh), representing 21.5% of the EU’s total final industrial energy use (Eurostat). According to the International Energy Agency (IEA), roughly half of the energy consumed by the chemical subsector is used as feedstock.
Between 2015 and 2021, Poland recorded a slight decline in the emission intensity of its chemical industry while maintaining stable production levels reported by Statistics Poland (GUS), indicating gradual decarbonisation during this period. Since the onset of the energy crisis in 2022, chemical production has followed a downward trend. In 2023, total chemical output amounted to just over 19 million tonnes, compared with nearly 25 million tonnes in 2021 – the highest level in the analysed period. According to the European Environment Agency (EEA), emissions from Poland’s chemical sector fell from 6.9 million t CO₂e in 2021 to 4.3 million t CO₂e in 2023, mainly due to the decline in production. In 2024, the sector emitted 4.8 million t CO₂e. EEA data also show a similar trend line for CO₂e emissions under the EU ETS from the chemical sector across the EU-27. After stabilising at around 70 million t CO₂e between 2015 and 2021, emissions fell to 54 million t CO₂e in 2022-2023, followed by a slight rebound to 58 million t CO₂e in 2024.
The emission structure in Poland mirrors that of the EU. Basic chemicals account for 56% of total emissions, while ammonia represents a further one-quarter. Emissions from all other chemicals constituted only slightly more than 18% of total chemical industry emissions reported under the EU ETS (EEA). At the EU level, of the more than 58 million tonnes of CO₂e emitted by the chemical sector, 51% originated from the production of basic chemicals, while ammonia accounted for 23%.
The similarity in emission trajectories between Poland and the EU indicates that decarbonising the chemical sector is a systemic challenge of comparable scale across member states. Key decarbonisation technologies for basic chemicals production include electrolytic hydrogen, carbon capture and storage (CCS), and direct electrification (IEA). The Agency also highlights the need to increase plastics recycling and improve fertiliser efficiency as important emission-reduction measures. For Poland, an additional challenge lies in the high carbon intensity of the power sector (ARE), which exerts upward pressure on industrial electricity prices. As the carbon intensity of the national energy mix gradually declines, the sector’s Scope 2 emissions will decrease, potentially improving the financial feasibility of decarbonisation projects within the chemical industry.

Krzysztof Krawiec
Poland Benefits from Longer Stays by Foreign Tourists
+5% year-on-year increase in spending by foreign visitors (non-residents) in Poland in 2024
1.8 million number of German tourists who used accommodation facilities in Poland in 2024
PLN 47 billion total spending by foreign tourists in Poland in 2024
72% share of foreigners crossing Poland’s land border who lived within 50 km of the border
Although the number of foreign visitors Poland in 2024 fell by 0.6% year-on-year, their total spending rose by over 5%, according to the latest data from Statistics Poland (GUS). This suggests that foreign visitors (non-residents) are staying longer and spending more on accommodation and food services. In 2024, 7.9 million foreign tourists stayed in accommodation facilities in Poland, accounting for over 20% for all overnight guests (up from 19.5% in 2023). The largest groups came from Germany (around 23%), Ukraine (over 11%), the United Kingdom (just under 9%), the United States (7%), and the Czech Republic (over 5%).
In 2024, foreigners spent PLN 46.6 billion in Poland, while Poles spent PLN 31.1 billion abroad, giving Poland a tourism balance surplus of PLN 15.5 billion. This surplus was mainly driven by the purchases of goods and services by visitors from neighbouring countries, particularly Germany and Ukraine. Shopping was the dominant purpose of visits by foreigners crossing Poland’s land borders (66.5% of cases). On internal EU borders (e.g. with Germany, the Czech Republic, and Slovakia) this share reached 70%, while on external EU borders (Ukraine, Belarus, Russia) it stood at 46.5%. More than 72% of foreign visitors crossing Poland’s land border lived within 50 km of the frontier, and nearly 83% made purchases within that same distance.
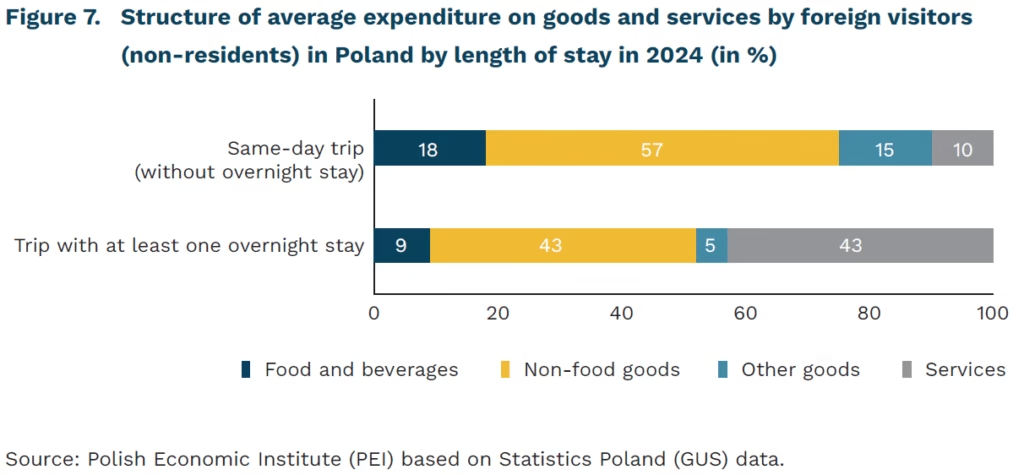
The average expenditure of a foreign visitor spending only one day in Poland amounted to PLN 348 (across all border types). For visitors staying at least one night, average spending reached PLN 1,197 – more than three times that of same-day visitors. Among one-day travellers, 90% of spending went to goods, while for multi-day visitors over half of spending remained on goods, but 43% was allocated to services.
Poland remains an attractive shopping destination for foreigners, especially from neighbouring countries. Within local border traffic, purchases made within 50 km of the border generate revenues vital to border-area economies. However, at the national level, the growing spending of foreign visitors staying longer in Poland signals the potential for developing the tourism and business-services sectors. While Polish tourists spend more money abroad than at home, the average expenditure per person crossing the border in 2024 (PLN 494) was still lower than that of foreign visitors to Poland (PLN 585).
Katarzyna Zybertowicz
Digital Monitoring and Alghorithmic Management – A Step Toward the Taylorisation of Work?
14% share of employees in the EU whose online activity at work is monitored
27% share of employees in Poland whose work schedule is automatically determined by algorithmic systems
37% share of employees in the EU whose working hours are digitally monitored
In the EU, 24% of employees have their work schedules automatically set by algorithmic systems, while one in five have tasks automatically assigned. These are findings from a survey conducted among more than 70,000 respondents across 27 EU countries.
In Poland, 27% of employees have work schedules automatically generated by algorithmic systems, while 40% have tasks automatically assigned – placing Polish workers among the EU leaders, alongside Finland, Spain, and Ireland. In contrast, the lowest shares of employees subject to algorithmic scheduling and task assignment were recorded in Greece, Bulgaria, and Estonia. Other common forms of algorithmic management across the EU include automated rewards (13%), automated performance evaluations (12%), and automated task instructions (10%).
Across the EU, 37% of employees have their working hours digitally monitored, 36% use access cards tracking entry, exit, or movement, and 14% have their online activity monitored at work. An identical share (14%) are monitored through workplace CCTV, while 12% report surveillance of phone calls or emails. The highest rates of digital time-tracking were observed in Slovenia (57%) and Spain (54%), while access-card tracking was most common in Slovakia, the Czech Republic, and Slovenia (57%, 57%, and 54% respectively). Internet monitoring is most prevalent in the Czech Republic, Poland, Romania, Malta, and Luxembourg (22-25%). By contrast, the lowest levels of digital monitoring across these categories were reported in Northern and Central European countries (including Sweden, the Netherlands, Germany, Denmark, and Hungary) as well as Greece.
Employees who were ‘fully platformised’, i.e. subject to all five dimensions of digital monitoring and algorithmic management identified in the study, had the least autonomy and flexibility, and the lowest incomes. Paradoxically, workers who were not exposed to these technologies at all were also in a relatively disadvantaged position, but the key difference lay in stress levels: they were the highest among fully platformised employees and the lowest among those not using digital tools.
While the use of such technologies can enhance economic efficiency, in practice it may also lead to deteriorating job quality. As these systems both reflect and amplify power asymmetries between management and employees, their large-scale adoption should be accompanied by vigilance and, where necessary, appropriate regulatory oversight from labour protection institutions.

Filip Leśniewicz
The Economic Costs of Obesity and Overweight
64.5% share of adult Poles affected by obesity or overweight
4.86% of GDP projected economic costs of obesity and overweight in Poland by 2060
8% share of OECD countries’ annual health budgets spent on treating obesity-related complications
Obesity and overweight already affect 64.5% of adult Poles – 26.8% are classified as obese and 37.7% as overweight. These alarming figures, published in October 2025 by the National Health Fund (NFZ), are based on analyses covering 13.4 million adult primary healthcare patients whose Body Mass Index (BMI) was calculated to assess the scale of the problem.
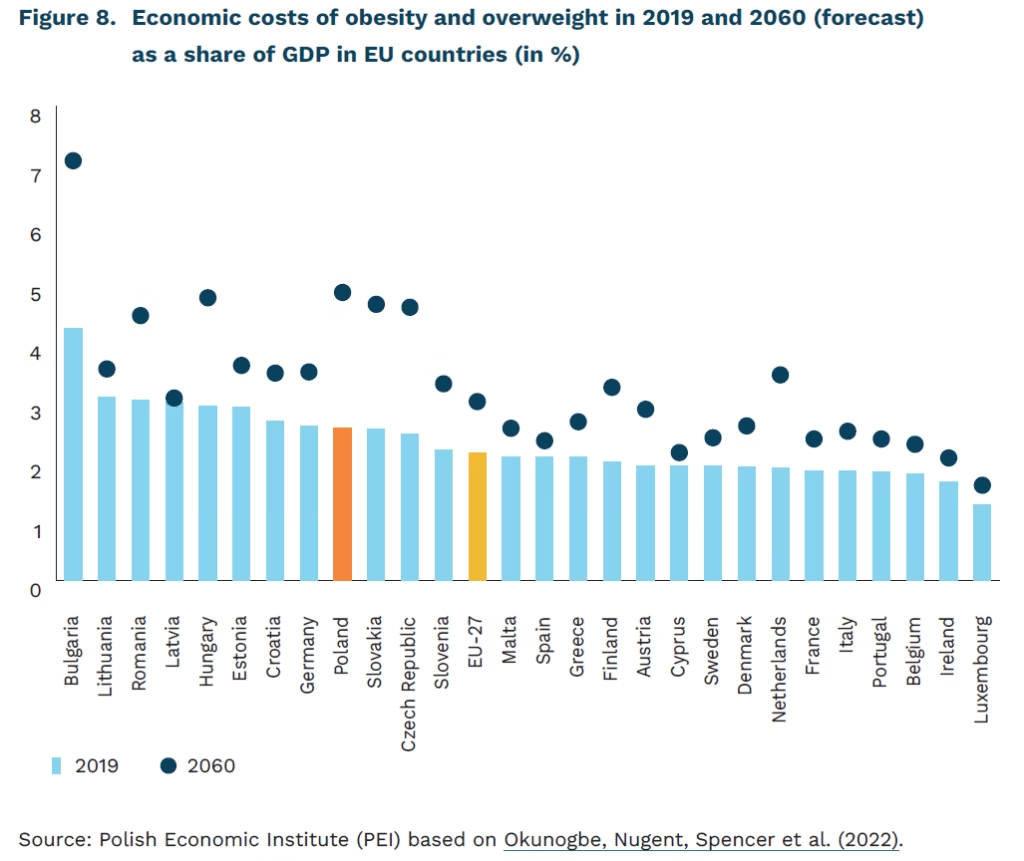
Obesity and overweight are not only an urgent public-health issue but also a significant burden on the world economy. A study covering 161 countries estimated that in 2019 the economic costs of obesity and overweight amounted to 2.19% of global GDP, with the United States alone accounting for nearly 38% of total global costs. If current trends continue, these costs are expected to rise to 3.29% of global GDP by 2060. In the European Union, their share of GDP is projected to increase from 2.16% in 2019 to 3.02% in 2060.
In Poland, the economic costs of obesity and overweight were equivalent to 2.58% of GDP in 2019. By 2060, they are forecast to rise to 4.86% of GDP – the second-highest level among EU member states, just behind Bulgaria, where costs are estimated to reach 7.08% of GDP.
The largest increase in total economic costs will occur in low- and middle-income countries, where they could rise as much as 25-fold. This stems from rapid socio-economic transformation, including accelerated urbanisation, a shift toward sedentary, office- based work, and declining levels of physical activity. These countries are also characterised by high-calorie diets rich in fats, sugars, and salt, but poor in essential nutrients.
Obesity and overweight are an escalating challenge for public finances. Estimates suggest that between 2020 and 2050, OECD countries will allocate up to 8% of their healthcare budgets to treating obesity-related complications. In response to the growing problem, many governments have begun implementing public-policy tools such as taxation, food-labelling schemes, and community interventions. Examples include taxes on products high in fat, sugar, and salt (HFSS), which exist in various forms in twelve EU member states. The European Commission is currently considering harmonising these measures at the EU level.
Hubert Pliszka