
Economic Weekly 44/2026, November, 6, 2026
Published: 06/11/2026
Table of contents
Large firms pay late less and less often, yet still wait for their money
26% of the value of receivables reached large firms after the due date (2023-2025)
58% of large firms rate payment backlogs as a barrier that seriously hampers business activity in 2026
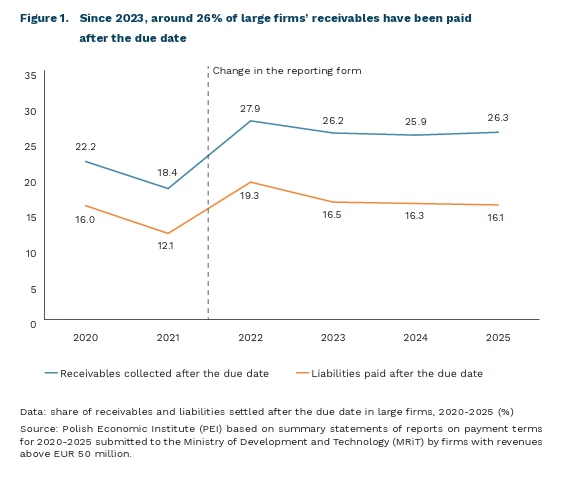
Since 2023, large firms have received around 26% of the value of their receivables after the due date, and this share has barely changed. This is shown by the summary statements of reports on payment terms applied submitted every year by corporate income tax (CIT) payers with revenues above EUR 50 million [1]. In 2025, around PLN 718 billion reached these firms after the due date, while they themselves paid around PLN 404 billion late. Their own delays (around 16% of the value of liabilities) are close to the Polish average. According to Dun & Bradstreet, around 14% of the value of invoices in Poland is paid late – less than, for example, in Germany, where more than a third of payments are delayed.
Late inflows were lowest in 2021, and a year later their share rose markedly. In 2021, 18.4% of the value of receivables arrived after the due date, compared with 22.2% in 2020, probably helped by firms’ high liquidity following the pandemic support programmes and record-low interest rates. In 2022, during the inflation shock, the share rose from 22.3% to 26.3% within the same group of firms, although part of this change reflects the new reporting form.
Large firms paid their suppliers late less and less often, but were still waiting for money from their customers. The share of their liabilities paid after the due date fell from 19.3% in 2022 to around 16% in 2024-2025, while the share of late receivables remained at around 26%. Since 2024, both indicators have barely changed. Almost all firms (99%) pay at least some of their bills late, but only one in seven (15%) is late with more than half of its liabilities. The value of late payments is concentrated: 10% of firms, mostly the largest ones, account for 57% of it. Delays do not necessarily mean liquidity problems. According to the NBP Quick Monitoring survey, in Q3 2026, 88.9% of large firms had no problems meeting their current liabilities.
In 2026, payment backlogs are weighing ever more heavily on large firms – according to PEI surveys conducted for the Monthly Business Sentiment Index (MIK). In 2022-2025, an average of 41% of the large firms surveyed considered them a significant barrier to their activity, compared with an average of 58% in January–October 2026. Over the same period, large firms also rated other barriers higher, especially economic uncertainty and energy prices, so the growing burden of payment backlogs is part of a broader deterioration in their sentiment. The reports for 2026 will show whether late inflows have also increased, although the two sources should be compared with caution: MIK measures the perceived burden of payment backlogs, whereas the reports show the value of late payments and use a different definition of large firms.
Concerns about payment backlogs can harm firms and the economy even if the scale of delays does not change. A company that expects late inflows has to hold more cash in reserve, shortens trade credit, more often requires prepayment or sells its receivables to factoring companies – and each of these solutions comes at a cost. The problem grows when large firms, defending their own liquidity, start delaying payments themselves. The burden then shifts to smaller suppliers, for whom bank credit is harder to obtain and more expensive. For the economy as a whole, this means slower circulation of money, lower investment and a higher risk of bankruptcy along supply chains. It is therefore worth monitoring both hard data on delays and business sentiment – the latter may anticipate changes in payments.
- Article 13a of the Act on Counteracting Excessive Delays in Commercial Transactions. The obligation was introduced in 2020, and the MRiT publishes summary statements of the reports. After removing erroneous records, the analysis covered between 2.3 thousand and 3.4 thousand reports per year.
Katarzyna Dębkowska
Reinvested earnings sustain investment inflows into Poland
106% of FDI inflows into Poland in 2025 consisted of reinvested earnings
94% of FDI inflows into Central and Eastern European countries in 2025 consisted of reinvested earnings
56% of total earnings generated in 2019-2025 were retained by investors in Polish companies (the highest share in the region)
In 2025, foreign direct investment (FDI) in Poland amounted to USD 17.4 billion and relied primarily on the reinvested earnings of foreign companies. This is the portion of earnings that subsidiaries of foreign enterprises did not distribute as dividends to foreign investors. This category is recorded in the statistics as a new inflow, although technically the capital does not cross the border but remains in the subsidiary. These reinvested earnings increased by 26% year on year in 2025, from USD 14.7 billion to USD 18.5 billion, exceeding the total value of FDI. The other two components of FDI inflows reduced the overall balance by approximately USD 1.0 billion: inflows of new equity capital amounted to USD 4.3 billion, while the balance of debt instruments, i.e. transactions within corporate groups, reached USD -5.4 billion.
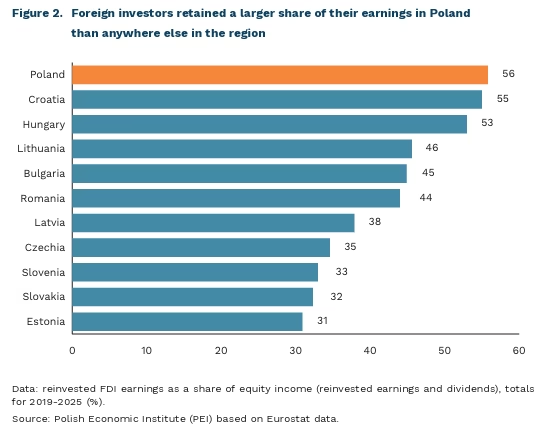
In terms of the importance of reinvested earnings, Poland is no exception in the region. According to data compiled by wiiw, reinvested earnings also exceeded total FDI inflows in Bulgaria, Czechia, Slovakia and Hungary in 2025. Across the 11 Central and Eastern European countries, they accounted for 94% of inflows. Such a high share largely reflects the weakening of the other components. For example, new capital (shares and other forms of equity) accounts for only 6% of FDI inflows into the region, the lowest share in over a decade. What has distinguished Poland for years, however, is that investors retain a large share of their earnings in companies rather than distribute them as dividends. According to Eurostat data, this share was 56% in 2019-2025, compared with 55% in Croatia or 35% in Czechia.
A high level of reinvested earnings may indicate investor confidence in Poland, but on its own it is a weak measure of investment attractiveness. The enormous stock of foreign investment accumulated in Poland over the years means that subsidiaries’ operations generate substantial earnings. Therefore, even despite decisions to pay dividends to parent companies, a significant amount would remain in subsidiaries in Poland. An increase in the value of reinvested earnings does not therefore necessarily mean a greater willingness to retain income in Poland: the value of reinvested earnings increased by USD 4 billion, only slightly more than dividends paid (by USD 3.5 billion). The ratio of reinvested earnings to dividends paid remained virtually unchanged in 2025 compared with 2024.
At the same time, the increase in the share of reinvested earnings in total FDI in 2025 resulted from a decline in the other flows classified as FDI – equity and debt instruments. This indicates stagnation in new FDI inflows into Poland. In FDI statistics, reinvested earnings are the undistributed portion of earnings attributable to direct investors, rather than the value of investment actually undertaken. Retained earnings may be used for actual investment understood as the expansion of production capacity, i.e. the construction of a new plant or the expansion of an existing one, but they may equally be used for other purposes – held as a financial buffer, paid to employees or lent to another company within the group. The tangible benefits of reinvested earnings ultimately depend on whether they translate into new production capacity or new capabilities, and FDI data do not capture this.
Dominik Kopiński, Marek Wąsiński
Spending on layoffs is rising, and the structure of sick leave is changing
0.9% of GDP that was the equivalent of expenditures on sick leave benefits and wages in 2025
by 182.8% the number of days of absence due to mental disorders increased between the third quarter of 2012 and the third quarter of 2026
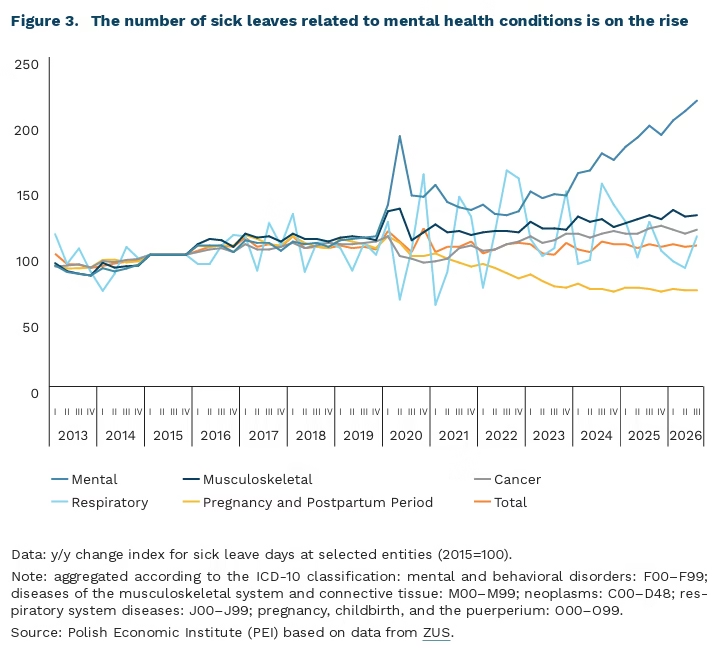
In 2025, spending on sickness benefits and sick pay totaled 34.9 billion PLN, which was 12.4% more than the previous year. Payments for periods of incapacity for work thus amounted to approximately 0.9% of GDP. Sick leave certificates were most frequently issued for periods of up to 5 days and accounted for 43.9% of all such certificates. In contrast, the average duration of sick leave was 10.82 days. Over the past dozen or so years, the causes of absenteeism have also changed. The majority of sick leave days are now attributed to mental disorders and musculoskeletal disorders, while a smaller proportion is attributed to, among other things, pregnancy, childbirth, and the postpartum period.
Over the past dozen or so years, not only has the scale of absenteeism changed, but so has its structure. Between the third quarter of 2012 and the third quarter of 2026, the number of sick days increased by 20.0%, and the number of sick leave certificates by 35.2%. (Comparing the same quarters minimizes the impact of seasonality.) The increase in the number of sick leave certificates issued cannot be fully explained by the 9.9% rise in the number of employed individuals alone. Among the most common conditions are musculoskeletal and connective tissue disorders, which accounted for 18.5% of days of absence, compared to 14.0% fourteen years earlier. Within this group, the number of days of absence due to joint diseases increased by 74.4%, spinal disorders by 46.8%, and other conditions by 71.8%. Absences related to cancer increased by 37.4%, and those related to respiratory diseases by 19.9%.
Among the groups compared, absenteeism related to mental disorders and behavioral issues saw the sharpest increase. The number of days of such absences increased from 3.4 million to 9.6 million, or by 182.8%, and their share of total absences rose from 7.1% to 16.8%. The number of medical certificates increased by 144.9 %. In contrast, the number of sick leave days related to depressive episodes and recurrent depression rose by 126.1%, those related to anxiety disorders by 444.7%, and those related to reactions to severe stress and adjustment disorders by 344.5%. In the third quarter of 2026, each medical certificate for mental disorders corresponded to an average of 19.7 days of sick leave, compared to 11.8 days for all causes. The growing significance of this group thus stems from both the number of certificates and the relatively long periods of incapacity for work.
In contrast, the significance of absences related to pregnancy, childbirth, and the postpartum period has decreased. The number of sick days in this category fell by 16.2%, and its share of total absences dropped from 19.5% to 13.6%. This trend is consistent with demographic processes: the number of live births has decreased from approximately 386,000 in 2012 to approximately 238,000 in 2025 (a 38.4% decline). Thus, the number of births alone does not fully explain the changes in absenteeism, which also depend on women’s labor force participation and insurance coverage. Decreases in the number of days were also observed for diseases of the nervous system (by 27.4%) and the circulatory system (by 18.7%).
Changes in the scale and structure of absenteeism should be viewed in the context of social and demographic trends, as well as the growing number of people covered by insurance. Between the second quarter of 2012 and the second quarter of 2026, the number of people covered by sickness insurance increased from 13.23 million to 14.54 million, or by 9.9%. The available tables do not yet include a comparable figure for the third quarter of 2026. The changes in the number of days and certificates presented here refer to total figures, without adjustment for the number of insured persons. In the long term, however, the increase in the number of sick leaves was also accompanied by a marked change in their structure – the majority of days of absence are now accounted for by sick leaves related to mental disorders and musculoskeletal disorders.
Sebastian Sajnóg
As societies age, the number of people paying the highest taxes is shrinking
about 2 percentage points of GDP lower: Poland’s tax revenue under the population age structure projected for 2060
about 50% of taxes in OECD countries in 2022 were paid by people aged 35-60
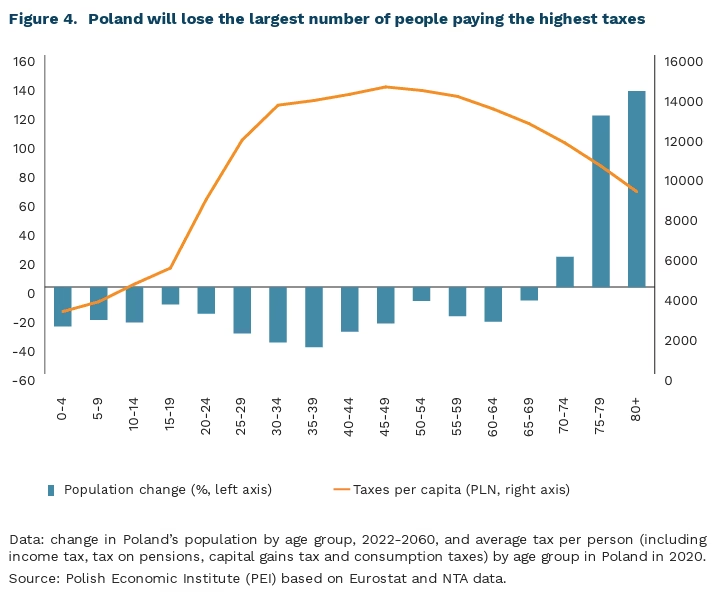
Population ageing will reduce government tax revenue. According to the latest OECD analysis, shifts in age structure across OECD countries will lower the tax-to-GDP ratio by about 1 percentage point by 2060. In Poland, the projected decline could reach about 2 precentage points. The OECD estimates that this will be driven by a fall in the total value of tax revenue. The projection assumes that current tax rules stay in place and that population size remains at today’s level. Only the age structure of the population changes.
The main reason for the decline in tax revenue will be the shrinking share of people aged 35-60 in the population. In OECD countries, people in this age group currently account for about 50% of total tax revenue. Over the life cycle, the average amount of tax paid per person rises steeply between ages 20 and 40, peaks at around 50-54, and then gradually declines. Meanwhile, by 2060, the number of people aged 20-64 in Poland will fall from 22.9 million to 16.5 million, and their share of the population will drop from about 60% to just under 50%. Over the same period, the number of people aged 65 and over will rise from 7.3 million to 10.9 million, and their share of the population from 19% to nearly 33%. By comparison, the share of people aged 20-64 across OECD countries will fall on average from 57% to 53%.
Tax revenue will decline through two channels: lower revenue from taxes on wages and, in Poland, also from consumption taxes. People aged 35-60 pay the most tax in value terms mainly because they are in work and earn the highest incomes. A smaller cohort in this age group therefore means, first and foremost, a narrower base of people paying income tax and social contributions. The second channel is consumption. In OECD countries, private consumption per person is highest at ages 60-70, which is why VAT revenue there is considered relatively resilient to ageing. Poland is different: research shows that consumption peaks among people aged 27-38 and is lower in older age groups. In Poland, a shrinking share of working-age people therefore also means lower aggregate consumption and lower VAT revenue.
In Poland, growth in other tax bases will do little to offset these losses. Ageing shifts tax bases towards pensions and wealth. In OECD countries, capital income peaks at ages 65-70, and the wealth of people over 80 is only about 20% lower than at its lifetime peak. In Poland, however, the potential of these bases is limited. According to European Commission projections, the ratio of the average pension to the average wage will fall from 58% in 2022 to 27% in 2060. With a tax-free allowance of PLN 30,000 a year, low pensions generate no PIT revenue. The wealth of older Poles is held mainly as housing, which is taxed by floor area, not by value. In addition, inheritances within the immediate family are tax-exempt. We therefore cannot expect significant tax revenue from the growing share of people of retirement age.
The greatest potential for softening the fiscal effects of ageing lies in longer working lives. Higher labour force participation among people over 60 could partly offset the loss of working-age taxpayers. In Poland, where people leave the labour market relatively early, this reserve is considerable. How much it adds to budget revenue, however, also depends on how taxes are designed, including the rules for taxing working seniors. The scale of the pressure that ageing puts on public finances will therefore depend not only on demographics but also on how far the tax system captures the bases that grow as the population ages.
Paula Kukołowicz
The EU and Canada are deepening cooperation to reduce dependence on the US and China
EUR 130 billion was the value of trade in goods and services between the EU and Canada in 2025.
by 80% has grown the value of trade in goods and services between the EU and Canada since 2016
almost 70% of Canadian exports still go to the US
The EU and Canada plan to deepen cooperation because they want to limit their dependence on China and the US. Canadian Prime Minister Mark Carney argues that middle powers should start cooperating with each other, instead of trying to negotiate separately with much stronger powers such as China or the US. The cooling of relations with the US in particular has a concrete dimension for Canada. Almost 70% of Canada’s exports go to the US, which, in light of deteriorating relations with Washington and tariff threats, is a real economic problem. For Canada, the European Union is to be one of the pillars of the “third way” being built by Carney, enabling it to increase its own autonomy and negotiating power vis-à-vis the largest states.
Another step bringing the EU and Canada closer is the Alliance for the Future partnership programme being launched at the summit in Montreal on 29-30 October, covering trade, critical raw materials, digitalisation, energy, defence and research. The value of trade between the EU and Canada amounted to approx. EUR 130 billion in 2025, which is 80% more than in 2016. From the EU’s point of view, however, the greatest importance lies in access to Canadian raw materials, energy and defence industry. Canada has resources of minerals needed in, among other things, energy, electronics and arms production, which is why the EU and Canada want to accelerate joint investments in their extraction, processing and refining. This formula of cooperation is also to include other states and go beyond EU–Canada cooperation.
In the digital area, the EU and Canada have concluded negotiations on a digital trade agreement and announced closer cooperation in the area of AI, cybersecurity, infrastructure and critical raw materials. Canada is joining EuroHPC (the EU initiative for developing very high-performance computing systems), and the parties want to work on mutual recognition of conformity assessments for AI systems, cybersecurity and digital identity. A tangible result of this cooperation is the CAD 1.6 billion investment in the merger of a European-Canadian company that is to develop sovereign AI. A new submarine cable between Canada and Europe has also been announced. Digital cooperation is to expand European technological capabilities and reduce dependence on a narrow group of suppliers. For the EU, rapprochement with Canada should be more a way of strengthening its position vis-à-vis the US and China than an attempt to become independent of both powers at the same time. Canada will not replace the US for Europe in security and technology, nor China in supply chains, but it can increase the number of available alternatives. A strategy of cutting itself off from China and the US at the same time would be costly and risky. Rapprochement with Europe is today more a need for Canada than for the EU. For Europe, the greatest benefit may therefore be not building a separate bloc competing with Washington, but increasing its own negotiating power.
Krystian Łukasik
The expansion of family policies reduces gender gaps in the labour market
19.6 percentage points decrease in the child employment penalty between 1990 and 2019 across the 12 countries studied that introduced family-friendly policies
24-33% the estimated impact of the expansion of family policies on reducing employment and wage gaps across the 27 OECD countries studied
46-76% the estimated impact of the expansions of family policies on reducing child employment and wage penalties
The expansion of policies facilitating the reconciliation of parental responsibilities with professional life has contributed to reducing gender inequalities in labour market participation and earnings. This effect is strongest in relation to inequalities arising from the arrival of a child in the household and the associated caregiving responsibilities (the socalled child penalty). These are the findings of a recent study based on data from 27 OECD countries covering the period 1986-2019.
The average employment gap attributable to caregiving responsibilities in the 12 countries examined decreased by 19.6 percentage points between 1990 and 2019, while the overall employment gap across OECD countries declined by 17.5 percentage points over the same period. The impact of parental leave policies, parental benefits and opportunities for part-time work on reducing gender inequalities in the labour market accounts for approximately 24-33% of the reduction in employment and earnings inequalities, and as much as 46-76% of the reduction in the same types of inequalities attributable to parenthood. The analysis also confirms that the later development and more limited scope of family-friendly policies in the United States contributed to a smaller reduction in gender inequalities.
Longer parental leave reduces wage, earnings and employment gaps, as well as child penalties in these outcomes. This effect is more pronounced among women with lower levels of education, but is reversed when leave is extended excessively [2]. Among more highly educated women, longer parental leave is associated with a wider gender pay gap. For both education groups, extending parental leave increases women’s likelihood of working part-time. The authors explain this by the positive effect of parental leave on employee attachment to employers, which outweighs its negative consequences, namely a reduced propensity to participate in employment.
The availability of part-time work increases the proportion of women taking up this option, thereby widening the gender wage gap while reducing gender inequalities in employment and earnings. The consequences of part-time work are therefore mixed in terms of gender inequality. However, its positive effect on reducing the earnings gap suggests that the reduction in the employment gap outweighs the widening of the wage gap.
The strongest and consistently positive impact on reducing gender inequalities across all the categories examined was identified in government spending on childcare. Such expenditure not only increases women’s relative employment rates but also raises their share among full-time employees. In addition, financial support for childcare particularly increases the earnings of women with higher levels of education. This is consistent with findings from other studies showing that the costs of career interruptions are higher for women in better-paid positions.
These findings point to a complex relationship between the extent of parental benefits and women’s labour market position. The actual effects of paid parental leave depend on both the institutional context (particularly the availability of childcare funding) and individual circumstances (especially educational attainment). Poland represents an interesting case in this context, as it combines relatively generous family benefits and workplace entitlements with persistent, relatively high levels of gender inequality in labour market outcomes, particularly in terms of the so-called motherhood penalty. The study’s demonstration of the significant role played by the state in supporting women with the care of young children suggests that improving childcare accessibility – both institutional and financial – could make a substantial contribution to helping women reconcile family responsibilities with employment.
Agnieszka Wincewicz-Price
