Economic Weekly 45/2025, November 13, 2025
Published: 14/11/2025
Table of contents
Inflation Declines While Growth Prospects Remain Stable
4.25% current NBP reference rate following the Monetary Policy Council’s November decision
2.9% core inflation in October, the lowest reading since November 2019
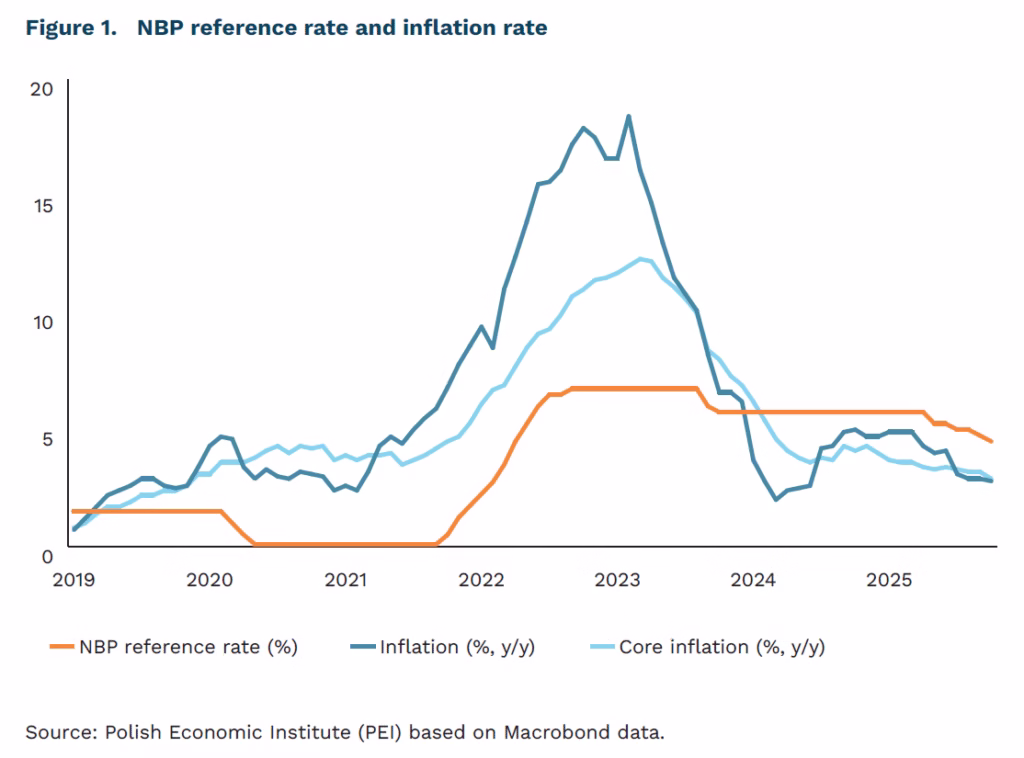
Interest rates down, inflation within the NBP target range. In November, the Monetary Policy Council (MPC) cut interest rates by 25 basis points to 4.25%, marking the fourth consecutive reduction and effectively continuing the easing cycle. However, the Council continues to describe its actions as an ‘adjustment of the interest rate level’, avoiding the term ‘monetary policy easing’. The November decision was supported by lower-than-expected inflation data – the flash CPI estimate for October stood at 2.8% y/y versus the forecast of 3.0%. Importantly, core inflation (excluding food and energy prices) is estimated at around 2.9%. If confirmed by the NBP, this would be the lowest level in six years, since November 2019.
NBP’s new projection: inflation near target, growth steady. According to the November projection, the economy is close to equilibrium – with inflation near target and moderate but sustained growth. The central CPI path assumes 3.7% in 2025, 2.9% in 2026 and 2.5% in 2027, accompanied by GDP growth of 3.4%, 3.7% and 2.6% respectively. The higher figure in 2026 reflects the delayed implementation of some EU co-funded investment projects. Compared with the July projection, the inflation path was revised downward, while the GDP growth forecast for 2026 was raised.
Energy costs less threatening in the short term. Risks related to energy prices are weakening in the short term, though they remain relevant over the medium horizon. The government extended the electricity tariff freeze through Q4 2025, which helped ease CPI pressure. At the same time, the NBP stresses that the planned introduction of the ETS2 system could add a cumulative 2 percentage points to inflation by 2027. This means that energy-related risks have not disappeared but have merely shifted over time.
Monetary policy remains relatively tight. After a total of 150 basis points in rate cuts between May and November, the MPC will likely pause the cycle, awaiting new data on inflation and economic conditions. At the post-meeting press conference, the NBP President noted that the 4.0% level could be considered appropriate for the Polish economy under current conditions. Markets interpreted this statement as a moderately hawkish signal. With inflation near the target, Poland’s real interest rate remains positive, indicating that monetary policy is still moderately restrictive. This provides room for further adjustments in the future – potentially in 2026.
Sebastian Sajnóg
U.S. Diplomatic Offensive in Asia to Unlock Trade in Rare Earth Elements
70% U.S. demand for rare earth elements (REE) met through imports from China between 2020 and 2023
94% China’s share in global production of permanent magnets
10% planned reduction in U.S. ‘fentanyl tariffs’ in exchange for deferring export controls on REE
Donald Trump’s recent tour of Asia resulted in resulted in the signing of several agreements and memoranda of understanding on critical raw materials and rare earth elements (REE) with Cambodia, South Korea, Japan, Malaysia and Thailand. Cooperation with Malaysia is of particular importance, as the country ranks second globally in REE processing (4% share), while Japan is the largest producer of permanent magnets after China (also 4% of global output). The REE category, comprising 17 elements essential for modern military and industrial technologies, is not “rare” in terms of occurrence but difficult and costly to extract. Mining and refining these elements require high energy input and generate considerable environmental costs.
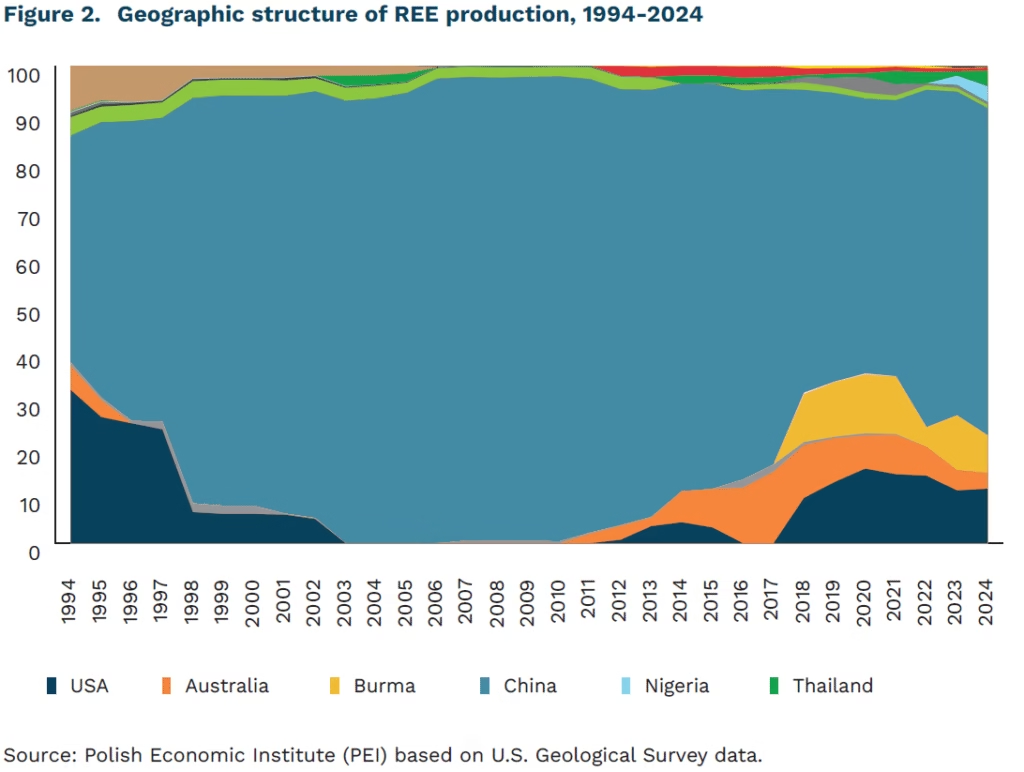
The United States remains heavily dependent on imports of REE, with as much as 70% of supply between 2020 and 2023 coming from China. The U.S. currently has only one permanent magnet manufacturer (Neveon Magnetic) and one REE mine (Mountain Pass in California). Due to limited domestic processing capacity, REE concentrate is sent to China for further separation and refining. China today accounts for 59% of global REE mining, 91% of processing, and 94% of permanent magnet production.
A possible breakthrough in reopening REE trade followed Trump’s meeting with Xi Jinping. Beijing agreed to postpone for one year the export restrictions on REE announced on 9 October, in exchange for the reduction of U.S. ‘fentanyl tariffs’ from 20% to 10%. The planned Chinese restrictions would have covered not only an expanded list of twelve elements (including holmium, erbium, thulium, europium and ytterbium) but also all parts and components containing Chinese REE, as well as processing technologies.
Despite White House assurances, it remains unclear whether the agreement also covers export controls introduced on 4 April this year. That decision, concerning seven elements (samarium, gadolinium, terbium, dysprosium, lutetium, scandium and yttrium), their derivatives, and permanent magnets, caused major disruptions in several industries, particularly automotive. The U.S. administration has twice, following negotiations in Geneva in May and London in June, declared success in unblocking REE exports, yet Beijing continues to ‘weaponise’ raw materials trade, forcing concessions from both the U.S. and Europe. The durability of the U.S.–China arrangement therefore remains uncertain, especially as China officially frames export controls as a systemic measure and part of its international security architecture. It is also unclear whether and to what extent these restrictions apply to exports of REE to the European Union.
Dominik Kopiński
Europe Seeks to Rebuild Technological Sovereignty
0.8 Poland’s technological dependence level on a 0-1 scale
15% share of European providers in the EU cloud computing market
On 18 November in Berlin, the European Digital Sovereignty Summit will take place – an event devoted to one of the central themes in the discussion on supporting Europe’s economy in the third decade of the 21st century. Digital, or more broadly technological, sovereignty has become a key concept in the European Union following a series of crises: the COVID-19 pandemic (shortages of medical supplies and semiconductor disruptions), Russia’s full-scale invasion of Ukraine (dependence on energy resources and military equipment), and the early months of Donald Trump’s second term (threats to restrict technology access and challenges to Europe’s regulatory autonomy).
At the heart of current debates lies the concept of the technological stack – a framework illustrating how certain technological layers depend on others. Applications cannot function without data and telecommunications networks, which in turn rely on data centres and hardware, including semiconductors. To manufacture those, access to energy, raw materials, and processing capabilities is indispensable.
The main challenge for Europe is its heavy dependence on non-European entities in most layers of the technological stack. The EU accounts for only about 10% of the global semiconductor market and around 15% of the cloud computing market. When it comes to mobile and desktop devices or app distribution, dependence is nearly total. Only in the domain of network communication can Europe claim relative sovereignty – the key telecom operators and network equipment manufacturers are European.
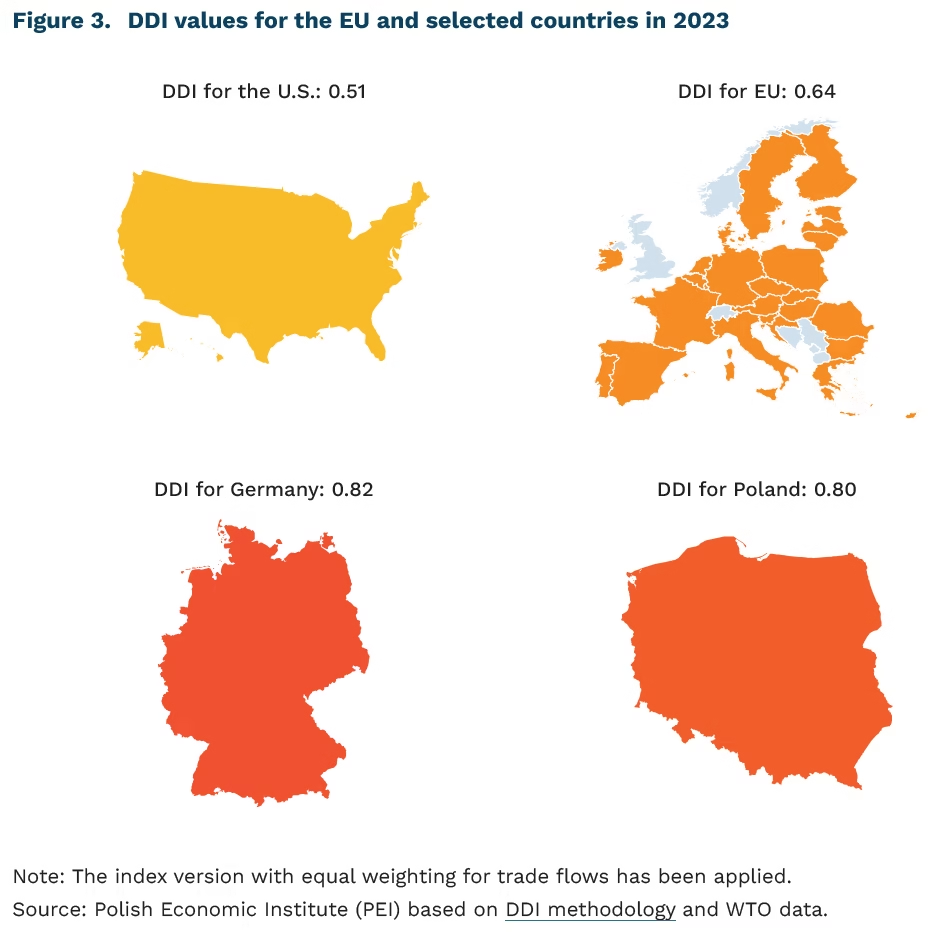
There are no universally accepted, quantitative measures for determining how technologically sovereign a country or region is. Existing studies usually focus on specific layers, for instance, the European Commission maintains detailed methodologies on import dependence. One of the few multidimensional indicators, the Digital Dependence Index (DDI), covers only selected countries but confirms the intuitive picture: Europe is more dependent than the United States. The index combines trade dependence, infrastructure, hardware and software ownership, and intellectual property indicators. Its values range from 0 (autarky) to 1 (total dependence). Scores above 0.8, recorded in 2023 for Poland and Germany, indicate a high level of vulnerability – where foreign suppliers hold a dominant position in technology domains. Values between 0.5 and 0.75, as observed for the EU as a whole and for the U.S., reflect low vulnerability, although most technologies are still imported. Notably, in 2019 the U.S. dependence level stood at 0.47, within the high sensitivity range.
The Berlin summit, organised by France and Germany, aims to strengthen cooperation on European technological sovereignty. Both countries have already begun translating this concept into practice: France requires specific certification for cloud service procurement, while Germany is developing an open-source alternative to the most popular office software suite. Both are also members of the European Commission’s consortium for digital infrastructure. For less-engaged member states, the summit provides an opportunity to join the mainstream debate and influence its direction. Significant funding will follow these declarations – through public procurement and the forthcoming EU financial framework. Achieving technological sovereignty will be costly, making it all the more important to secure a place at the table where the related policy decisions are made.
Ignacy Święcicki, Jakub Witczak
A Growing Number of International Students in Poland
8.5% share of foreign students in Poland’s total student population
27% foreign students enrolled in business and administration programmes
44% Ukrainian citizens among all international students at Polish universities
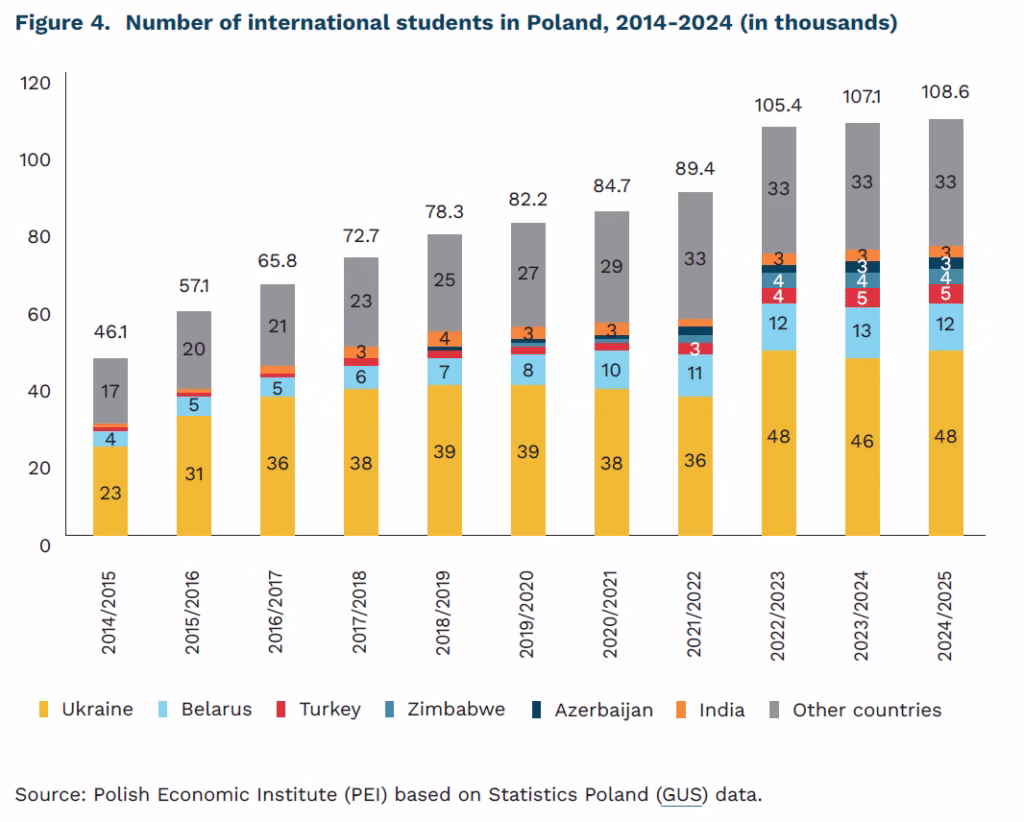
In the 2024/2025 academic year, over 108,000 foreign students were enrolled at Polish universities, accounting for 8.5% of all students. Over the past decade – since the 2014/2015 academic year – their number has almost 2.5-fold increased, while their share in total enrolment has grown by 5.4 percentage points. This means that the proportion of international students in Poland has now surpassed both the OECD average (6% in 2022) and the EU average (8%). Ten years ago, Poland’s share was below both benchmarks.
The majority of foreign students in Poland study business and administration (27%). Many also choose social sciences (14%), medicine (12%), and information and communication technologies (8%). These three groups are also the most popular among Polish students, though the dominance of business-related programmes is much smaller among Poles (18% vs. 27%). By contrast, Polish students are more likely to choose education- related programmes (6% vs. 2%).
Most international students (53%) are enrolled at non-public universities – a reversal of the trend seen a decade ago, when 42% studied at such institutions. In the 2024/2025 academic year, the average share of international students in public universities was around 6.7%, though some institutions far exceeded this level (e.g. Pomeranian University in Słupsk – 22%; Maritime University of Szczecin – 19%; Academy of Music in Poznań – 15%; Academy of Music in Kraków – 14%).
Ukrainians make up the largest group of foreign students in Poland – 48,000 in the 2024/2025 academic year. Although their absolute number has doubled over the past decade, their share has fallen from 51% in 2014/2015 to 44% in 2024/2025. The second-largest group consists of Belarusians (11%, or 12,000 students). For the fourth consecutive year, Turkish students rank third (4.7%, or 5,000 students), representing a fivefold increase over the past decade.
Over the last ten years, the composition of Poland’s international student body has evolved significantly. In 2014/2015, apart from Ukrainians and Belarusians, most came from other European countries. Today, there is a marked rise in students from Asia (India, Azerbaijan, China, Uzbekistan) and Africa (especially Zimbabwe and Nigeria). Meanwhile, the share of students of Polish origin exempt from tuition fees at public universities has been steadily falling – from 13.5% a decade ago to just 5.1% today.
Anna Szymańska
Daily Mobility in Poland Is Dominated by Short Car Trips
2.6 average number of trips per household member travelling within Poland on a typical working day in 2024
76.3% share of household members who made at least one trip in 2024
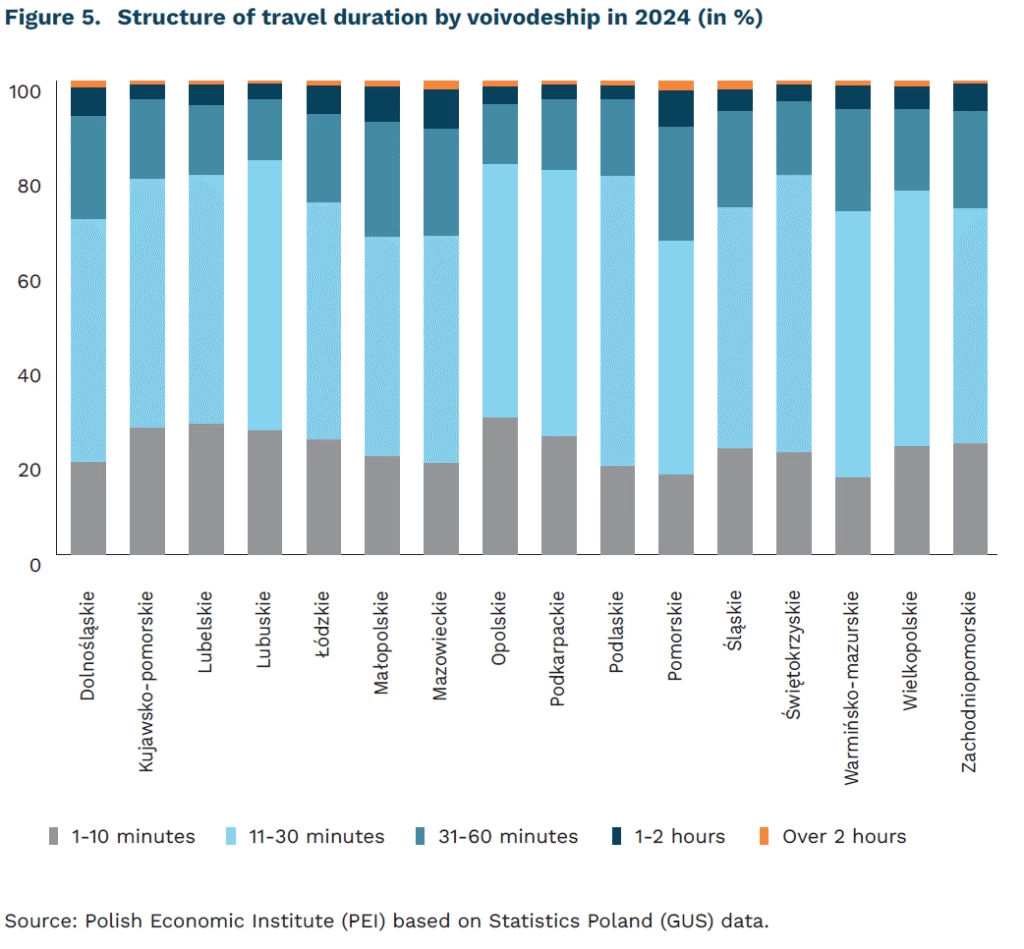
almost 75% share of all trips in 2024 lasting no longer than 30 minutes
In 2024, transport-related mobility in Poland was predominantly short-distance. According to Statistics Poland (GUS), 97.5% of the 65.3 million trips recorded were single-stage journeys, 60% of which were made by car. Two-stage trips accounted for 2% of all trips, and those with three or more stages – just 0.5%. Among household members aged six and over, 76.3% made at least one trip, meaning that 23.7% did not travel at all. Nearly half of those who did not travel cited health reasons as the main cause of inactivity.
A total of 73.7% of the trips analysed lasted no more than 30 minutes, suggesting that most mobility had a local character. The highest shares of very short trips (up to 10 minutes) were observed in the Lubuskie, Świętokrzyskie and Podlaskie voivodeships. In contrast, the highest proportions of trips lasting between 31 and 60 minutes were found in Mazowieckie, Małopolskie, Śląskie and Wielkopolskie. The longest travel times (1-2 hours and over 2 hours) were also most common in Mazowieckie and Małopolskie, likely reflecting commuting between metropolitan cores and surrounding counties.
On a typical working day, the highest share of people who did not travel because they worked or studied from home was recorded in the Mazowieckie voivodeship, where they accounted for 23.5% of all non-travellers. High values of this indicator were also noted in Małopolskie (13.5%) and Wielkopolskie (11.1%), indicating a strong concentration of remote and hybrid work in the country’s largest metropolitan areas, particularly in Warsaw.
According to Eurostat, Poland is among the EU countries with the highest share of car transport in total passenger kilometres. In 2023, nearly three-quarters of all passenger kilometres were travelled by car, compared with the EU-27 average of 70.6%. The share of rail transport in passenger mobility amounted to 7.7%, slightly above the EU average of 7.1%.
Krzysztof Krawiec
Population Ageing Will Increase Long-Term Care Expenditure
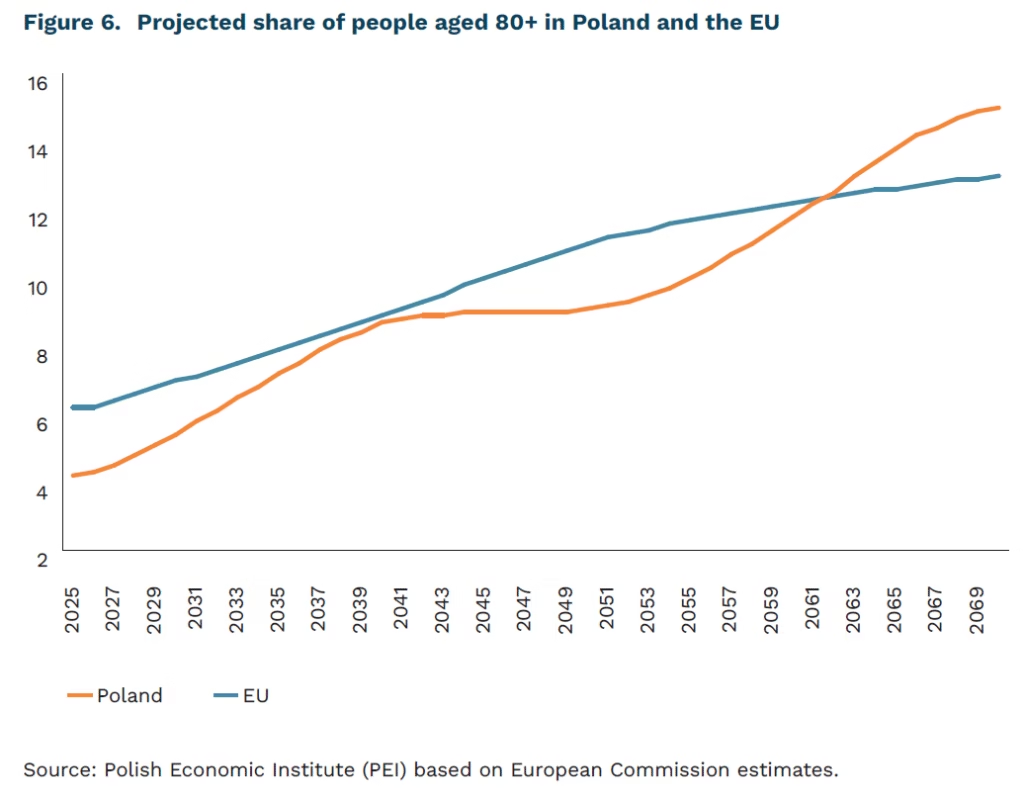
4.2% share of people aged over 80 in Poland today
9.1% projected share of people aged over 80 in Poland in 2050
2.5× projected increase in long-term care spending by 2050
The demand for long-term care (LTC) in Poland will grow significantly in the coming years. According to the OECD, two-thirds of LTC users are elderly persons aged 80 and over. Meanwhile, projections by the European Commission indicate that the share of this age group in Poland’s population will continue to rise rapidly. Currently, people aged 80+ account for 4.2% of the population, and by 2050 their share is expected to reach 9.1%.
OECD estimates show that the current cost of full-time long-term care already exceeds the disposable net income of almost all individuals requiring such care. The ratio of LTC costs to recipients’ income is expected to deteriorate further. First, growing demand will exert upward pressure on the cost of care and medical services. Second, price increases will also stem from staff shortages in the medical and care sectors and the projected decline in Poland’s working-age population. Third, the purchasing power of future pensions will fall sharply: while the average replacement rate currently stands at 55%, by 2050 it is expected to drop to 27%.
According to OECD projections, the rise in demand for long-term care will increase current LTC expenditure 2.5-fold across OECD countries by 2050. In Poland, formal LTC is provided within two systems: the healthcare system (through public funding of care in long-term and nursing facilities) and the social care system (through public funding of social welfare homes). In 2024, total LTC expenditure in Poland amounted to PLN 23.5 billion, of which PLN 19.2 billion came from the healthcare system and PLN 4.3 billion from social care. Additionally, it is estimated that the majority of LTC spending comes from private sources, namely, the income and assets of care recipients and their families.
Paula Kukołowicz
Financial Literacy among Poles Has Limited Impact on Their Saving Behaviour
70.7% share of Poles who understand the impact of inflation on savings
19% share of Poles who keep their savings in cash at home
10 p.p. decline in the share of Poles saving through deposits and savings accounts compared with 2023
Poles understand basic financial concepts and mechanisms but rarely apply them in practice. As many as 70.7% understand the impact of inflation on savings, and 67.3% grasp the concept of compound interest. More complex issues, however, pose a greater challenge: only 32.9% are able to assess portfolio diversification risk, while half (50.7%) admit to lacking any knowledge of this topic – according to a 2025 survey by the Polish Economic Institute (PEI). The findings are consistent with the 2023 OECD report, in which Poland scored 62 out of 100 points in the general financial literacy index (OECD average – 63). Although Poles scored above average in the theoretical section, only 35% reached the 70-point threshold needed to pass, illustrating difficulties in applying financial knowledge in practice, particularly in long-term planning.
Despite understanding inflation, an increasing number of Poles keep their savings in cash. A study by Ariadna shows that although the propensity to save has risen, 19% of Poles now store money at home. At the same time, the share of people saving through deposits and savings accounts has fallen from 47% to 37%. This trend suggests growing uncertainty and a perceived need for greater control and immediate access to savings. It may also stem from limited trust in banks – according to a 2024 PEI survey, 40% of Poles do not trust them – or from insufficient knowledge of capital protection tools. The Eurobarometer illustrates the scale of Poles’ financial insecurity: in 2023, only 20% believed they would have enough money to live decently in retirement – the lowest result in the EU.
Effective financial education could help improve Poles’ financial habits. According to the 2024 report by the Polish Bank Association, 39% of respondents believe that better financial knowledge would help them save more effectively, and 30% that it would strengthen their sense of security.
Systematic and well-designed financial education is key. An analysis of 70 educational programmes implemented worldwide found that newer initiatives achieve better results due to accumulated experience and refined theoretical frameworks. However, the effects of training fade when participants have no opportunity to regularly reinforce their knowledge after the course. Surprisingly, the number of class hours is not decisive – success depends on the integration of diverse methods such as case studies and simulations. Digital technologies deliver lasting results only when embedded in a well-designed teaching process; they are not a universal remedy on their own.
The National Financial Education Strategy, adopted in 2024, aims to address gaps in financial competence. It targets low-income households, indebted consumers, older adults, and children and youth. The strategy provides for the creation of an educational portal and training in schools and workplaces to strengthen understanding of the pension system, investment, and cybersecurity. Incorporating insights from proven international approaches could enhance the effectiveness of its planned initiatives.
Iga Rozbicka, Karolina Rutkowska