Economic Weekly 7/2026, February 20, 2026
Published: 20/02/2026
Table of contents
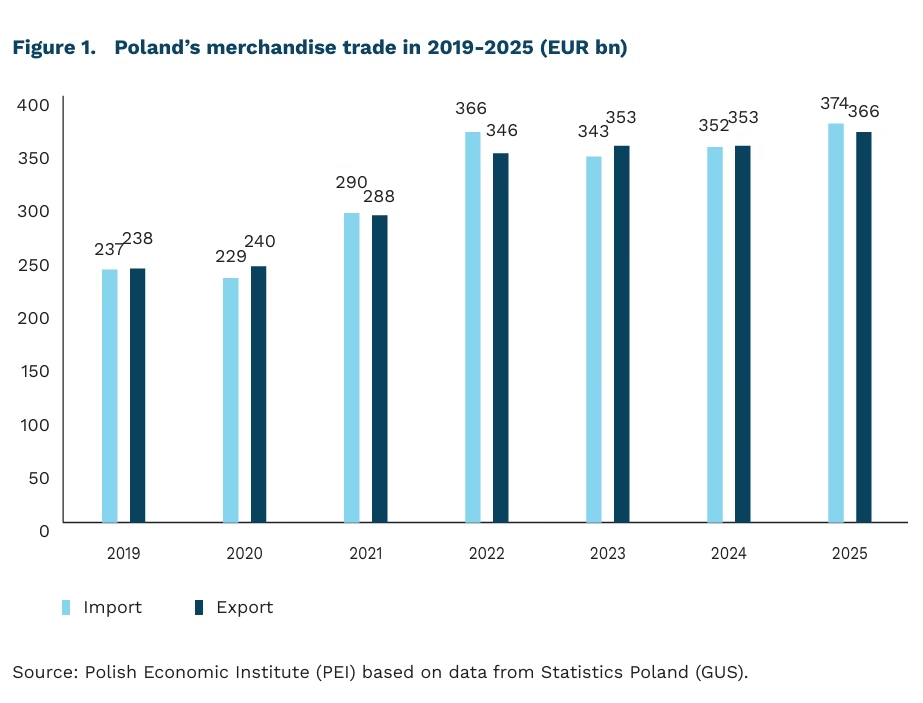
Polish exports have rebounded, but are growing more slowly than imports
15.5% (up 1 percentage point from 2024) was China’s share of Polish imports in 2025
by only 0.1 percentage point fell the U.S. share in Poland’s exports of goods
6.4% (the 4th most important partner) was Poland’s share of German imports in 2025
In 2025, the growth rate of Polish exports lagged behind the pace of imports, resulting in a trade deficit of EUR 7.7 billion after two years of surpluses. Export value rose by nearly 4%, a rebound from 2024, when exports fell due to a slowdown in global markets. Import value increased by more than 6% amid a pickup in growth of the Polish economy, stronger by rising deliveries from developing countries. The only region that recorded declines in both imports and exports year-on-year was Central and Eastern Europe.
Despite a significant increase in U.S. tariffs in 2025, the value of Polish exports to the United States (in EUR) fell by only 0.1%. This slight drop was largely due to stockpiling in the first half of 2025 ahead of the expected tariff hike (by June 2025, exports to the U.S. were up 30%). The U.S. share in Polish exports also decreased by 0.1 percentage point, while a somewhat larger decline was recorded for exports to Germany (down 0.3 percentage point). Although exports to Germany rose by about 3%, the share of that destination in Poland’s exports fell below 27%. Still, Germany remains Poland’s most important partner.
Remarkably, in 2025, for the first time in history, Poland’s exports were higher than Russia’s exports. After eleven months of 2025, Poland’s export value exceeded Russia’s by USD 2 billion, based on mirror data on all countries’ imports from that state.
However, rapid export growth in the near term is unlikely. Growth in the EU – the most important market for Polish exports – remains moderate. At the same time, trade barriers will at least persist and may intensify due to U.S. protectionism, the war in Ukraine, and competition from China.
By far the biggest change was recorded in imports. China’s share in Poland’s imports rose by as much as 1 percentage point, from 14.5% to 15.5%, driven by an increase in imports (in EUR) of more than 13% year-on-year. The largest increase in import value was seen in mechanical machinery, cars, and games and toys. Cars alone accounted for 10% of this increase.
In German exports, a collapse was recorded in two directions: to the U.S. and to China. Exports to China have been falling for two years, and during the first eleven months of 2025 they dropped by a further 14% compared with the same period in 2024. The U.S. remained Germany’s most important export partner, but sales to that market fell by almost 10%. Against this backdrop, Poland’s importance as a market for German products rose by 6.5% year-on-year. As a result, Poland strengthened its position as Germany’s 4th-largest destination accounting for 6.4% of Germany’s exports for goods, clearly ahead of China.
Jan Strzelecki, Marek Wąsiński
Russia is increasingly lowering oil prices
1.5% in Q3 2025, down from 26% in Q1 2022, is the share of Russian oil and petroleum products in total EU imports
7%, down from approximately 50% in February 2022, is the share of EU countries in Russian oil imports
3.5 percentage points, from 7.5% to 4%, is the drop in the estimated share of oil and gas revenue in Russia’s GDP since 2022
75% of Russian crude oil is transported by tankers attempting to bypass international sanctions
In the four years after Russia’s invasion of Ukraine, Russian oil production decreased from 9.6 million to 9.1 million barrels per day (b/d). At the same time, there has been a significant decrease in the price of Russian oil compared to Brent oil – one month after the war started, the difference between the price of Brent oil and Russian Urals oil increased from $4 to over $30 per barrel. However, over time, the difference decreased and at the beginning of 2026 it was around $10-11 per barrel[1]. In practice, however, due to a lack of buyers for the excess Russian oil stocks, it is being sold at additional discounts, which means the price difference compared to Brent oil can exceed $20. This results in significant drops in Russian budget revenues – in 2022, oil and gas revenues accounted for 7.5% of Russia’s GDP, while in 2025 it was only 4% of GDP.
Although, at the start of the war in Ukraine, the European Union was the largest importer of Russian oil, it reduced its import from 44% in 2021 to only 7% of total Russian exports now. The remaining import is handled by two countries – Slovakia and Hungary – which opposed completely abandoning Russian oil. In Q3 2025, the share of Russian crude oil and petroleum products in total EU imports was 1.5% (compared to 26% in Q1 2022).
The decline in Russia’s exports to EU countries was partly compensated by the increase in exports to China and India. While exports to China have remained relatively stable since mid-2022 (with a daily import value of $200 million), in recent months, India’s import value has nearly halved (from $100-120 million per day in 2025 to around $60-70 million in January and February 2026). The decline in Indian imports is a result of US pressure on Indian government. Indian imports of Russian oil may continue to decrease due to the planned agreement between India and the USA, which aims to increase imports of American crude oil.
The price reductions of Russian oil are largely the result of successful sanction packages. Currently, the EU and G7 countries have jointly set a price cap for Russian oil transported by sea at $47.6[2] per barrel (down from $60 per barrel). In October, the US also imposed sanctions on Rosneft and Lukoil (along with 34 subsidiaries). Among the G7 actions, there was also an increase in monitoring actions and sanctions targeting the so-called shadow fleet. Ships assisting Russia in bypassing international sanctions – especially the price cap – already make up the majority of the tankers transporting Russian oil. In December 2025, only 26% of Russian oil was transported by ships from G7 countries implementing the price cap (or insured by them), 68% by shadow fleet vessels that were identified and sanctioned, and the remaining 6% by shadow fleet vessels not subject to sanctions.
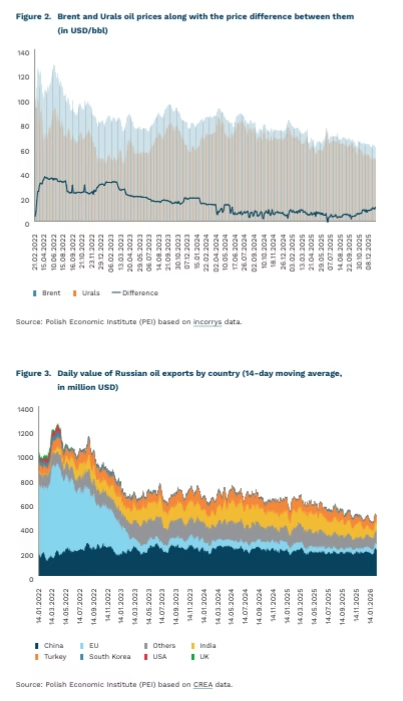
- On the day the analysis was written, the official price of Brent oil was around $67, while the price of Urals oil was approximately $55 per barrel.
- Price caps also apply to petroleum products sold above the price of crude oil (such as diesel, jet fuel, and gasoline – $100 per barrel) and to petroleum products sold below the price of crude oil (e.g., heating oil – $45 per barrel).
Adam Juszczak
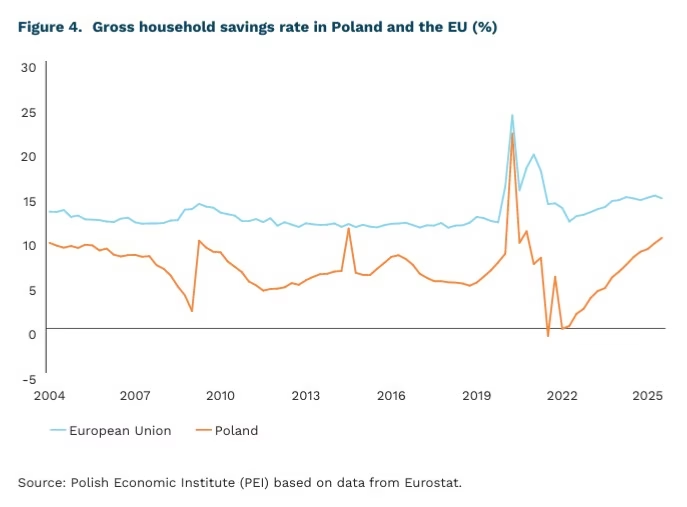
Savings of Poles are increasing
10.2% household savings rate in Poland in the third quarter of 2025
14.6% household savings rate in the European Union in the third quarter of 2025
0.6 precentage point increase in Poland’s household savings rate in the third quarter of 2025 (quarter-on-quarter)
The savings rate shows what portion of household income is not spent on current consumption. In statistical terms, it represents the share of income set aside in total disposable income, including changes in funds saved for future pensions.
The household savings rate in Poland rose again. In the third quarter of 2025, it reached 10.2%, the highest level since 2020. Poland recorded the third-largest quarterly increase in the indicator among EU countries (0.6 percentage points quarter-on-quarter), surpassed only by Italy (1.4 percentage point q/q) and Hungary (1.1 percentage point q/q). The increased propensity to save stems, among other factors, from continued real wage growth and the rebuilding of financial buffers after the period of high inflation in previous years, as well as from heightened economic uncertainty. Positive real interest rates also support saving by making safe financial instruments more attractive.
However, Poland’s savings rate remains relatively low compared with the European Union as a whole. Differences between countries result from income levels, spending structures, the attractiveness of available savings products, and trust in financial markets. Demographic factors also play a role – for example, aging populations usually tend to save more. In Q3 2025, the average savings rate in the EU amounted to 14.6%, marking a decrease of 0.3 percentage point compared with the previous quarter. The highest savings rates were recorded in Germany (19.6%), Hungary (18.4%), and in France and the Czech Republic (18% each). As a result, Poland’s rate is 4.4 percentage points below the EU average, with the relatively low propensity to save mainly reflecting lower income levels compared with wealthier European economies, as well as the still limited popularity of long-term saving and investing relative to other countries.
The structure of household financial assets indicates that simple and liquid forms of saving still dominate in Poland. In Q3 of last year, the largest shares in household assets were current deposits (26.3%), cash holdings (11.4%), and other deposits (11.2%). Together, these categories accounted for nearly half of total assets, suggesting that the increase in savings is primarily precautionary rather than long-term investment-oriented. The total value of assets increased by PLN 135.8 billion during this period, with equity holdings, unlisted shares, and investment fund units contributing the most to growth. In practice, the increase in asset value largely reflected higher market valuations rather than solely an inflow of new savings.
Piotr Kamiński
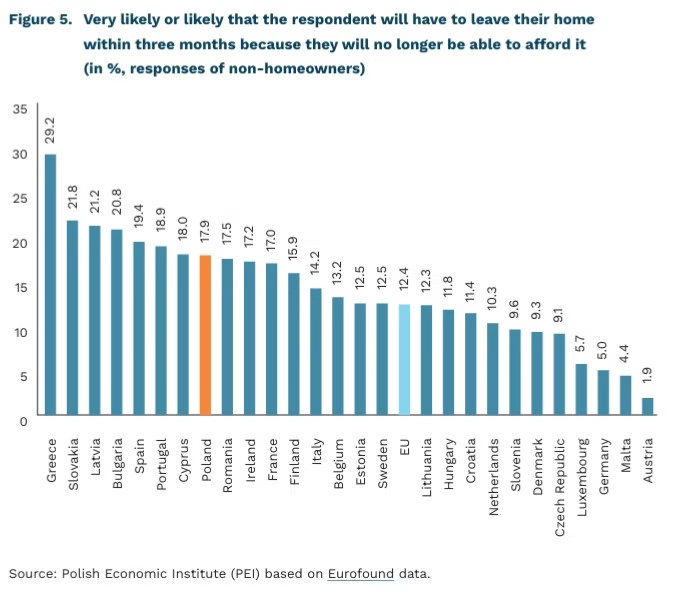
Houses in Poland are less affordable than the EU average
11% of Poles surveyed in 2024 were uncertain about their housing situation
18% of non-homeowners in 2025 in Poland were uncertain about their future housing situation
In Poland, a higher percentage of non-homeowners are uncertain about their housing situation than the EU average. A study presented by Eurofound indicates that in 2025, the proportion of respondents in Poland who stated that they would probably have to change their place of residence because they would no longer be able to afford it was 18% among non-homeowners. Across the EU, this share was just over 12%. In Poland, the situation is better than in seven EU countries, including Spain, Portugal and Slovakia.
The housing affordability is not only a problem for tenants, although they are affected to a greater extent. Another Eurofound study shows that in 2024, 11% of people in Poland (without distinction between tenants and owner-occupiers) felt uncertain about their housing situation. This is the ninth highest result in the EU (tied with Romania, Spain and the Netherlands), 4 percentage points higher than the EU average. The situation in Poland looked better in terms of making ends meet financially – the percentage of people who indicated problems in this area was at the EU average of 30%. In other countries, it was 31% in Finland, 36% in Italy and 40% in Hungary.
In 2022, the housing gap problem affected 35% of households in Poland. These are the latest results to date (calculated on the basis of the European Survey on Income and Living Conditions – EU-SILC) of this phenomenon, which is understood as a situation in which people live in overcrowded accommodation or are burdened with excessive housing costs. In their study, A. Czerniak et al. (2025) indicate that 23% of households (i.e. 2 out of 3 in the housing gap) were either overburdened with housing costs or their members lived in overcrowded accommodation while being unable to afford to buy or rent suitable accommodation at the average market price. In 2022, higher levels of the housing gap could only be found in Greece, Latvia, the Netherlands, Bulgaria and Romania within the EU. Nevertheless, the housing gap has narrowed in Poland over the last decade. Between 2012 and 2022, it fell by almost half.
In percentage terms, the highest number of households facing a housing gap in 2022 were single parents with children and large families. In the first group, i.e. households consisting of a single parent with at least one child, the housing gap was 64%. In the second group – households with two adults and at least three children – the rate was 61%. As the authors of the study point out, this is partly due to the relatively low creditworthiness of these groups and the low availability of large flats in cities, which limits the options available to large families.
Jędrzej Lubasiński
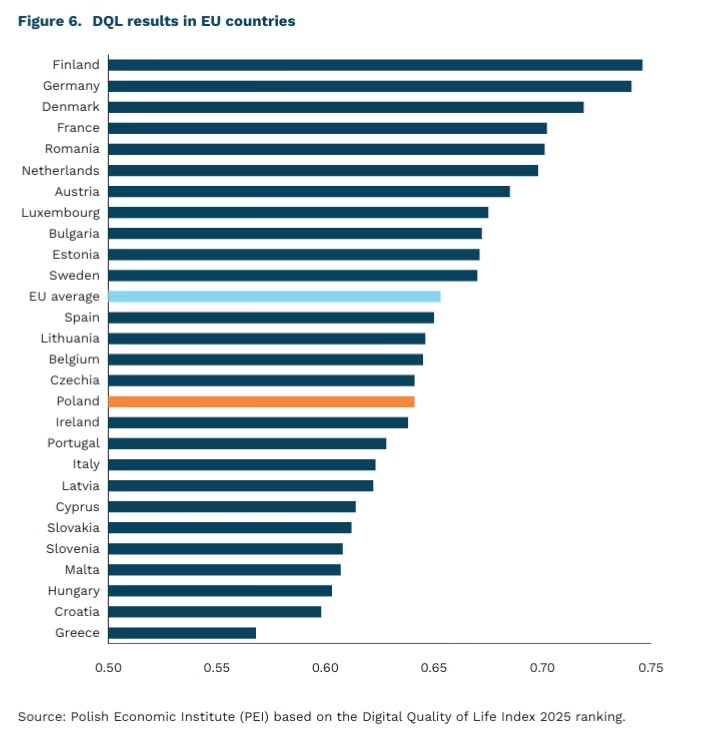
Digital security is Poland’s greatest asset in the digital quality of life ranking
8 is the number of EU countries in the top ten of the DQL ranking
0,7455 is the DQL index for Finland, the leader of the ranking
Poland, with a score of 0,6405, ranks 25th globally and 16th among EU member states
The EU countries lead the digital quality of life ranking (Digital Quality of Life Index – DQL) – eight European countries are in the top ten, confirming the high level of development of the digital environment in the EU compared to the rest of the world. The DQL index is dominated primarily by countries in northern and Western Europe, such as Finland, Germany, Denmark, and France, which achieve high positions in the ranking due to their good scores in artificial intelligence (AI), as well as their developed digital infrastructure, high level of digital security, and good internet accessibility. However, in Germany and Finland, the quality of the internet is relatively weaker than in the other five leading countries.
The DQL index mainly assesses the development and availability of digital services in individual countries. It consists of five equal pillars: internet availability, internet quality, digital infrastructure, digital security, and (since the 2025 edition) AI.
With a score of 0.6405, slightly below the EU average (0.6526), Poland ranks 25th in the global DQL ranking and 16th among EU countries. Poland stands out from the EU with its high level of digital security, which is its main competitive advantage and brings it closer to the top of the ranking. However, the factors that most significantly lower Poland’s score are internet quality, understood as the technical parameter of connections, and digital infrastructure. In the case of internet quality, this is due to relatively lower speeds and greater delays in mobile and fixed connections. However, a weaker digital infrastructure reflects the moderate level of use of the opportunities offered by information and communication technologies in society and the country’s limited readiness to fully implement and adopt digital technologies.
In 2025, the DQL measured for the first time the area of AI, which illustrates the country’s development in this pillar, showing both its investment attractiveness and its readiness to integrate AI into public services. The results show that Poland ranks in the middle of the EU countries, which means that it is able to attract investments in AI and gradually implement AI-based technological solutions in the public sector, although it is not a leading player in this area. The best results in this area in the EU are recorded by France, Germany, and the Netherlands, and globally by the United States, Singapore, and South Korea.
The inclusion of artificial intelligence in the DQL index in 2025 shows the growing role of this technology in the digital development of countries, but a high score in artificial intelligence does not always determine the quality of everyday digital services. In Germany, a strong AI investment component coexists with relatively weaker internet quality, while in Denmark, high AI scores are accompanied by good internet quality and developed infrastructure, which favors the actual use of technological potential. Furthermore, the DQL index refers only indirectly to the quality of digital life, relying mainly on measurable parameters of internet access, infrastructure, and technological potential, and to a lesser extent on how users rate their digital experiences.
Magdalena Lesiak
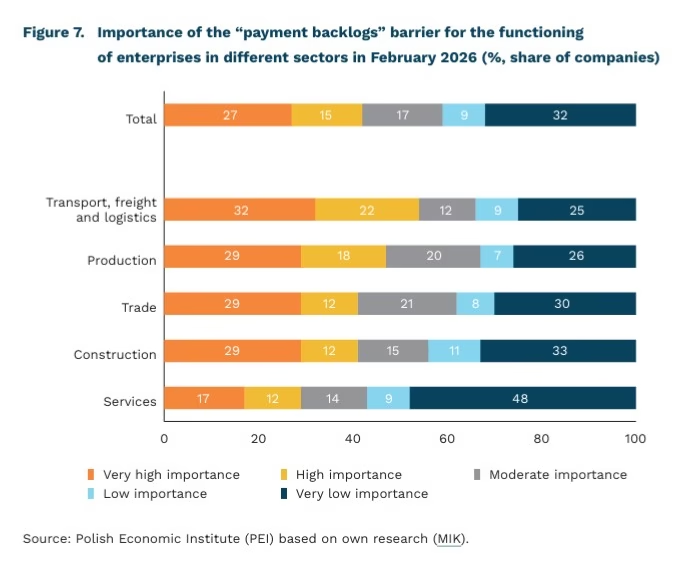
Payment backlogs are one of the main barriers to doing business
more than 4 in 10 companies say that payment backlogs significantly hinder their operations
54% of companies in the transport, freight and logistics sector complained about payment backlogs in February 2026
PLN 152,000 this was the average amount of overdue debt per unreliable entrepreneur in November 2025
More than 4 in 10 companies complain about payment backlogs that make it harder for them to run their business, according to the MIK (Monthly Business Climate Index) research. The share of companies indicating that this barrier was of high or very high importance remained fairly stable since measurements began (i.e., since 2022), fluctuating between 40% and 50%. Companies mentioned this barrier noticeably less often than rising labour costs, uncertainty in the economic environment, and increasing energy prices. Its severity was assessed similarly to problems related to labour shortages.
The sector that most often complained about payment problems from business partners was transport, freight and logistics sector – in most months, more than half of companies in this sector reported them, and since December last year, payment backlogs have been their third most important barrier to doing business (after rising labour costs and uncertainty in the economic environment). In February 2026, as many as 54% of companies pointed to problems related to payment backlogs. The transport, freight and logistics sector’s higher exposure to payment backlogs may result from low margins, long payment terms, pressure from large contractors, and the need to cover high fixed costs. The sector that least often points to problems related to payment backlogs is services. Since August 2024, fewer than 35% of service companies reported them, and in February 2026 this figure was only 29%.
However, problems with payment backlogs do not have a decisive impact on companies’ financial liquidity. Since 2021, the MIK index relating to financial liquidity has, in almost every month, remained above the neutral level, indicating a predominance of firms with good financial liquidity. In nearly all months since 2021, more than half of companies declared that they had sufficient funds to operate for more than three months.
The problem of payment backlogs is also confirmed by BIG InfoMonitor data. At the end of November 2025, the total amount of overdue liabilities across various sectors of the economy approached PLN 46.2 billion. This means that, on average, one unreliable entrepreneur had PLN 152,000 in overdue obligations to banks and business partners, an increase of more than PLN 17,000 compared with 2024. As a result, over 75% of companies surveyed on behalf of BIG InfoMonitor declared that in 2026 they plan to take measures to minimise payment backlogs. To reduce the risk of overdue payments, companies primarily want to shorten the time between issuing an invoice and the cash being credited to their account; some also intend to respond more quickly to delays and to undertake their own debt-collection actions as early as the first warning signs. The problem of payment backlogs is also reflected in statutory solutions, such as setting shorter payment deadlines, introducing bad-debt relief, allowing withdrawal from a contract in the event of excessive payment delays, or increasing statutory interest for late payment in commercial transactions.
Anna Szymańska
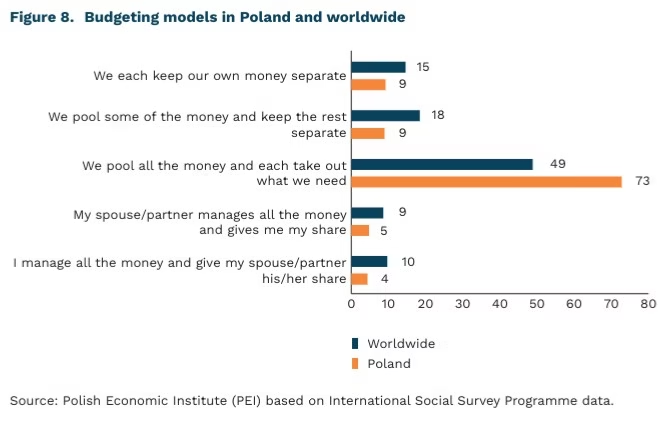
Joint management of the household budget improves the subjective assessment of financial situation and relationship quality
73% of couples in Poland keep their money in a joint account
16% of couples in Poland often argue about savings
Managing funds within couples’ household budgets can be a source of arguments and conflicts, but at the same time it is an important factor in relationship stability. According to a study conducted for BIG InfoMonitor, 18% of respondents who described their f inancial situation as poor declared that arguments about money frequently occur in their relationships. Overall, 31% of all respondents indicated that rising living costs and fixed expenses are the most common cause of conflicts at home.
A frequently declared bone of contention in couples’ budgeting is the way partners divide income and expenses. According to ISSP data from 2022, as many as 73% of couples in Poland have a joint account from which they draw according to their needs. Data from the entire ISSP sample (53 countries, over 27,000 respondents) show that significantly fewer couples worldwide operate this way (49%). Nine percent maintain completely separate finances (vs. 15% globally), and the same percentage pool only part of their income in a joint account while keeping the rest in individual accounts (vs. 18% globally). Polish women and men also declare greater financial independence, and much less frequently than globally report that money is allocated to them by their partner (5% in Poland vs. 9% worldwide). In countries culturally similar to Poland (Hungary, the Czech Republic, Slovakia, Lithuania, Latvia), a significantly higher share of people allocate money to their partner from the household budget (10%), and a significantly lower percentage of couples pool all their income into a fully joint account (58%).
Data collected in the same study for Scandinavian countries reveal an interesting pattern. Forty-nine percent of respondents have a joint account from which they draw according to their needs. A significantly higher share (34%) than in Poland or globally declare that they keep part of their money in a joint account and part in a personal account. A similar pattern is observed in Germany (51% pool their money and use it as needed). As many as 25% of German respondents keep all their money in separate accounts.
Research shows that jointly made financial decisions have a positive impact on the subjective assessment of financial well-being and relationship quality. A Swedish analysis from 2023 indicates that couples who managed their finances jointly showed a lower likelihood of arguments about money. Interestingly, in couples where the woman managed all finances, the likelihood of arguments nearly doubled, and in households where the man managed all finances, it increased sixfold. Difficulties with savings also significantly contribute to conflicts.
Financial socialization (the process of building values and attitudes toward money and f inances) is important not only for couples’ well-being and relationship stability, but also for children’s financial education and awareness. Zhao and Zhang demonstrated that appropriate financial socialization has an indirect but significant impact on financial behavior. Intergenerational communication about money is an additional element of financial education and gradually builds children’s awareness of living costs as well as financial and savings instruments.
Maksymilian Pyrkowski