Economic Weekly 20/2025, May 22, 2025
Published: 23/05/2025
Table of contents
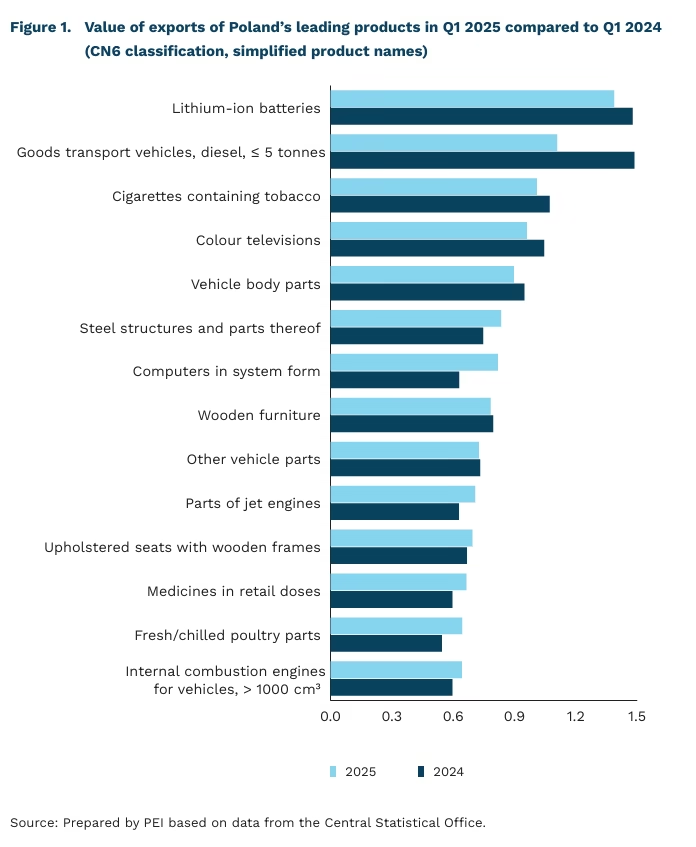
Lithium-Ion Batteries Remain Poland’s Top Export Product in Q1 2025
195 number of product categories in which Poland is the EU’s leading exporter
-6% year-on-year decline in lithiumion battery exports in Q1 2025
+30% year-on-year growth in exports of digital data processing machines in Q1 2025
At the beginning of 2025, Poland ranked as the 7th largest exporter of goods in the European Union overall, and 6th among EU Member States alone. The country was the leading exporter in 195 product categories, and ranked among the top five EU exporters for 1,544 products(1). This means that Poland is a key exporter in approximately one-quarter of all product categories, underscoring its growing significance in the EU’s trade structure.
In the first quarter of 2025, Poland’s top export categories continued to include lithium-ion batteries, goods transport vehicles, and cigarettes. However, weakened demand in the EU and shifting market conditions led to year-on-year declines across all three segments.
- Lithium-ion battery exports amounted to EUR 1.38 billion, down by more than 6% year on year, deepening a downward trend that began in 2024. Despite the decline, Poland remains the EU leader in this category, accounting for 20% of total EU exports. Meanwhile, EU-wide battery exports increased by 3%, driven primarily by stronger export performance in the Czech Republic and the Netherlands. Other leading producers, such as Hungary (the EU leader in 2024) and Germany, also saw declines.
- Exports of goods transport vehicles fell by 25%, a sharper drop than the EU average decline of 17%. Poland currently ranks 4th in the EU in this category, with a 15% share of EU exports, valued at approximately EUR 1.1 billion. Globally, Poland accounted for around 7% of exports in this segment in 2024, continuing the downward trend that began in 2023. A similar decline was observed in Germany, while countries like Mexico strengthened their global market position.
- Despite a 6% decline in export value compared to Q1 2024, Poland retains its leading position in cigarette exports within the EU, holding a market share of over 30%. The drop in value is likely linked to a continued global decline in demand, already visible in 2024.
Exports of televisions also declined, falling by 8%, although Poland maintained its position as the EU’s leading exporter in this category with a 30% market share. The slowdown in the automotive sector, particularly in Germany, negatively impacted supply chains and contributed to lower export values from Poland for other key products in the vehicle parts segment, including car body components.
Despite a challenging international environment in Q1 2025, Polish exports held steady compared to the previous year, with notable growth in several key categories.
- Exports of digital data processing machines rose by 30% in Q1 2025, reaching a value of EUR 0.81 billion. Poland dominates this category within the EU, accounting for over 55% of total Union exports. While exports of these machines across the EU grew by only 2%, Poland further strengthened its position. Globally, only Taiwan and the United States ranked higher in 2024, with Poland’s share of global trade at 14%.
- Exports of steel structures, jet engine parts, and medicines also recorded significant growth (approx. 12%) placing Poland 1st, 2nd, and 14th in the EU, respectively. These gains reflect a broader European trend of rising demand in these sectors.
- In the food sector, exports of fresh and chilled poultry parts increased by 18%, reaching EUR 0.65 billion. Poland retained its position as the EU’s leading exporter in this category, with a 35% share of total EU exports.
- Due to incomplete data from all EU Member States for the first quarter of 2025, Poland’s position in total EU exports is based on results from the first two months of the year.
Aleksandra Sojka
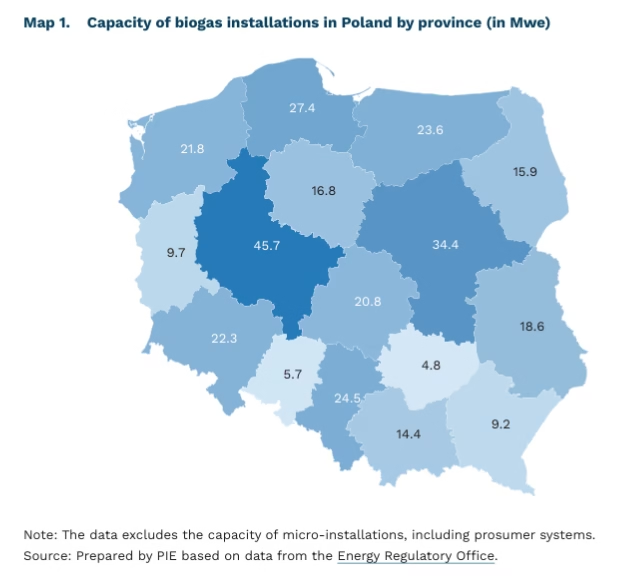
Poland Has Strong Potential for Biogas and Biomethane Production
415 biogas plants were operating in Poland as of March 2025 (Energy Regulatory Office)
1 out of ~1,600 biomethane plants in Europe is currently located in Polan
Poland remains at an early stage in the development of biogas and biomethane infrastructure compared to other EU countries. According to the Energy Regulatory Office, as of March 2025, there were 416 biogas facilities in operation in Polan (415 biogas plants and one biomethane plant). Data from the Energy Market Agency indicates that these facilities have a combined installed capacity of 320 MW and generate just under 1,6 TWh of electricity annually, representing 0.94% of national electricity production in 2024. In February 2025, Poland’s first biomethane plant was commissioned at the Agricultural Experimental Farm in Brody. The facility is expected to produce 0,65 million m³ of biomethane annually, which will be compressed and sold as fuel in the transport sector (bioCNG). By contrast, Europe hosts over 20,000 biogas plants and around 1,600 biomethane plants. As of the end of Q1 2024 the EU’s technical biomethane production capacity had already surpassed 6.4 billion m³, which is over 9,800 times greater than Poland’s projected biomethane output in 2025.
Poland has substantial potential for biogas and biomethane production, but this remains largely underutilised. According to the National Energy and Climate Plan (NECP) Poland’s domestic biomethane generation potential is estimated at up to 8 billion m³ annually. If fully realised, this volume could cover approximately 46% of Poland’s current natural gas demand (8 out of 17.4 billion m³), thereby reducing dependence on imports and facilitating a faster transition away from coal in both the electricity and heating sectors. Other projections, such as those from the Gas for Climate, suggest that Poland’s long-term potential may be even higher, ranking it 5th in Europe in terms of prospective production volume, with an estimated capacity of around 13 billion m³ by 2050.
The National Energy and Climate Plan’s (NECP) ambitious With Additional Measures (WAM) scenario forecasts that biomethane will contribute 11.9 TWh to final domestic energy consumption by 2030 (equivalent to 1.1 billion m³) and 28.3 TWh by 2040 (2.6 billion m³). The document outlines several measures to support the development of biomethane installations, including facilitating the construction of direct pipelines for biomethane producers. In April, the Ministry of Climate and Environment put forward legislative proposals aimed at removing administrative barriers and accelerating implementation in this area.
Wojciech Żelisko
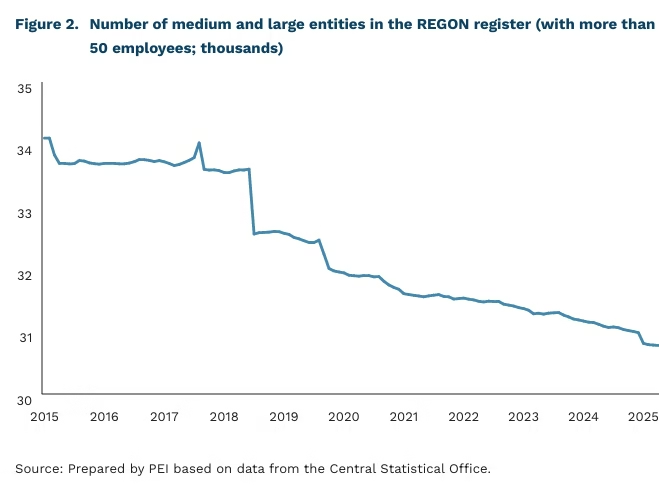
Micro-Enterprises Drive Growth in REGON Registrations
0.58% share of medium and large entities in the REGON register
5.35 million total number of entities registered in REGON
The number of entities registered in the REGON statistical register continues to increase steadily. In April 2025, 35,100 new entities were registered, which meant an increase of 4.7% compared to March 2025. The highest number of new registrations was recorded in the Mazowieckie Voivodeship, with growth of 2% over the previous month. At the end of April, the total number of registered national economy entities reached 5.35 million, marking an increase of 0.3% compared to the previous month and 2.8% year on year. At the same time, the number of de-registered entities declined, falling by 4.3% compared to March. Notably, the number of de-registered sole proprietors also decreased, by 4.5%.
Differences in the growth of registered entities are especially pronounced when disaggregated by enterprise size. Compared to April 2024, there were 144,900 more registered entities overall. However, when adjusted for the number of employees, the picture is more nuanced. The vast majority of growth came from the smallest enterprises (1-9 employees), which increased by 147,000 over the past year. By contrast, the number of larger entities (10 or more employees) declined. In total, there were 2,105 fewer enterprises with at least 10 employees compared to April last year. Declines were observed across all employment size groups – from firms with 10-49 employees, to those with 50-249, 250-999, and even 1,000 or more employees.
As a result, the share of entities employing more than 50 people has continued to decline. At the beginning of 2015, this group represented 0.83% of all registered entities; by April 2025, it had fallen to 0.58%. This trend illustrates the limited scale of business growth in Poland, as reflected in the shrinking proportion of medium and large enterprises. Many companies operate at a local level and either lack the capacity or motivation to expand further. Contributing factors include excessive bureaucratic burdens and the relatively low level of innovation among Polish firms. In addition, Polish entrepreneurs tend to exhibit a low appetite for risk, which is enabled by the relatively large domestic market – sufficient to meet local needs, but not expansive enough to support international growth. Another critical factor is access to financing. Poland’s capital market could play a stronger role in addressing this challenge. Increased investment activity in the stock market would help channel capital toward smaller, high-potential firms, enabling further growth and internationalisation.
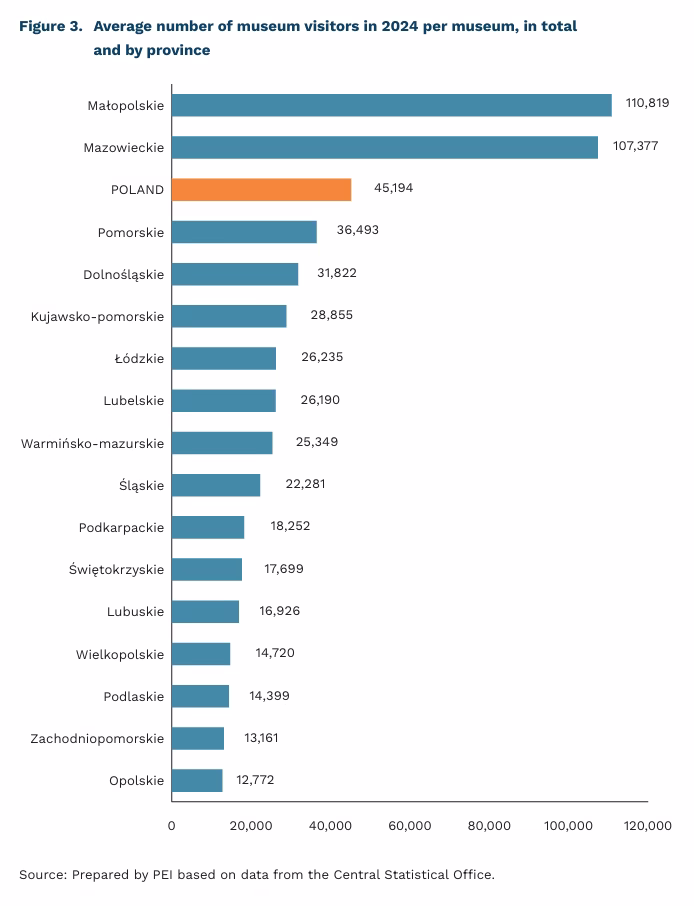
Rising Museum Attendance Boosts Economic Potential of Poland’s Cultural Sector
982 museums and museum branches operated in Poland in 2024
44.4 million visitors attended museums and exhibitions in 2024
PLN 7.5 billion in revenue was generated by the cultural sector in H1 2024
Interest in museums in Poland continues to rise, as confirmed by the latest data from the Central Statistical Office (GUS). In 2024, a total of 982 museums and museum branches were operating (up from 974 in 2023), attracting 44.4 million visitors. This marks an increase from 42.3 million in 2023, and a strong recovery from the pandemic low of 16.6 million in 2020. For comparison, in 2019, museums recorded 40.2 million visitors, indicating that the sector has not only recovered, but is expanding its reach and potential.
A key driver of this growth has been the significant increase in public funding for the cultural sector. Between 2016 and 2023, the budget of the Ministry of Culture and National Heritage rose by approximately 40%. This has supported new museum infrastructure, broader cultural access, and partnerships with the creative industries. According to GUS data, the cultural sector generated PLN 7.9 billion in revenue in the first half of 2024, representing a 17.1% increase compared to H1 2023. For the full year 2023, sector revenues reached PLN 14.3 billion, up 16.2% year on year.
Museums contribute to regional development by attracting tourists who also use hospitality, food, and transport services. One of the most popular cultural events – the Night of Museums, organised annually and especially popular among historical museums – continues to draw large crowds. In 2024, it attracted 795,100 visitors, representing a 4.3% increase compared to 2023. Preliminary estimates for this year’s edition show that the National Museums welcomed more than 91,000 visitors, with a record nearly 19,000 attending the National Museum in Kraków. A key factor in the appeal of cities with strong museum offerings is their ability to combine historical education with entertainment and tourism. In 2024, the highest museum attendance was recorded in two regions: Małopolska and Mazovia.
Museums in Poland are undergoing a transformation, increasingly adapting to the expectations of modern audiences and leveraging new technologies. Many institutions are now collaborating with the creative industries, (engaging in the digitisation of collections and archives, 3D scanning, and the creation of interactive exhibitions using holograms, augmented reality (AR), and virtual reality (VR) applications. These innovations not only enhance attractiveness and accessibility, but also serve as a catalyst for start-up activity. New digital technologies are being adopted with particular success in the contemporary art market, including online auctions, AI-based valuation tools, digital platforms for verifying artwork authenticity, and the use of social media for promotion.
The economic potential of museums in Poland lies in the synergies with both the creative and tourism sectors. However, to fully realise this potential, it is essential to invest in social capital and ensure the effective management of cultural and national heritage assets.
Katarzyna Zybertowicz
Austria Joins Global Trend in Banning Smartphones in Schools
5 h 36 m average daily internet use by Polish teenagers on weekdays in 2022
4 h 12 m average daily time spent on social media by Polish teenagers during internet use (NASK, 2022)
46% of girls and 38% of boys in Poland use the internet for non-academic purposes while studying (NASK)
40% of global education systems had banned mobile phone use in schools by 2024 (UNESCO)
On 1 May 2025, Austria implemented a nationwide ban on the use of mobile phones and all digital communication devices on school premises. The regulation also applies to school-related activities, such as field trips, and covers students up to the age of 14. Austria has thus joined a growing group of European countries (including France, Italy, Hungary, Latvia, and the Netherlands) that have already adopted similar measures. This regulatory trend is increasingly evident worldwide. According to UNESCO, smartphone bans were in place in 30% of education systems in 2023, rising to 40% in 2024.
Similar regulations are being introduced in response to the growing problem of smartphone addiction. According to data from NASK, internet use among children and teenagers in Poland is steadily increasing, with smartphones being their primary means of access. In 2014, the average daily time they spent online on weekdays was 3h 40m. By 2022, this had risen to 5h 36m, with an average of 4h 12m devoted to social media use. Furthermore, 46% of girls and 38% of boys reported using the internet for non-academic purposes while studying. Notably, one in four students surveyed (25.6%) admitted to having difficulty disengaging from social media platforms.
Studies indicate that even the mere presence of a smartphone, e.g. on a desk, can distract students and reduce performance on mathematical tasks and simple memory tests. Beyond cognitive distraction, social media content consumption has also been shown to negatively impact mental health. One study examining mental well-being trends on U.S. university campuses found that the introduction of Facebook was associated with a decline in student mental health. Universities where Facebook had been made available saw a drop in well-being levels compared to those where the platform was not yet accessible (Facebook was gradually rolled out across campuses between February 2004 and September 2006). The availability of Facebook increased students’ self-reported feelings of being overwhelmed, exhausted, and anxious, which in turn contributed to a decline in academic performance.
While it is, of course, possible for teenagers to individually limit their use of social media, research highlights the collective nature of these platforms – often referred to as the ‘social media trap’. Deactivating an account is frequently associated with a loss of social context and a sense of alienation from peers who remain active on the platform. As a result, users of apps such as TikTok or Instagram are generally unwilling to deactivate their accounts unilaterally, but would be more likely to do so if their peer group also reduced usage. In this context, banning smartphone use in schools could help alleviate peer pressure related to constant online presence and weaken the social mechanisms that reinforce teenagers’ engagement with social media platforms.
Marcin Lewandowski
Meta Ads Drive Economic Growth – but Deepen Business Dependence on Tech Giants
EUR 213 billion estimated added value generated by personalised Meta advertisements in the EU in 2024
80% share of the European social media market controlled by Meta
Nearly 61% of businesses in the EU use social media in their marketing strategies, while 59% of EU residents are active users of these platforms. Facebook and Instagram in particular have become essential tools for targeted advertising and campaign automation, often resulting in higher sales conversion and improved brand visibility.
According to Meta, personalised advertising on its platforms contributed EUR 213 billion in added value to the EU economy in 2024, supporting or retaining 1.44 million jobs. The company also claims that, on average, every EUR 1 spent on its platforms generates EUR 3.98 in revenue for the advertiser. These figures, Meta argues, reflect Facebook’s importance as a business tool for European companies. While Meta’s numbers are impressive, it is worth taking a critical look at them and asking whether social media platforms such as the Menlo Park giant are providing a boost to Europe’s economy or contributing to the digital dependence of companies on global corporations.
It is important to consider the methodology behind the study cited by Meta, which analysed approximately 700,000 advertising campaigns and nearly 3.94 billion unique ad exposures. The study focused exclusively on direct sales-oriented advertisements, excluding parallel marketing activities across other channels that may have contributed to the overall campaign results. While the scale of the sample lends credibility to the shortterm findings, the study provides limited insight into long-term effects, such as brand recognition. Moreover, as the research was conducted entirely within the Meta ecosystem, it is difficult to determine whether similar outcomes would have been achieved through alternative channels or on other advertising platforms.
Meta’s growing dominance in social media advertising raises important questions about the dependence of small and medium-sized enterprises (SMEs) on the platform’s algorithms. According to Meta itself, SMEs are the primary beneficiaries of personalised advertising. However, with Facebook controlling nearly 80% of the European social media market, advertising within its ecosystem requires constant optimisation and reliance on data provided by the platform. As the study’s authors point out, advertising profits are generated primarily through the effective use of collected data and continuous testing of creative variants. Even if companies argue that personalised ads are essential for reaching the right audience, it is worth asking whether the loss of access to targeting tools would severely disrupt their business operations. These concerns are partially addressed by EU regulations, including the Digital Markets Act, which is designed to reduce the information asymmetry between advertisers and powerful platforms such as Meta.
The data presented by Meta should be interpreted with caution. While Facebook’s advertising platforms – alongside those of other major players – are undoubtedly a key driver of economic growth in the EU, particularly for small and medium-sized enterprises (SMEs), the lack of comparison with alternative customer acquisition channels raises concerns that Facebook’s economic impact may be significantly overstated. Moreover, the dominance of platform providers and their control over marketing data pose serious risks, including increased market concentration around a handful of tech companies and the growing dependence of businesses on a single channel for promotion.
Maciej Baranowski
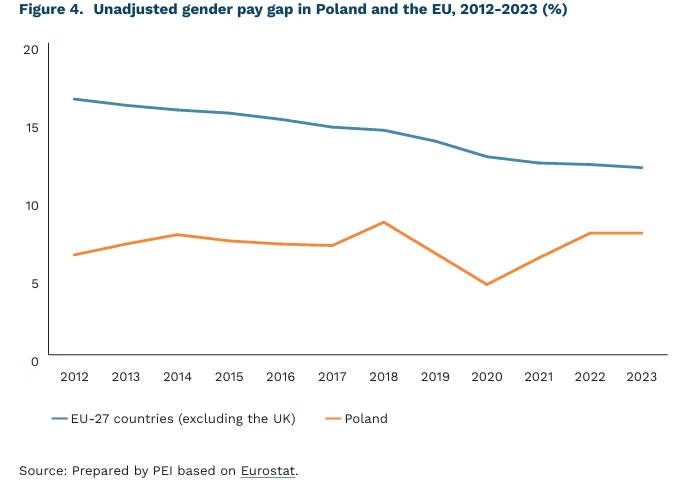
The Gender Pay Gap Remains a Persistent Issue in the EU Labour Market
12% average unadjusted gender pay gap in the EU in 2023
7.8% unadjusted gender pay gap in Poland in 2023
13.2% share of individuals aged 35-44 affected by the pay gap in Poland
The gender pay gap is a key indicator used to monitor income inequality between men and women and to ensure comparability across countries. The most intuitive and widely reported measure is the unadjusted gender pay gap, which reflects the percentage difference in average gross earnings between men and women – indicating how much less women earn than men. According to Eurostat, the unadjusted gender pay gap in the European Union stood at 12% in 2023, while in Poland it was slightly lower at 8%. Luxembourg was the only EU country where women earned marginally more than men, and in Belgium, pay levels between the sexes were nearly identical. By contrast, the highest wage gaps were observed in Latvia (19%), followed by Austria, the Czech Republic, Hungary, and Germany (all around 18%). These disparities highlight the significant variation in pay inequality across EU Member States, largely shaped by institutional, social, and historical factors. The pay gap also differs by age group. In Poland, the widest gap in 2023 was recorded among those aged 35-44, where the difference in earnings reached 13.2%.
A second method of assessing gender wage inequality is the adjusted wage gap, which accounts for variables affecting employee productivity, such as position, seniority, education, and sector of employment. According to calculations by the Institute for Structural Research (IBS), the adjusted gender pay gap in hourly wages in Poland ranged between 12% and 21% during the period 2010-2022, compared to an average unadjusted gap of 7% over the same timeframe. Since 2012, the divergence between the adjusted wage gap in the private and public sectors has widened. By 2022, the gap stood at 18% in the private sector and 8% in the public sector. The adjusted wage gap also varied by sectoral gender composition. It was more pronounced in male-dominated industries such as mining, and smaller in female-dominated sectors such as education, as well as in industries with a balanced gender distribution. Although the largest disparities persisted in occupations involving routine manual tasks, these gaps have shown a downward trend. Conversely, the gap increased in occupations requiring higher-level skills and non-routine cognitive work.
In light of persistent gender-based inequalities in the labour market, one of the EU’s most recent legislative efforts to address pay disparities is the Wage Transparency Directive(2). Scheduled to enter into force on 7 June 2026, the directive aims to narrow (or even fully eliminate) the gender pay gap across Member States. Among its provisions, the directive requires employers to report wage disparities and disclose related indicators – such as the proportion of male and female employees in each wage quartile – based on the size of the organisation. Additionally, if an unjustified gender pay gap exceeding 5% is identif ied, employers will be obliged to rectify the imbalance within six months. It is important to note, however, that efforts to reduce the pay gap may involve not only raising women’s wages, but potentially also adjusting men’s wages downward to achieve compliance.
2. Directive (EU) 2023/970 of the European Parliament and of the Council of 10 May 2023 on strengthening the application of the principle of equal pay for men and women for equal work or work of equal value through pay transparency and enforcement mechanisms.
Ewa Cichowicz