Economic Weekly 22/2025, June 6, 2025
Published: 06/06/2025
Table of contents
Increase in Economic Inactivity at the Start of 2025
12.7 million were economically inactive in Q1 2025
109,000 more were economically inactive in Q1 2025 year-on-year
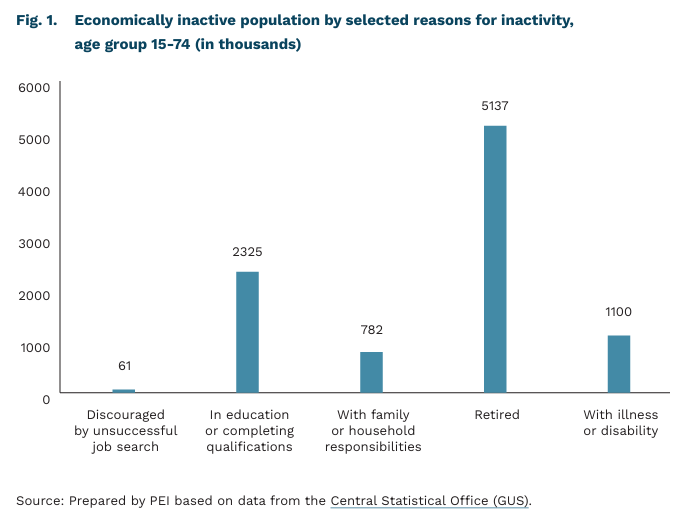
61% of all economically inactive individuals were of retirement age
In the first quarter of 2025, the number of economically inactive individuals reached its highest level in four years. According to preliminary data from the Labour Force Survey (LFS), 12.7 million people were not participating in the labour market in the first three months of the year. This represents an increase of 109,000 compared to the same period in 2024 (12.6 million) and marks the highest level since Q2 2021, when 12.8 million people were neither employed nor actively seeking work. Economically inactive individuals made up 41.8% of the population aged 15-89.
Retirees made up the largest share of the economically inactive population. In Q1 2025, there were over 5.1 million retirees (counting only those aged 15-74). In total, individuals of retirement age accounted for 61% of all those economically inactive. Beyond retirement, common reasons for not participating in the labour market included continuing education or training, family and caregiving responsibilities, and health-related issues such as illness or disability.
The number of people who are economically inactive due to continuing education or upgrading their qualifications has increased. Between January and March 2025, 2.325 million people were economically inactive for this reason – the highest figure since 2021. Among working-age individuals, 36% cited education or skills development as the reason for remaining outside the labour market.
As the population ages, the number of economically inactive people is likely to increase. In the first quarter of 2025, the economic activity rate among people who had already reached retirement age (60+/65+) was 9%. Assuming that this rate remains unchanged in 2030 [1], the number of economically inactive people in this age group will increase from 7.69 million to 8.13 million.
- According to the 2023-2060 Population Forecast, the number of people aged 60 and over for women and 65 and over for men (up to age 89) is projected to reach 8.9 million in 2030, up from 8.67 million in 2025
Jędrzej Lubasiński
Poland’s Employment Map: Where Companies Plan to Hire and Where Cuts Are Expected
19% of companies in the Central Macroregion plan to increase employment between May and July 2025
12% of companies in the Eastern Macroregion intend to reduce employment in the same period
58% of companies in the NorthWestern Macroregion report labour shortages
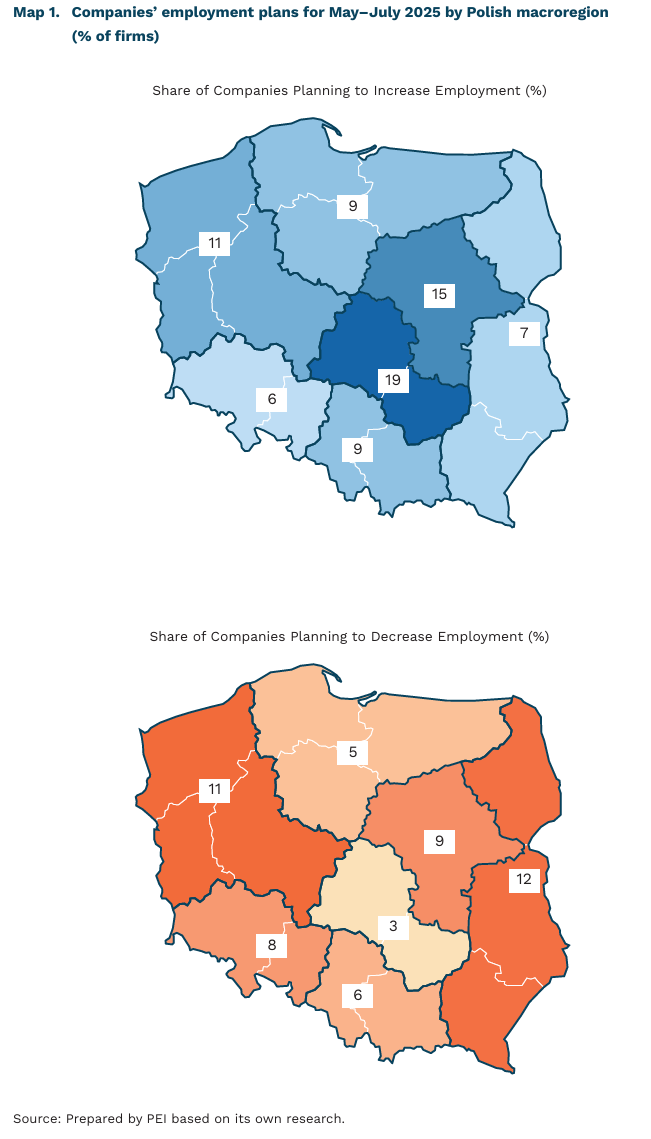
According to the May edition of the Monthly Economic Index (MIK) survey conducted on a sample of 500 companies, despite high labour costs, the majority of employers aim to maintain current employment levels (81%) and keep wages unchanged (91%). Additionally, 44% of companies see the unavailability of workers as a significant barrier to operations. Over the next three months, 11% of companies plan to increase employment, while 8% anticipate reducing staff. Although 71% of companies report feeling the burden of labour costs, 8% plan to raise wages during the same period.
Hiring plans vary considerably by region, making it worthwhile to analyse employers’ declarations at the level of Poland’s seven macroregions (NUTS 1 classification by GUS). In the next three months, 19% of companies in the Central Macroregion (Łódzkie and Świętokrzyskie voivodships) and 15% in the Mazowieckie Macroregion plan to increase employment. By contrast, the highest share of companies intending to cut jobs (12%) is recorded in the Eastern Macroregion (Podlaskie, Lubelskie, and Podkarpackie voivodships).
Labour shortages are a key constraint for businesses in western Poland. Over half (58%) of companies in the North-West Macroregion (West Pomeranian, Greater Poland, and Lubusz Voivodeships) report difficulties in accessing workers. At the same time, only 66% cite high labour costs as a significant burden – below the national average of 71%.
High labour costs are not prompting widespread job cuts. Businesses in the Eastern (74%), Northern (73%), and Central (72%) Macroregions most frequently identify labour costs as a major barrier. However, in the Northern and Central regions, only a small proportion of firms (3-5%) intend to reduce employment.
Regional variation in employment plans highlights the growing importance of local labour market conditions. Factors such as the availability of skilled workers, regional economic structure, and competition for talent are playing an increasingly influential role in shaping HR decisions. Instead of cutting jobs, many companies are opting for adaptive strategies – investing in automation, outsourcing, or flexible work arrangements. This trend reflects not only labour market resilience, but also a shift in approaches to workforce management under conditions of cost pressure and labour shortages.
Katarzyna Dębkowska
Reducing Methane Emissions: A Challenge for Poland’s Energy and Agriculture Sectors
0.5°C the contribution of humangenerated methane emissions to observed global warming (of the total 1.1°C increase)
40 million t CO₂e methane emissions in Poland in 2023, equal to 11.5% of total national greenhouse gas emissions
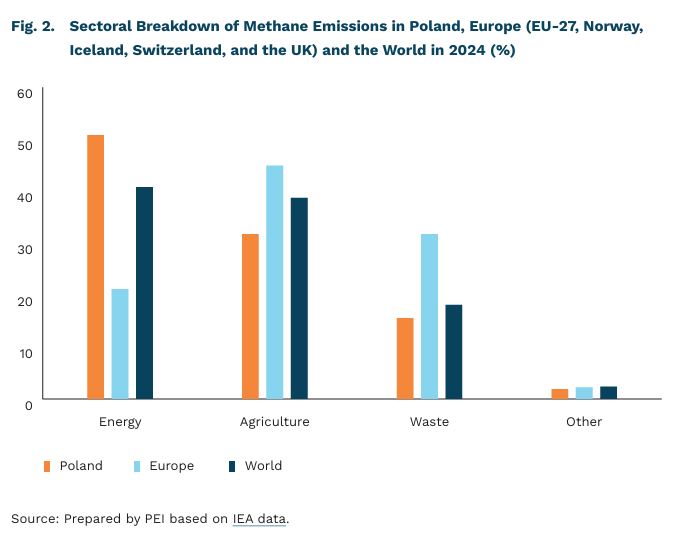
51% share of Poland’s methane emissions from the energy sectors
Methane is a significantly more potent greenhouse gas than CO₂. According to the IPCC, over the first 20 years after its release, 1 tonne of methane warms the planet 84 times more than 1 tonne of CO₂ (GWP20 = 84), and 28 times more over a 100-year period (GWP100 = 28). Methane is estimated to be responsible for 30-45% of the global temperature increase since the Industrial Revolution, with human activity accounting for around 60% of all methane emissions. Between 2010 and 2019, anthropogenic methane emissions raised the Earth’s surface temperature by approximately 0.5°C (with an uncertainty range of 0.3-0.8°C), contributing to 45% of total warming during that period.
Global methane emissions reached 354 million tonnes in 2024, with three sectors accounting for 98% of the total: agriculture (41%), energy (39%), and waste (18%). In Europe (EU-27, Norway, Iceland, Switzerland, and the UK), emissions stood at 26.5 million tonnes – 7% of the global total, according to IEA data. Agriculture (45%) and waste management (32%) were the primary sources. The methane emission structure in Europe is characterized by a relatively low share from the energy sector, which accounted for just 21% of CH₄ emissions in 2024. This is nearly half the global average (41%) and almost 2.5 times lower than the share in Poland (51%).
In 2023, methane accounted for 11.5% of Poland’s greenhouse gas emissions, amounting to nearly 40 million t CO₂e. The largest contributors were operational and decommissioned coal mines, responsible for 36.5% of Poland’s total methane output. According to IEA estimates, 59% of mine-related methane emissions could be eliminated, with 19% achievable at no net cost. The second-largest source was enteric fermentation from cattle, which contributed 35.5% of methane emissions (KOBiZE). Reducing emissions in these sectors will be critical, especially in light of the EU Methane Regulation, in force since 2024. The regulation mandates monitoring, reporting, and verification of methane emissions, leak detection and repair for oil and gas installations, and limits on routine f laring and venting.
Krzysztof Krawiec
France Is Poland’s Third-Largest Economic Partner
6% France’s share in Polish exports in Q1 2025
2.5% Poland’s share in French exports in Q1 2025
2.2% Share of jobs in Poland supported by final demand from French companies and consumers for Polish value added
In early May, Poland and France strengthened their bilateral partnership in the fields of security and energy through an agreement signed in Nancy. Enhanced defence cooperation is particularly significant in light of Russia’s ongoing invasion of Ukraine. However, official trade data in the defence sector do not yet reflect intensive exchange. While French defence exports to Poland increased in 2024, they accounted for just 0.1% of France’s total sector exports. By contrast, Polish exports to France in this category reached nearly 2% of Poland’s total defence-related exports.
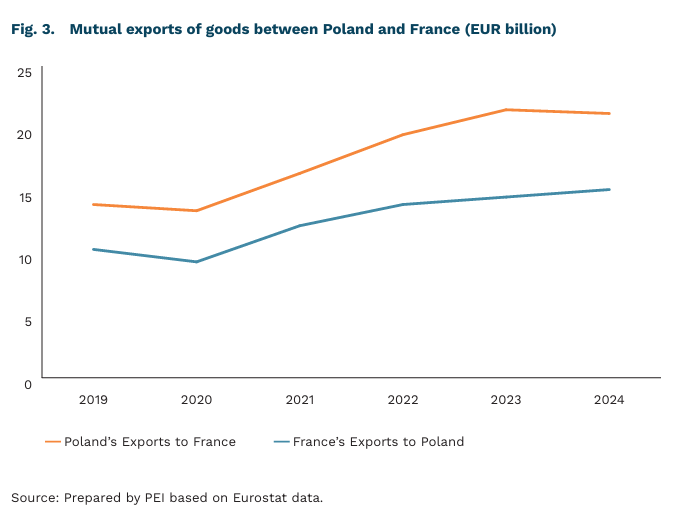
Since Brexit, France has consistently ranked as Poland’s third-largest export partner for goods. The United Kingdom, previously in the top three, has slipped in the rankings. In Q1 2024, France briefly overtook the Czech Republic to become Poland’s second-largest export market after Germany, but returned to third place in early 2025. The value of Polish exports to France has grown steadily in line with overall export growth, keeping France’s share stable at 6%.
Poland continues to maintain a positive trade balance with France. For years, trade between the two countries has generated a surplus for Poland, peaking at EUR 8.5 billion in 2022. However, this surplus has since declined, amounting to EUR 1.25 billion in the first quarter of 2025. France also runs a similar deficit in services trade with Poland, which has been increasing more markedly since 2020. Although Poland imports fewer French goods, its share in both French imports and exports has remained between 2% and 2.5% over the past five years. In this period, Poland ranked as the tenth largest destination for French exports.
France is the third largest foreign market for Polish value added, after Germany and the United States. As with goods exports, France accounted for approximately 6.1% of foreign demand for Polish value added in 2022. This corresponds to over 2% of total employment in Poland. In contrast, Poland plays a more modest role for France, ranking as the thirteenth largest source of demand for French value added, which amounted to 1.5% in 2022.
France is the fourth largest foreign investor in Poland. This holds true whether the assessment is based on ultimate investor countries or direct capital flow origin. French investment is concentrated in communications, real estate, logistics, and renewable energy. The highest volume of new (greenfield) investments occurred in 2021, when French companies invested nearly EUR 4 billion in Poland.
Marek Wąsiński
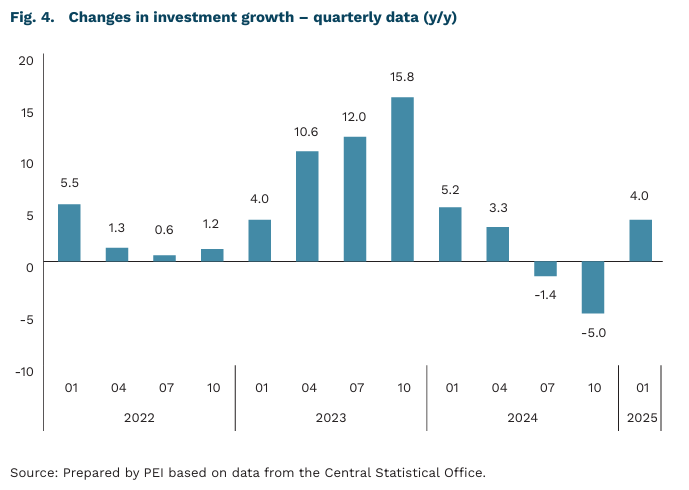
Investment growth drives the Polish economy
3.2% year-on-year real GDP growth in Q1 2025
4.0% year-on-year growth in investment (gross fixed capital formation)
The Polish economy entered 2025 in solid shape, although quarterly momentum eased noticeably. In the first quarter, GDP grew by 3.2% year-on-year, confirming earlier flash estimates and slightly down from 3.4% in Q4 2024. Seasonally adjusted GDP rose by 0.7% quarter-on-quarter. However, growth was more balanced than in previous quarters, and the composition of this growth revealed some notable developments – particularly in investment.
Investments rebounded surprisingly strongly, driven by public sector spending. The biggest surprise in the GDP structure was the marked year-on-year increase in gross fixed capital formation – by 4.0%, following a year-on-year decline of 5.0% in the fourth quarter of 2024. Such good results are difficult to attribute to the private sector – investments by large enterprises remain on a downward trend (down 3.6% year-on-year). The recovery was most likely public in nature and may have arisen from the accumulation of military spending, the inflow of EU funds, or accrual settlements in the national accounts. It is also worth noting that the Central Statistical Office significantly revised its data for the end of 2024, which may have lowered the reference base and partially strengthened the rebound effect.
Private consumption slowed down, but the fundamentals are conducive to a rebound. Household consumption increased by 2.5% year-on-year, significantly slower than in the previous quarter (3.5%). The slowdown arose from lower real income growth, limited by a decline in nominal wage growth and a temporary increase in inflation. At the same time, public consumption also slowed significantly (2.0% year-on-year compared to 7.6% in the fourth quarter), which may be linked to smaller wage increases in the public sector. In the coming quarters, however, improving income, lower interest rates and disinflation should support a rebound in private consumption.
Exports continue to weigh on growth, and the role of inventories in GDP growth is weakening. In the first quarter of 2025, the foreign trade balance reduced GDP growth by 1.1 percentage points, which means that foreign trade continues to have a negative impact on economic growth. Exporters continue to face growing global uncertainty and intensifying trade tensions, which limits the full exploitation of the recovery in global demand. At the same time, the contribution of inventory growth to GDP weakened significantly, from 3.4% in the fourth quarter of 2024 to 1.5% currently, suggesting a slowdown in the process of rebuilding inventories in companies. Gross value added rose by 2.0% year-on-year, slightly slower than in the previous quarter (2.2%), and sector data point to a slowdown in activity in industry, trade, ICT and finance. Nevertheless, the GDP growth scenario of around 3.7% for the whole of 2025 remains valid, especially in the context of the expected acceleration of private investment and consumption in the second half of the year.
Sebastian Sajnóg
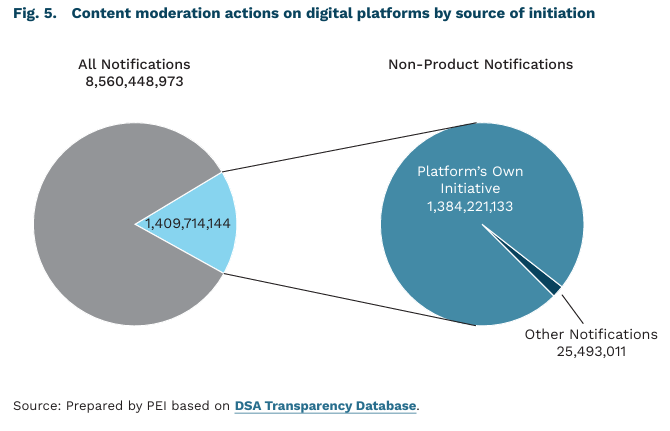
Online Content Moderation is Mostly at Platforms’ Own Initiative
8,560,448,973 content moderation actions were taken by online platforms in 2025
99.6% of these actions were initiated by the platforms themselves
Digital tensions between Europe and the United States increasingly revolve around content control and freedom of expression. However, most content removals appear to result from platforms’ internal policies rather than EU interventions. Between January and the end of May 2025, over 8.5 billion moderation decisions were made regarding content posted online. Of these, 99.6% were taken at the platforms’ own initiative.
Under the Digital Services Act (DSA), providers of certain digital services – including online platforms – are required to report data on content moderation. These disclosures help illustrate the scale of content that has been removed, demonetised, or had its visibility limited. They also specify the origin of each action – whether it was triggered by a user notification or the platform’s own initiative – and whether it was carried out automatically or involved human review.
Among the 132 platforms monitored by the European Commission, the highest number of content restriction actions was recorded on Google Shopping, accounting for 79.8% of all such actions, mainly related to posted products. TikTok followed with approximately 763 million moderation decisions, then Facebook with 238 million. By contrast, X (formerly Twitter) registered just 335,000 such actions.
When considering only cases that could be considered ‘censorship’ [2], 99.7% were actions taken by the platforms themselves, while just 0.3% were initiated externally. The latter comprised 1.382 million notifications – representing a small fraction of overall interference with user-generated content.
Freedom of expression has recently been a topic of debate between the European Commission and the U.S. administration. The American side – supported by some platform representatives – has accused the European Union of enforcing online censorship. Central to this criticism is the Digital Services Act (DSA), adopted in 2022, which redefines the obligations of companies facilitating the distribution of online content. However, data published under the DSA show that content restrictions primarily stem from the platforms’ own policies and enforcement practices. Rules limiting freedom of expression are largely self-imposed through detailed platform guidelines or standards. Regulatory interventions by the EU constitute only a small share of total moderation activity. Content moderation and restrictions are, therefore, widespread practices, with transatlantic differences rooted more in content sensitivity than in fundamental views on freedom of expression.
2. This category includes illegal or harmful speech, content that negatively affects civic discourse or elections, violations of data protection and privacy, and material that poses a risk for public security.
Mandatory Pay Ranges in Job Advertisements Lead to Wage Increases
1.4% increase in salaries in Colorado following the introduction of mandatory pay range disclosure by employers
3% increase in salaries for newly hired employees in Slovakia at companies that had not previously disclosed salary information, after the implementation of mandatory pay transparency regulations
In recent years, an increasing number of countries have implemented requirements to include salary information in job advertisements. In Europe, Austria, Slovakia, Lithuania, and Latvia have adopted such regulations. In the United States, ten states have similar rules in place. Salary transparency is also a key provision of the EU Pay Transparency Directive, which Member States must implement by June 2026. In Poland, parliamentary bill introducing this requirement is currently under consideration. However, the current wording of the bill raises concerns about whether including salary details in job postings will truly become obligatory.
Requiring salary ranges in job ads is widely regarded as a policy that strengthens employees’ bargaining power and contributes to higher wages. Employees often base their expectations on their current earnings, leading to an underestimation of what other roles may offer, especially among lower-paid workers. Wage transparency helps correct this by signalling where higher pay is available, encouraging workers to seek better-compensated opportunities and prompting employers to offer more competitive salaries.
Research to date indicates that including wage information in job advertisements does, in fact, lead to higher salaries. In Slovakia, wages for newly hired employees rose by 3% in companies that had not previously disclosed pay information, compared to firms that had always been transparent. In Colorado, the introduction of pay range disclosure resulted in a 3.6% increase in advertised salaries and a 1.4% increase in actual wages paid. Even current employees and workers in companies that had always disclosed salaries benefited from the policy, despite not being the direct target group. The study’s authors suggest that pay transparency at the recruitment stage enhances labour market competition.
The primary objective of the EU Pay Transparency Directive is to strengthen the enforcement of the principle of equal pay for women and men. Why would including salary ranges in job advertisements help reduce the gender pay gap? Because of differences in negotiation styles and knowledge of pay structures. Research shows that women are less likely than men to initiate negotiations, request raises, or feel confident in their understanding of salary benchmarks. However, gender differences in negotiation outcomes tend to diminish when employees have access to salary ranges or know that pay is negotiable.
That said, existing research on the impact of salary transparency in job postings on the gender pay gap yields mixed results. In Slovakia, the new regulation had no measurable effect on the gap. In Austria, increased transparency contributed to narrowing the gap at the lower end of the pay scale, but only in companies willing to offer wages above collectively agreed levels.
Marta Palczyńska