Economic Weekly 32/2025, August 18, 2025
Published: 18/08/2025
Table of contents
Poland Among Emerging Innovators
23rd place Poland’s position among EU Member States in the European Innovation Scoreboard (EIS) in 2025
+18 percentage points increase in Poland’s EIS index score compared to 2018
2 number of regions in Central and Eastern Europe ranked among Strong Innovators
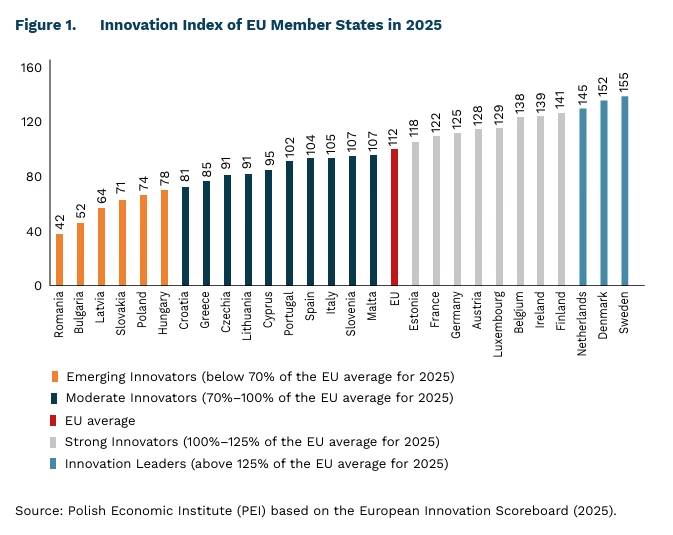
In 2025, Poland ranked 23rd among EU Member States in the European Innovation Scoreboard and 27th among the EU and neighbouring countries. Sweden regained its position as the most innovative EU Member State, overtaking Denmark, which had led from 2020 to 2024. The European Innovation Scoreboard provides a comparative assessment of national research and innovation systems across the EU. Poland’s performance improved by 18 percentage points compared to 2018, rising from 56 to 74 points. This steady growth reflects a systematic strengthening of the country’s innovation potential. However, Poland remains in the group of so-called Emerging Innovators.
It is worth noting that the innovativeness of an economy is closely interlinked with the level of development and the overall economic potential of a country. A comparison of the European Innovation Scoreboard with GDP per capita data shows that it is generally difficult for Member States to break out of this relationship and, for example, accelerate innovation performance beyond their overall level of economic development. Only Estonia, with its specific small-scale economy, achieved a higher position in the ranking than its GDP per capita would suggest. Conversely, the countries with the highest innovation scores, such as the Netherlands, Luxembourg and Denmark, are also among Europe’s leaders in terms of quality of life and prosperity.
In 2025, Poland outperformed the EU average primarily in three areas: design applications (intellectual assets), implementation of cloud computing technology (investment in information technology), and higher education (human resources). Conversely, the three indicators where Poland’s performance was least favourable compared to the EU were: the share of foreign students in doctoral programmes (attractive research systems), investment in high-risk capital (finance and support), and product innovation by SMEs (innovators). The performance of Polish SMEs lags significantly behind the EU average in implementing product and business process innovations, reaching only 28.5% and 50.8% of the EU average in 2025, respectively. These are the areas in which Poland faces the most significant challenges relative to the EU.
Based on data from the European Innovation Scoreboard, Poland recorded its largest improvement between 2018 and 2025 in the indicator reflecting the quality of digital infrastructure and investment in cloud computing technology. This reflects a substantial increase in the percentage of households with a fixed connection to a very high-speed network and in the number of enterprises using at least one medium- or high-level cloud computing service.
According to the Regional Innovation Scoreboard,(1) the level of innovation increased in 233 of the 239 EU regions between 2018 and 2025. The most innovative regions are typically located in the most innovative countries. In the 2025 edition, the European leaders were Stockholm (Sweden), Hovedstaden (Denmark), London (United Kingdom) and Zurich (Switzerland).
Regional data indicate that innovation in the EU economy remains highly concentrated. Only two regions in Central and Eastern Europe – Prague (Czech Republic) and Estonia – were classified as Strong Innovators, the second of four innovation performance levels in the EIS. Thirteen CEE regions were classified as Moderate Innovators, while as many as 40 were classified at the lowest level, Emerging Innovators.
However, convergence in terms of innovation is occurring within the EU. Compared to the 2018 results, the coefficient of variation among EU regions, which reflects disparities in the data, decreased from 36 to 32. Furthermore, an analysis of the so-called beta convergence shows that less innovative regions are improving their position relative to the EU average at a faster pace than the most innovative areas.
Compared with other countries worldwide, the EU is classified as a Moderate Innovator. It performs better than Mexico, South Africa, Chile, India and Brazil (Emerging Innovators), is on par with Japan (Moderate Innovator), and lags behind Australia, the United States, China and Canada (Strong Innovators). South Korea has consistently held the top position in the ranking since 2018.
- The ranking uses data on European regions and indicators included in the European Innovation Scoreboard.
Magdalena Lesiak, Marek Wąsiński
Polish Companies Optimistic About Their Short-Term Future
25% share of companies that believe their situation will improve in the next three months
6 percentage points year-on-year increase in the share of companies expecting improvement
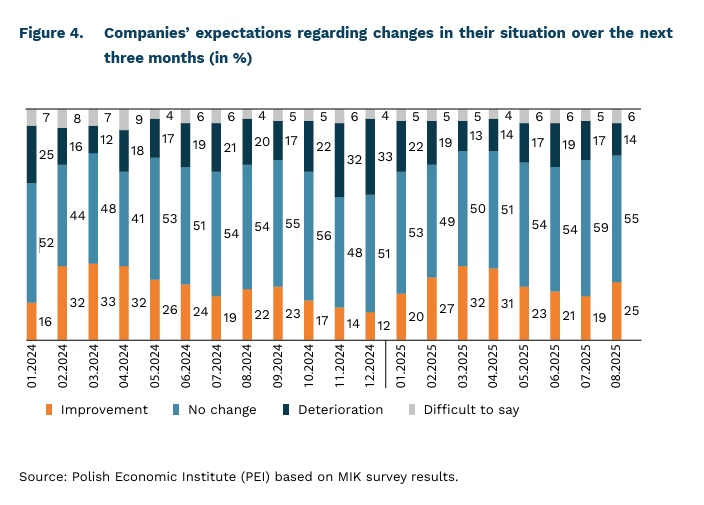
In August, significantly more companies expected their situation to improve than to deteriorate. According to a survey conducted for Monthly Business Climate Index (MIK) 25% of respondents anticipate improvement over the next three months, while 14% expect a deterioration. This is the most optimistic result since April this year. Over half of companies (55%) believe their situation will remain unchanged, while 6% are unable to predict it. Compared to the previous month, the share of companies expecting improvement rose by 3 percentage points, and compared to August last year – by 6 percentage points.
In August, representatives of trading companies were the most optimistic about the near future. Almost one-third expect their situation to improve over the next three months, while only 13% expect it to deteriorate. A clear majority of optimists over pessimists was also recorded in the transportation and storage sector (22% expect improvement vs. 10% deterioration) and among manufacturing companies (29% vs. 19%). Representatives of service companies (21% improvement vs. 13% deterioration) and construction companies (21% vs. 15%) were slightly less optimistic about their prospects.
In August, for the third time this year, more companies in all sectors expected their situation to improve than to deteriorate over the next three months. Since the beginning of 2024, when the question about future business conditions was introduced in the MIK survey, this has occurred five times. Conversely, situations in which the share of those expecting deterioration exceeded those expecting improvement across all sectors occurred only in November and December 2024. The most pessimistic forecasts for the next three months came from the transportation and storage sector, where since January 2024, those expecting deterioration have outnumbered those expecting improvement twelve times. In other sectors, this situation occurred only 5–6 times during the same period.
It is worth noting that over the past three months, the share of companies expecting a deterioration in the country’s overall situation has declined, while the share anticipating improvement has gradually increased. A positive trend is also reflected in recent macroeconomic indicators: since the beginning of the year, inflation has fallen, the unemployment rate has remained low, and GDP has grown. These developments have raised hopes that the positive economic signals in the coming months will be reflected in an improved MIK index, which measures the sentiment of Polish entrepreneurs.
Anna Szymańska
Power Grids Will Determine Further Expansion of Data Centres
2–3% share of data centres in total electricity consumption in Europe in 2023
62% share of all European data centres located in Frankfurt, London, Amsterdam, Paris, and Dublin (FLAP-D market)
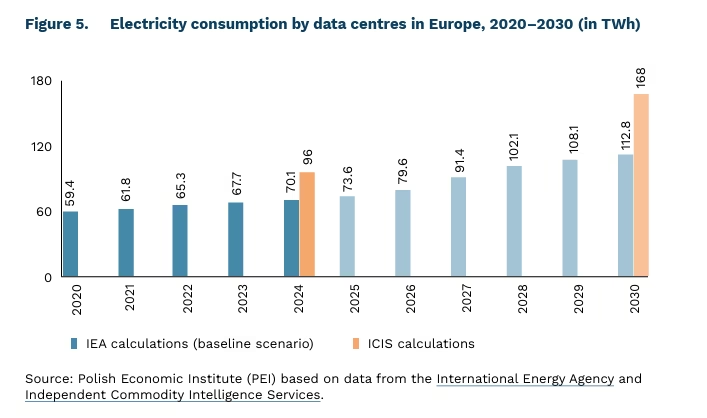
Data centres are a significant driver of energy demand. In 2024, they accounted for approximately 1.5% (415 TWh) of global electricity consumption. In the same year, European data centres consumed between 70 TWh and 96 TWh of energy, depending on the estimates used, representing 2–3% of the region’s total electricity demand. In the FLAP-D market (Frankfurt, London, Amsterdam, Paris, and Dublin), which has the highest concentration of data centres in Europe, these facilities accounted for 33–42% of electricity consumption in 2023 – and for almost 80% in Dublin alone.
The rise of artificial intelligence and other digital technologies is steadily increasing the demand for digital infrastructure, particularly data centres. Depending on AI-related demand growth and local restrictions on data centre construction, global electricity consumption in such facilities could reach 670-1,260 TWh by 2030 – a projected 61–204% increase between 2024 and 2030. According to International Energy Agency estimates, European data centres will consume 115 TWh in 2030, while data from Independent Commodity Intelligence Services project a higher figure of 168 TWh.
The overloading of power grids in FLAP-D areas is gradually eroding this market’s historical dominance. Currently, 62% of European data centres are located in the FLAP-D market, but this share could decline to 55% by 2030. One of the key factors determining the location of new facilities is the waiting time for grid connection. In areas with a high concentration of data centres, this averages 7-10 years, and in the United Kingdom it can be as long as 13 years. Phased connection could lower waiting times — data centres could apply for an immediate connection capacity below their target demand, with the remaining capacity being delivered over time. Flexibility measures, such as migrating tasks between data centres in different regions or using energy storage, will be crucial for integration with energy systems.
The rapid development of new digital technologies presents significant challenges for energy systems. The high energy intensity of data centres places additional strain on the grid, but their consumption profile also offers opportunities for greater demand flexibility. However, the growth of data centres is not solely a technical and infrastructural issue – it is also a social one. In Ireland and the US state of Virginia, which have the highest concentration of data centres in the world, recent years have seen waves of public protests. As with wind and nuclear energy, it is important for governments to require infrastructure owners to provide tangible benefits to local communities.
Marianna Sobkiewicz
The World Still Struggles to Eliminate Child Labour
8% share of the global population of children aged 5–17 engaged in work
138 million total number of children aged 5–17 engaged in work worldwide
In 2015, as part of the Sustainable Development Goals (SDGs), the international community committed to eliminating child labour entirely by 2025. However, according to estimates by ILO and UNICEF despite gradual progress in reducing its prevalence, child labour remains a serious global problem (Figure 6). In 2024, 8% of children aged 5–17 – or 138 million – were engaged in paid work, and nearly two-fifths of them (54 million) were employed in particularly hazardous conditions(2).
The highest number of working children is found in Sub-Saharan Africa – 87 million (22% of children in the region), accounting for almost two-thirds of the global total in 2024. In North Africa and Western Asia, 12 million children work (8%), in Latin America and the Caribbean – 7.3 million (6%), in Central and South Asia – 17 million (3%), in East and South-East Asia – 12 million (3%), and in Europe and North America – 1.3 million (1%).(3)
The share of working children is closely correlated with a country’s income level and overall development. In low-income countries, 24% of children work, compared to only 1% in high-income countries. In countries with low socio-economic development (HDI(4)), one in five children (20%) work; in medium-development countries, this figure is one in twenty (5%); and in countries with high and very high development, 4% and less than 2%, respectively.
Many commonly available products, including palm oil, clothing, and cocoa, are likely to have been produced using child labour, even in markets such as Poland. The Bureau of International Labor Affairs (US Department of Labor) maintains a public database listing products by country that are produced using child labour or forced labour.
Child labour is used, for example, in mica mining in the Indian state of Jharkhand. Mica obtained through child labour enters legal supply chains and is used in everyday products such as paints, cosmetics, plastics, paper, and building materials. Illegally mined mica involving child labour is mixed with legally sourced mica. As a result, all mica powder and f lakes exported from India, which are shipped to countries such as Japan, the United States, and Germany, are at risk of being linked to child labour.
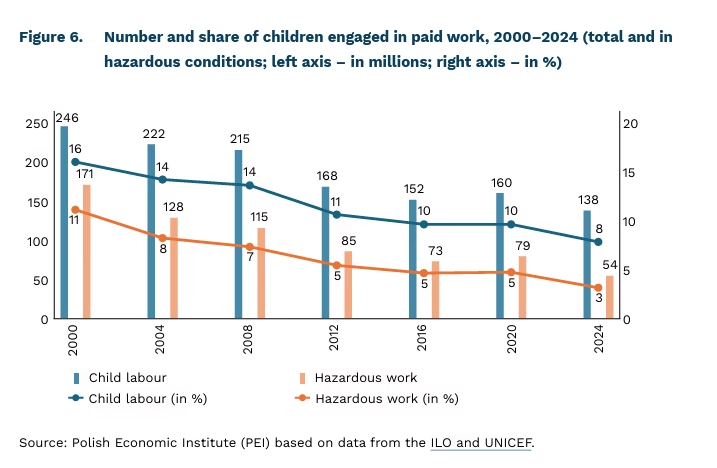
2. The ILO defines hazardous work as work which, by its nature or the conditions under which it is performed, is likely to harm the health, safety, or morals of children, for example, work that exposes them to violence, dangerous environments, harsh working conditions, or excessive physical exertion.
3. Regional division according to the SDG classification. Oceania is omitted due to insufficient data.
4. HDI (Human Development Index) is a UN measure of a country’s development based on life expectancy, education, and per capita income. A low HDI indicates a low level of development, limited access to education and healthcare, and low per capita income.
Iga Rozbicka
Soft Skills, Hard Results – How Does Scouting Shape the Competencies of the Future?
68.2 million estimated number of people belonging to the scouting movement worldwide
170,000 estimated number of people belonging to scouting organisations in Poland
17 percentage points higher participation rate in education or training in adulthood among those who were Scouts during their school years compared to those who were not
Scouting is the world’s largest educational movement for children and young people, active across all continents. The two largest organisations, the World Organization of the Scout Movement and World Association of Girl Guides and Girl Scouts, have a combined estimated membership of 68.2 million Scouts, with around three-quarters based in the Asia-Pacific region. Only 4% of the global Scout population comes from Europe. Following the COVID-19 pandemic, the number of Scouts increased in all regions of the world, with the most significant growth in the Americas and Africa. Globally, approximately 3.3% of people aged 7–24 are members of scouting organisations. In Europe, the figure is 1.45%, which is higher than in the Americas (0.73%) but lower than in Africa (1.7%) and the Asia-Pacific region (4%).
Scouting in Poland has long been one of the most important forms of extracurricular activity for children and young people. The estimated number of Scouts in Poland is at least 170,000. The largest organisation in this field – the Polish Scouting Association – had 110,300 members in 2023, up from 95,300 in 2020. The social impact of the scouting movement extends far beyond its formal membership, with an estimated direct reach of approximately 0.5 million Poles. Scouts also engage in activities outside the organisation, such as providing services during public ceremonies or assisting in crisis situations, which further amplify their social impact. Research by Public Opinion Research Center (CBOS) shows that scouting enjoys a high level of public trust in Poland, comparable to that of charitable institutions and the armed forces.
The scouting educational programme naturally fosters so-called hot skills – competencies that are in high demand today and will become increasingly important in the labour market. Employees with these skills are flexible, adaptable to change, able to solve problems, and actively contribute to organisational development. They communicate effectively, demonstrate empathy, manage emotions, and accept feedback, including constructive criticism. They take responsibility for their actions, have the courage to face challenges, and show respect for others.
The principles of scouting education align closely with the concept of lifelong learning, fostering readiness to acquire new knowledge and skills, and to pursue continuous personal and professional growth. Lifelong learning in scouting is structured around activities specific to the movement, recognised through a system of ranks and badges. These ranks and badges reflect the knowledge, skills, and attitudes achieved by a Scout or instructor.
Poland is among the EU countries with the lowest adult participation in learning. According to Eurostat, Poles take part in training almost twice as rarely as the EU average, with only Bulgaria and Greece reporting lower rates. Participation in extracurricular activities during school years is a key factor influencing learning in adulthood. Individuals who engaged in activities that developed social competences at school, such as scouting, are more likely to continue learning as adults than those who did not. This correlation holds true across all forms of adult education (5).
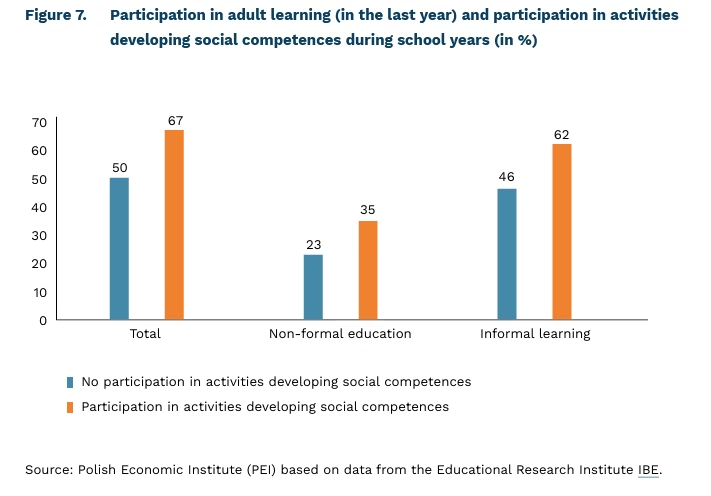
5. Non-formal education includes various types of courses, training, and workshops organised outside the formal education or higher education system. These activities typically do not lead to formal qualifications but help to acquire new skills. Informal learning refers to knowledge and skills acquired independently, e.g. at home or in everyday situations (GUS).
Cezary Przybył