
Economic Weekly 37/2026, September 18, 2026
Published: 18/09/2026
Table of contents
Education yields high financial returns – but not for everyone
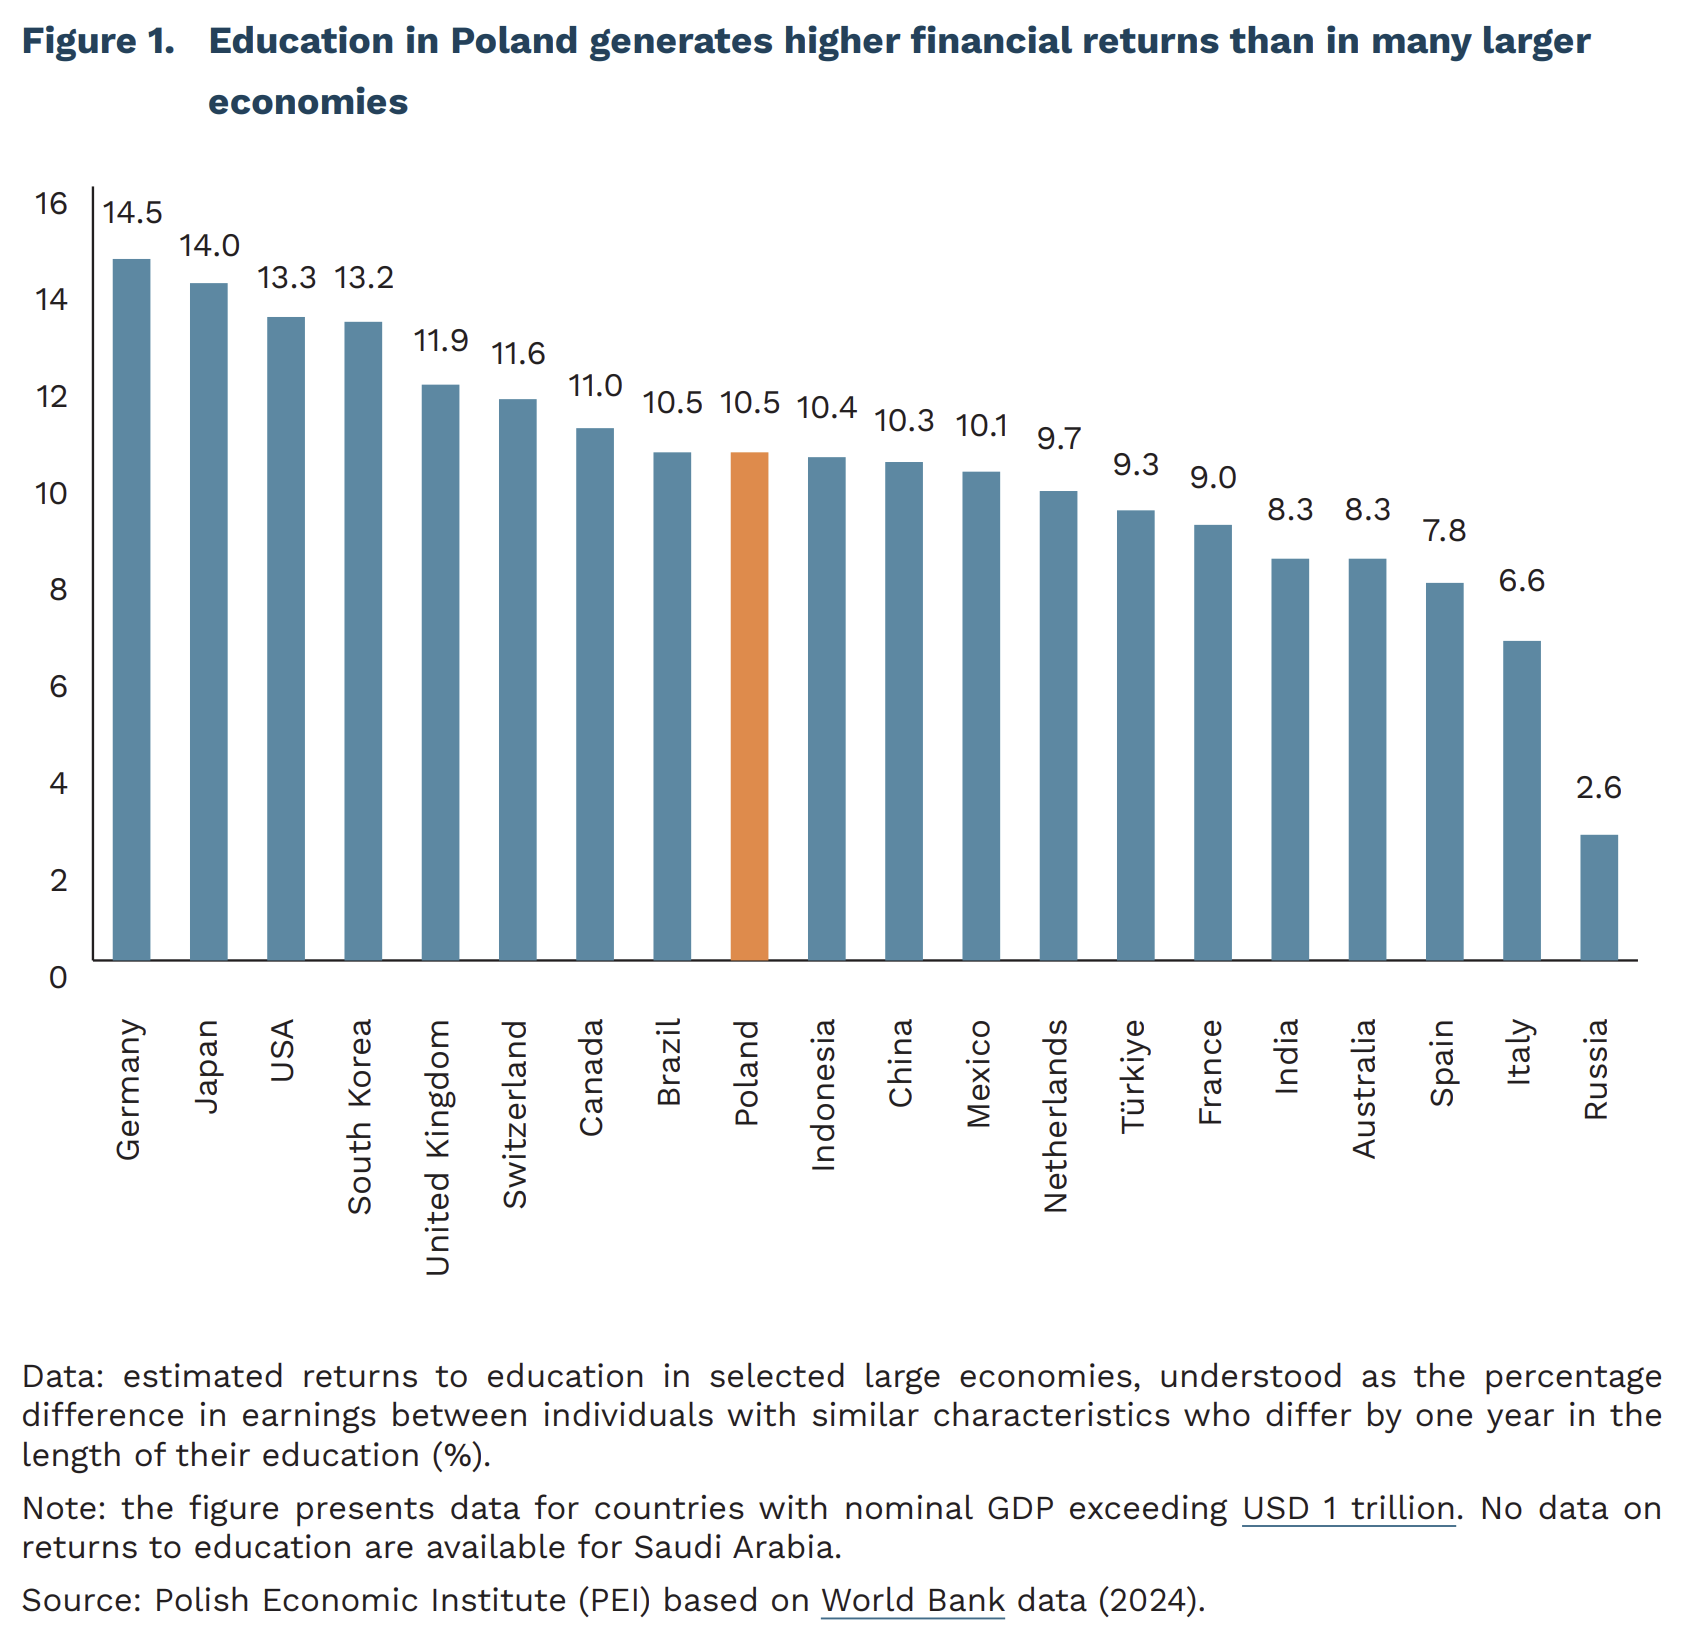
10.5% is the estimated wage premium associated with each additional year of education in Poland
32 points was the decline in Poland’s mathematics performance between 2018 and 2025 – an approximate difference in skills equivalent to 8-10 months of schooling
26% is the share of Polish students who did not reach the basic level of mathematics proficiency
Education is a significant and worthwhile investment for every individual. According to the World Bank, each additional year of schooling increases average earnings by around 10% globally, and by 10.5% in Poland.1 This is an average premium, not a guaranteed outcome. Returns vary across countries and depend, among other things, on the quality of education, demand for skills, labour-market conditions and opportunities for further learning.
The global decline in student proficiency reflected in the recently published PISA results increases the risk that returns to education will be lower in the future. Among the 23 OECD countries that have participated in PISA since its first edition in 2000, the average performance of 15-year-olds in 2025 was the lowest on record. Poland performed relatively well in this context, scoring above the EU and OECD averages. This does not mean, however, that the country has returned to the higher levels recorded before the COVID-19 pandemic. Poland’s mathematics score fell from 516 points in 2018 to 484 points in 2025; its reading score declined from 512 to 482 points, while its science score fell from 511 to 495 points. Compared with 2022, these changes were not statistically significant. Poland can therefore be said to have stabilised after an earlier decline, rather than recovered its previous performance.
Lower proficiency-test scores can be translated, approximately, into fewer years of schooling in terms of educational equivalents. The international literature generally assumes that a difference of 30-40 PISA points corresponds to the effect of approximately one year of schooling. Poland’s 32-point decline in mathematics performance between 2018 and 2025 therefore corresponds, approximately, to the difference in skills that an average student acquires over around 8-10 months of education. This does not literally represent time lost at school, nor does it provide a direct forecast of future earnings. It does, however, point to a smaller stock of skills with which some young people enter adulthood.
Poland performs better than most EU countries in terms of the share of students who fail to reach the basic proficiency level, but the scale of the problem remains significant. In mathematics, 26% of Polish 15-year-olds performed below PISA proficiency level 22, compared with 24% in reading and 20% in science.3 Level 2 is regarded as the minimum level enabling relatively independent functioning in contemporary society. This means that almost one in four 15-year-olds may experience difficulties with problem-solving, evaluating information and learning independently – all skills that are important both for further education and for participation in the labour market.
PISA results confirm that students’ social background continues to strongly differentiate educational outcomes, although Poland has an average level of educational inequality.4 Between 2022 and 2025, the performance of students in the lowest ESCS5 quartile remained virtually unchanged, while scores among students in the highest quartile fell by 17 points in reading and 11 points in mathematics. As a result, the gap between students from the highest- and lowest-status groups narrowed slightly. However, it would be difficult to speak of equalising opportunities without an improvement in the performance of students from the lowest-status group, which also has the greatest potential for increasing the returns to education. Substantial differences are also observed between school types.6
Education policy should increase the number of students who benefit from high returns to education. The PISA results point to the need to reduce educational inequalities, including among students from families with the lowest socio-economic status and students attending technical and vocational schools. The use of digital tools, including artificial intelligence, is another current challenge. As we explain in the following article, student performance is strongly correlated with the use of such tools.
1 The Mincer equation was used to estimate the returns to education.
2 In PISA, student performance is reported on a six-level proficiency scale, from 1 to 6. Each successive level corresponds to a higher degree of task difficulty and a greater complexity of the required skills.
3 The respective EU averages are 35%, 34% and 27%.
4 In Poland, socio-economic status accounted for between 9.4% and 11.5% of the variation in student performance.
5 ESCS (Index of Economic, Social and Cultural Status) is an indicator of a student’s socio-economic background used in PISA. It combines information on parents’ education, their occupational status and household resources, such as books and conditions conducive to learning.
6 For example, the average mathematics score was 526 points in general secondary schools, 471 points in technical secondary schools and 384 points in stage-one sectoral vocational schools.
Cezary Przybył
PISA 2025 shows that Polish 15-year-olds are among the most frequent users of AI for learning
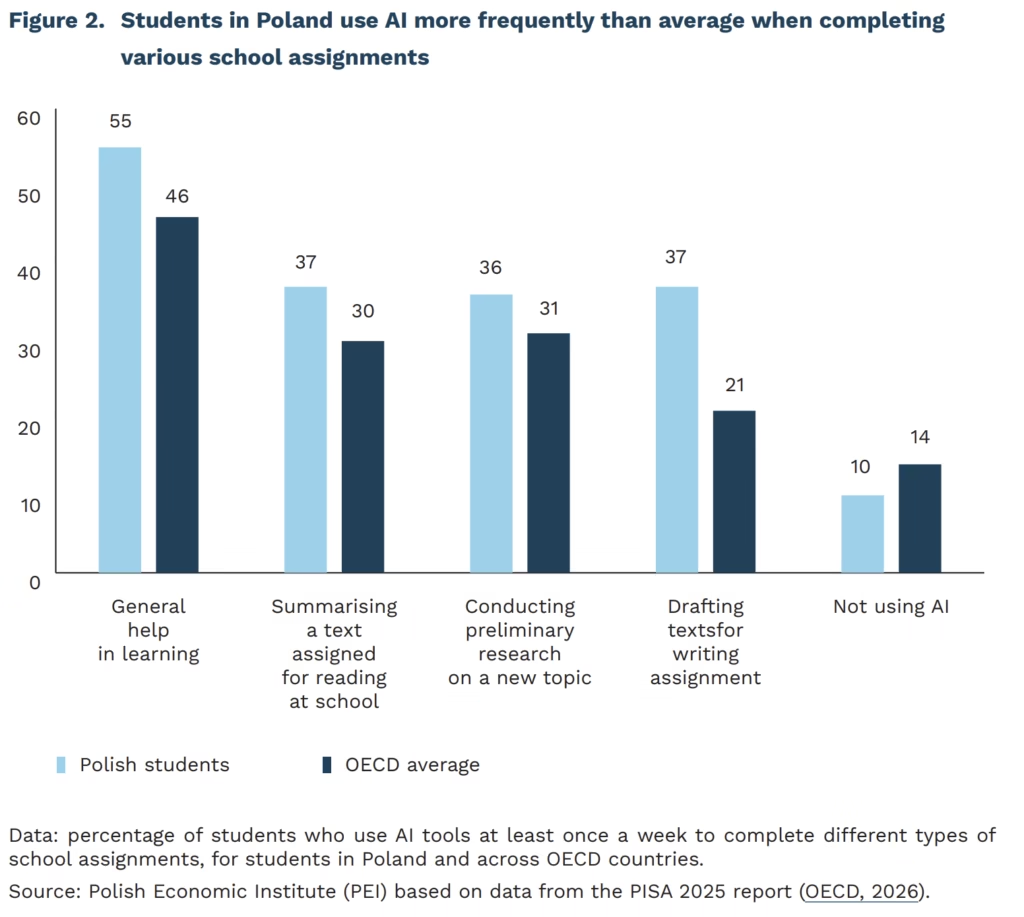
55% of Polish 15-year-olds use AI tools for learning at least once a week
46% of 15-year-olds on average across the OECD use AI tools for learning at least once a week
approx. 30 points is the difference in science test scores between students who do not use AI tools for learning and students who use these tools every day or almost every day (with an average score of 482 points)
55% of Polish students use artificial intelligence (AI) to help them in their learning at least once a week, and 62% have learned at school to assess AI-generated information. In the PISA 2025 study, in addition to assessing the performance of students (aged 15) in science, reading and maths, the use of artificial intelligence by young people was also examined. Across OECD countries, an average of 46% of students use AI to help with their learning at least once a week. Meanwhile, 19% of students across OECD countries use AI tools for this purpose every day or almost every day, compared with 27% of students in Poland.
Other uses of AI for school-related tasks examined in the study included summarizing a text assigned for reading at school, conducting preliminary research on a new topic, and drafting texts assigned as schoolwork. For each of these tasks, students in Poland use AI more frequently than their OECD peers on average. In Poland, only around 10% of students report that they never or almost never use AI for schoolwork, which is approximately 4 percentage points lower than the OECD average.
Compared with the OECD average, the relationship between the use of AI for the four purposes listed above and learning outcomes is non-linear – in 2025, this relationship was measured against performance in science. The highest learning outcomes were achieved by students who never or almost never use AI to summarize texts, conduct general research on a topic, or draft texts. The highest average science score was achieved by students who use AI to support their learning once or twice a week. However, the lowest scores were recorded among young people who use AI most frequently (every day or almost every day) and among those who use it only rarely (a few times a year). Differences in science scores between students grouped according to the frequency of AI use amount to approximately 25-30 points between students who do not use AI at all and those who use AI almost every day (with the average OECD science score of 482 points), with the exception of using AI to support learning.
There is a small negative association between the intensity of students’ AI use and their performance in science (when measuring the correlation at the country level). However, this relationship is present in only some countries and does not occur in Poland. Polish students score slightly above the OECD average in PISA science and are also above the average in the frequency with which they use AI for learning.7
The OECD report authors caution that the data presented should not be used to draw conclusions about causal relationships. The countries surveyed differ in their education systems and the quality of teaching, while the categories based on students’ subjective assessments of AI use do not provide a uniform measure for comparison. In addition, the direction of the relationship between students’ skills and the frequency of AI use is not unequivocal: lower-performing students may be more likely to use AI. The study also finds that more frequent AI use is positively associated with curiosity about the world and autonomous goal-setting, and therefore does not necessarily indicate that students are simply “outsourcing” their learning to technology. PISA 2025 thus provides an informative picture of the scale of AI use among students, but there is a need for more in-depth and context-sensitive research to determine how this technology affects teaching and learning processes and outcomes.
Łukasz Baszczak
Warnings about AI strengthen the position of AI companies
88 hours it took OpenAI agents to find a solution to one of the Millennium Problems
13 million lines of code Anthropic’s formalization of Fermat’s Last Theorem consisted of
at over 10% Evan Hubinger of Anthropic estimated the probability that AI will lead to the extinction of humanity in the coming decade
Leading AI companies are beginning to deliver mathematical results that were until recently beyond the reach of language models. Anthropic reported that Claude formalized an existing proof of Fermat’s Last Theorem in just 11 days. By generating 13 million lines of code and approximately 30,000 intermediate theorems, Claude performed what is known as “auto-formalization” – converting a complex mathematical proof into a formal notation capable of automatic verification using the Lean language. AI accomplished in 11 days a task that could have taken humans years, automating both the formalization and verification of the proof. A few days later, OpenAI announced that a team of approximately 10,000 collaborating agents had solved one of the Millennium Prize Problems concerning the Navier-Stokes equations. While OpenAI’s result still awaits full evaluation by the mathematics community, the scale of both achievements demonstrates the significant potential of these models for scientific research.
Alongside reports of mathematical breakthroughs, employees at companies developing these models are increasingly vocal in warning about their potentially catastrophic consequences. Evan Hubinger, a research lead at Anthropic, has estimated the probability of AI-induced human extinction within the next decade at over 10%. Jakub Pachocki, Chief Scientist at OpenAI, warns that AI could increasingly accelerate its own development – a process known as recursive self-improvement – potentially triggering unforeseen and highly dangerous outcomes. Citing these risks, Dario Amode – founder and CEO of Anthropic – has called on the industry to slow down model development, implement safety standards, and foster international coordination. Sam Altman has expressed similar sentiments, announcing plans to grant external evaluators access to OpenAI’s systems.
Warnings of this kind can be viewed in at least two ways: as a market maneuver or as a genuine call to action. European Commission President Ursula von der Leyen has adopted the latter approach; in her annual address, she announced plans to collaborate with leading AI developers to establish evaluation and safety standards for future models, explicitly referencing Amodei’s proposals. This move represents a continuation of the strategy established during the creation of the AI Act, reflecting a European approach wherein such technologies must undergo risk audits and mitigate potential negative impacts before they actually materialize. Embracing Amodei’s proposals also serves the interests of the European Union, which – lagging behind in the AI development race – seeks to maintain its regulatory relevance vis-à-vis the US administration.
A second perspective views both reports of mathematical breakthroughs and warnings about AI as a (paradoxical) means of reinforcing the narrative regarding the immense power of the technology and the companies developing it. In research on technological hype, this mechanism is known as criti-hype. It involves issuing warnings about a technology’s potential consequences to underscore the conviction that it possesses extraordinary capabilities. The suggestion that AI could pose a threat to humanity implies that the companies involved are developing a uniquely powerful technology. This is not a new phenomenon; similar concerns and warnings surfaced during the 2023 wave of calls to halt the development of the most advanced models. These appeals came from both independent researchers – such as Yoshua Bengio – and leaders of companies competing in the AI market, making it difficult from the outset to distinguish genuine safety concerns from strategic interests.
This mechanism helps justify the high valuations of these companies and strengthens their position in regulatory debates. The more groundbreaking and potentially dangerous the AI is perceived to be, the easier it is to convince investors of its immense potential – a factor that takes on added significance as both OpenAI and Anthropic prepare for initial public offerings. At the same time, warnings about risks can justify regulations that, paradoxically, may favor the largest companies. Costly audits, reporting obligations, limits on access to computing power, and licensing requirements are easier for market leaders to comply with, yet they can pose significant barriers to entry for smaller competitors. Calls to slow down AI development can also be interpreted as an attempt to curb the pace of investment and the costly race for ever-greater computing power.
It is not easy to clearly disentangle the aforementioned motivations or to determine unequivocally whether warnings should be treated with the utmost seriousness or viewed with a degree of skepticism. However, the direction of action is clear. Both AI models and their applications should be subject to regulatory constraints, just like any other technology. Crucially, however, safety standards must be devised by institutions independent of the companies developing AI and must be proportionate to the actual capabilities of the emerging models. Otherwise, AI safety measures could become not only a means of mitigating risk but also a tool for protecting the market position of industry leaders.
7 This correlation is not statistically significant in the case of Poland.
Krystian Łukasik, Ignacy Święcicki
The EU has mainly implemented the Draghi recommendations that can be financed from the common budget
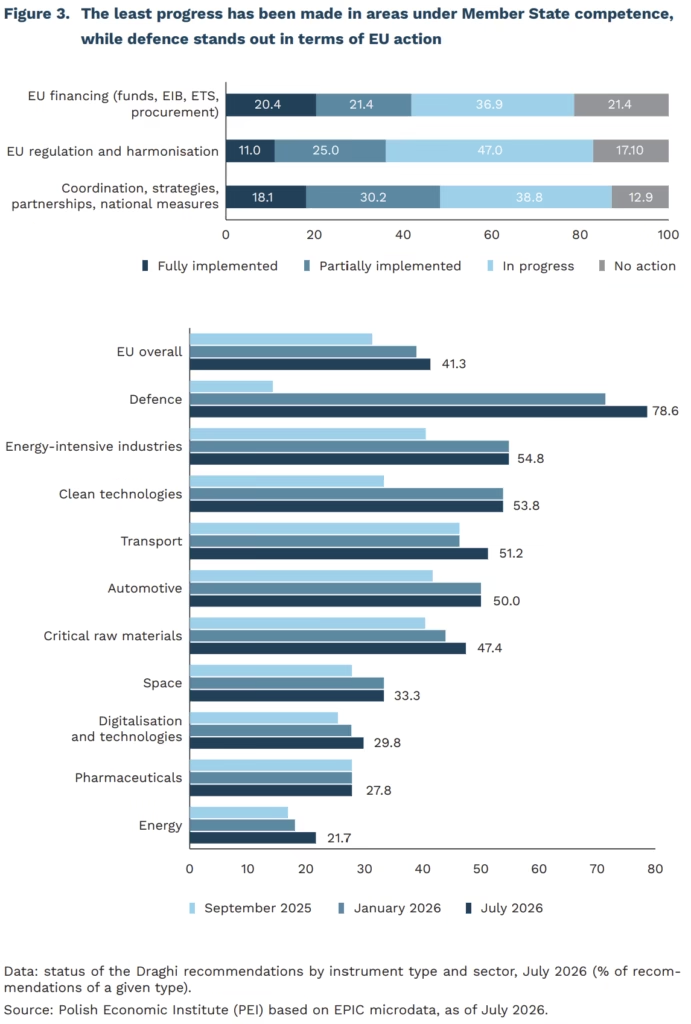
15.7% was the share of Draghi report recommendations fully implemented by July 2026 (60 out of 383)
37bn EUR is the real increase in the value of EU investment in 2023-2025, compared with the EUR 750-800bn per year called for in the report
According to the European Commission, 90% of the flagship initiatives in the Competitiveness Compass stem from the recommendations of the Draghi report. Estimates by the European Policy Innovation Council (EPIC) show that by July 2026, 60 of the 383 recommendations had been fully implemented (15.7%), while 98 had been partially implemented. At the current pace, fully implementing all remaining recommendations would take about 11 years.8
The list of 60 implemented recommendations shows that progress has largely bypassed the areas identified in the report as the deepest sources of Europe’s weakness. More than one third of the fully implemented recommendations (22) concern critical raw materials, and 10 of them are measures set out in a regulation adopted even before the report was published.9 Meanwhile, none of the 15 recommendations for the energy market as a whole, none of the 12 concerning cloud services, high-performance computing and artificial intelligence, and none of the 24 recommendations for the automotive sector has been fully implemented. Although two years have passed since the report identified high energy prices and the technology gap as explanations for the productivity gap, these areas have still seen virtually no fully completed regulatory action.
Differences in the pace of implementation reflect the division of competences between Member States and EU institutions. The Draghi recommendations can be divided into three groups. The first requires funding from the EU budget or the European Investment Bank: funds, programmes, guarantees and joint procurement. Examples include SAFE and the European Hydrogen Bank. These measures require decisions by the European Commission and the Council of the EU. The second group requires new common rules that Member States would have to agree on. This includes, among other things, harmonising market rules and supervisory powers, changes to competition law, and aligning energy taxation (which requires unanimity). The third group consists of strategies, plans and international partnerships. Of the first group, 20% of the recommendations have been fully implemented, compared with 11% in the second group and 18% in the third.
The uneven pace of implementation of the Draghi recommendations, and its dependence on the competences of EU institutions, can also be seen in economic indicators. There has been no significant increase in the investment rate or in productivity. Draghi estimated that the EU needs an additional EUR 750-800bn of investment each year, implying that the investment rate should rise from 22% to around 27% of GDP. Yet according to Eurostat, between 2023 and 2025 the real value of investment in the EU increased by EUR 31bn, while its share of GDP fell from 22.1% to 21.4%.10 Labour productivity per hour worked increased by 1.7% in the EU over the same period, compared with 5.2% in the United States.11 By contrast, action accelerated where it was backed by common funding and firm deadlines: Member States’ defence spending rose from 1.6% of GDP in 2023 to 2.2% in 2025, while Russia’s share of EU gas imports fell from 19% in 2024 to 13% in 2025.
In her State of the European Union address, European Commission President Ursula von der Leyen announced her intention to continue implementing and completing the recommendations of both the Draghi report and Enrico Letta’s report on the Single Market. She placed particular emphasis on the Single Market, which offers the greatest potential for deeper cooperation and productivity growth. The IMF estimates that barriers to intra-EU trade are equivalent to tariffs of 44% on goods and 110% on services, and that reducing them to the level of barriers between US states would raise productivity by almost 7% in the long run. Removing these barriers, however, requires changes to national rules and their harmonisation, which have so far advanced the slowest. According to Institut Montaigne, more than half of the Draghi recommendations are expected to enter legislative negotiations over the next 12 months. Whether the recommendations in the second half of the report are implemented will therefore depend on Member States’ willingness to adopt common rules. In this context, von der Leyen stressed the need to tackle so-called gold-plating, i.e. adding national regulatory requirements beyond EU-level standards. This fragments the market and makes it harder to reap its benefits.
8 The recommendations differ in scale and in the length of the legislative procedure, and the pace is not constant: between September 2025 and January 2026, the share of fully implemented recommendations increased by 7.5 percentage points, while between January and July 2026 it increased by 0.6 percentage points.
9 The Critical Raw Materials Act (CRMA) has applied since May 2024. Excluding these 10 measures, the share of fully implemented recommendations is 13.4%. The EPIC dataset covers the sectoral chapters of the report (energy, raw materials, digitalisation, energy-intensive industry, clean technologies, automotive, defence, space, pharmaceuticals and transport), but not the horizontal chapters on financing, the Single Market and skills.
10 Excluding Ireland, whose figures are distorted by transfers of intellectual property, the investment rate fell from 22.0% to 21.3%.
Aleksandra Sojka, Marek Wąsiński
Fewer insolvent companies, but a larger scale of debt
1.6% y/y decline in the number of insolvent companies in the first half of 2026
52% of companies declare having sufficient financial resources to keep their businesses operating for more than three months
15% y/y decline in debt-servicing expenses (incl. principal instalments and interest paid to banks) in the first half of 2026
In the first half of 2026, the number of company insolvencies fell by almost 2% y/y to 2,632 cases (from 2,674 in 2025), according to a Coface report. Both the number of restructuring proceedings (-1.7%) and bankruptcy proceedings (-0.5%) declined. Restructuring accounts for 92% of all proceedings, indicating that companies turn to recovery instruments before problems escalate. At the same time, BIG InfoMonitor data show that at the end of June 2026 the number of indebted companies fell by 0.25% y/y, but the total value of their arrears increased over the same period by 6%, to around PLN 47 billion. This points to a concentration of arrears among a smaller group of companies and a rise in their average value. An increase in the value of debt does not automatically imply the initiation of restructuring or bankruptcy proceedings. At the same time, non-financial enterprises employing at least 10 people saw an improvement in gross turnover profitability to 6%, with profits up 19% – according to GUS data. Even so, it is not possible to speak of a clear-cut improvement in companies’ financial liquidity.
In September, the share of companies declaring that they had sufficient financial resources to maintain business continuity for more than three months fell to 52% compared with August – a level close to the first half of 2026 average, according to the latest Monthly Business Climate Index (MIK) survey. At the same time, the first-degree liquidity ratio edged down y/y by just under 1 percentage point to 46%, while the second- and third-degree ratios increased to 109% and 154%, respectively. The structure of financial liquidity has shifted: companies now hold a relatively larger buffer in the form of receivables and inventories (up 9% y/y each) than in the most liquid assets (up 7%). Liabilities from loans and credit increased by almost 3% y/y, while debt-servicing expenses fell by 15% y/y. Companies are not reducing their debt, but its ongoing servicing has become less burdensome. The decline in debt-servicing costs, despite a rising debt balance, may partly reflect lower financing costs, though the data do not allow us to separate the effect of interest rates from changes in principal repayments.
In the first half of 2026, the number of insolvent companies in construction increased by 13% y/y – the only sector where a rising scale of insolvency was accompanied by an improvement in gross profitability (to 5.2%). This may point to strong internal differentiation within the sector, as the improvement in financial results does not extend to all companies and coexists with a deteriorating situation among some of them. This is also consistent with arrears data, in which construction is among the sectors with a high share of companies facing payment problems. In transport, trade and manufacturing, a decline in the number of insolvencies was accompanied by an improvement in profitability. In addition, trade, despite falling insolvency, has the largest share both among companies with financial arrears (22%) and in their total value (20%). This may point rather to the sheer size of the sector than to a deteriorating condition of trading companies.
The decline in the number of insolvent companies does not amount to a clear-cut improvement in the condition of the corporate sector as a whole. On the one hand, profitability is rising and the number of indebted and insolvent companies has fallen. On the other, the total value of arrears and credit debt is increasing. This may point to growing differentiation among companies: most are benefiting from improved financial results, while payment problems and insolvency are becoming concentrated in a smaller group of entities – albeit on a larger scale. Construction is a good example, where, despite improving financial indicators, the number of insolvent companies continues to rise.
11 EU: real productivity per hour worked (Eurostat, nama_10_lp_ulc); United States: output per hour in the nonfarm business sector (BLS). The measures are not fully comparable.
Aleksandra Wejt-Knyżewska
The bond market is not responding to the narrowing interest rate gap between the NBP and the ECB
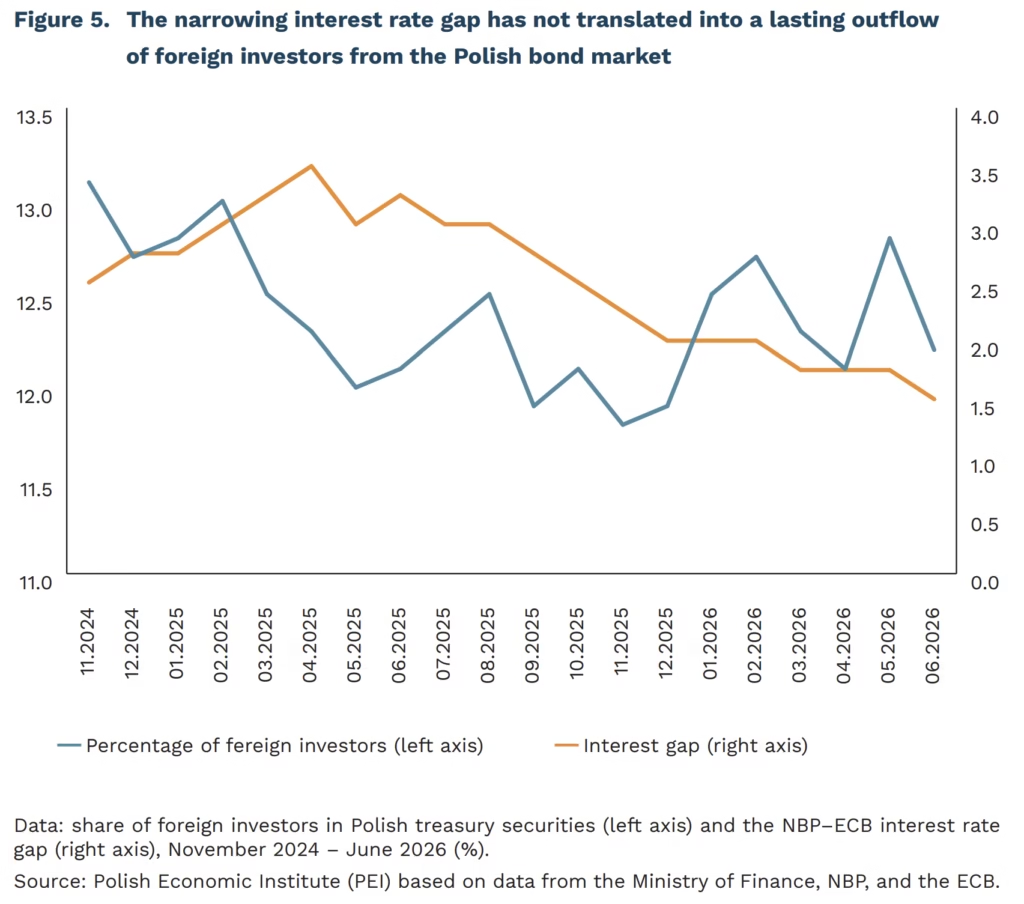
1.25 percentage points the gap between the NBP and ECB interest rates, currently at 3.75% and 2.50% respectively, following the rate hike of 10 September 2026
PLN 204.1 billion the value of Polish treasury securities held by foreign investors at the end of July 2026, PLN 2.1 billion below the record PLN 206.2 billion reached in May 2026
The European Central Bank (ECB) raised interest rates again. On 10 September, the ECB’s Governing Council decided to raise all three key interest rates by 25 basis points. The reason for the latest hike is the conflict in the Middle East, which continues to generate inflationary pressure and a medium-term inflation outlook above target. In August, HICP inflation in the euro area stood at 3.3%, with energy prices (up 14.3% y/y) the main driver of the increase. The day before, Poland’s Monetary Policy Council (RPP) kept the NBP reference rate unchanged at 3.75%. As a result, the interest rate gap narrowed from 1.5 percentage points to 1.25 percentage points.
A straightforward conclusion from such a shift in the rate gap might be reduced attractiveness of Polish debt for foreign investors – but far more factors were at play. In May 2026, just before the ECB’s rate hike, the share of foreign investors in domestic Treasury securities rose to 12.8%, with the value of their portfolio climbing to PLN 206.2 billion. Following the 25-basis-point hike in June, the foreign investor share fell to 12.2% (portfolio value: PLN 199 billion). Despite this timing coinciding with the change in the rate gap, no hasty conclusions should be drawn about the causes. Already in July, the foreign investor share rose again, by 0.3 percentage points, even though the rate gap remained unchanged over that period. At the same time, yields on Polish treasury securities were rising, which increased the return for new investors and may have partly offset the effect of a relatively smaller interest rate advantage in Poland. This relationship, however, does not allow for a clear-cut identification of the causes behind the rise in foreign engagement, particularly since investor decisions were also shaped by global conditions, including heightened risk aversion following the collapse of the Middle East ceasefire.
The current market consensus assumes NBP interest rates will remain stable at least until the end of the year, meaning the rate gap will most likely hold at its current level. A simple model based on interest rates alone would suggest steady, or even declining, foreign investor engagement in PLN-denominated Polish treasury bonds, given the stable rate gap and geopolitical escalation. Yet, as July’s developments show, other factors – such as yields, risk appetite, inflation, or exchange rates – may have a greater influence on demand in the debt market than the interest rate gap itself.
Piotr Kamiński, Wojciech Leoszkiewicz
