Economic Weekly 14/2026, April 10, 2026
Published: 10/04/2026
Table of contents
Economic problems set the tone for Hungary’s parliamentary elections
5.8% the average inflation rate in Hungary over the last ten years (the highest in the EU)
0.4% Hungary’s GDP growth in 2025
29% of the value of greenfield projects announced after 2018 came from Chinese investment
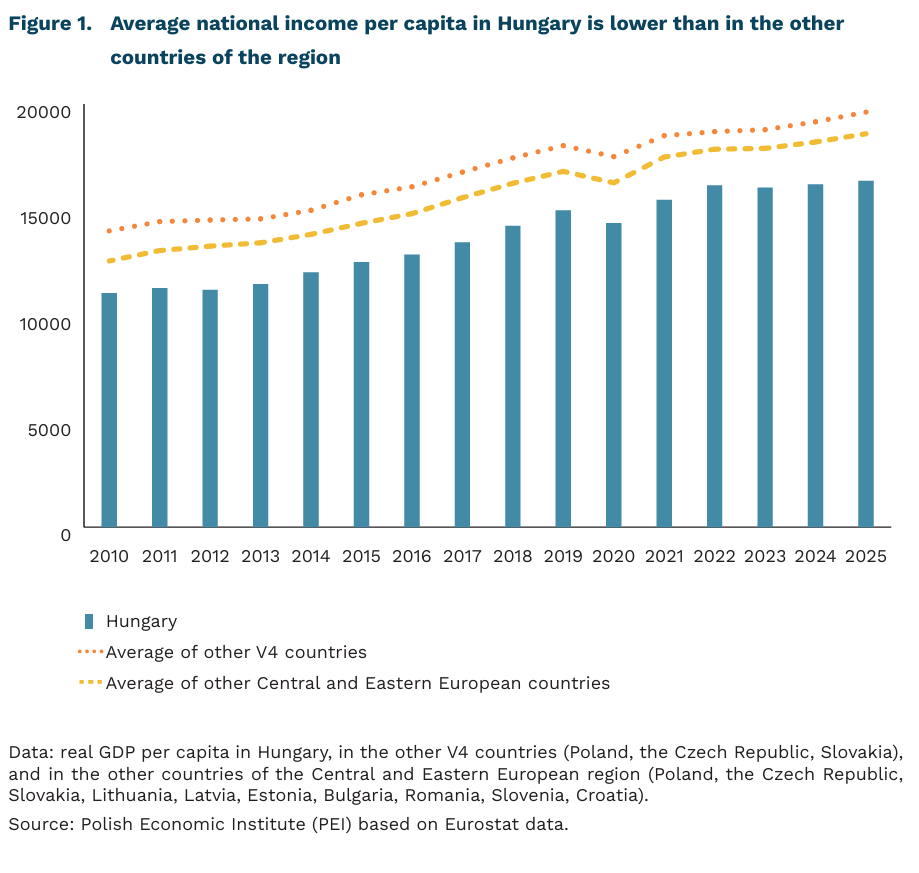
The worsening economic situation will be one of the key factors shaping the outcome of Hungary’s parliamentary elections on 12 April. Since the beginning of Viktor Orbán’s rule, Hungary has grown more slowly than the average for the Visegrad Group (V4) countries. Weaker growth was particularly visible during periods of global disruption, but in recent years it has become a persistent trend. According to preliminary data, Hungary’s GDP growth in 2025 amounted to only 0.4%, which means that the economy has not grown significantly since 2022. This stagnation means that Hungary converge with the EU level more slowly than the other countries of Central Europe. In 2025, GDP per capita in purchasing power standards stood at 76% of the EU average, while in Poland it reached 81%. Ten years earlier, the level of convergence with the EU was the same in both countries.
Persistently high inflation is one of the main issues shaping the electoral debate. Over the last ten years, inflation in Hungary was the highest among all EU member states. Average annual HICP inflation in that period stood at 5.8% in Hungary, while the average for the current 27 EU countries was 2.9%. Hungary is also among the EU countries with the lowest wage levels. In 2024, average annual full-time adjusted wages in Hungary amounted to EUR 18,461 (the third lowest), while in Poland they reached EUR 21,246. Another problem is the weakening of the forint (HUF), caused in part by the freezing of EU funds worth around 8% of Hungary’s GDP. This was the result of a years-long dispute with Brussels over the rule of law and corruption.
Hungary’s growth model was based to a large extent on attracting foreign direct investment (FDI). During the first ten years of Orbán’s rule, Hungary successfully brought in mainly German investment from the automotive sector. In later years, although investment from EU countries remained crucial, the authorities also sought to attract investment from China. As a result, in 2018-2025 nearly every third US dollar of greenfield FDI came from China (fDi Markets data). These funds were allocated primarily to the construction of large battery and electric vehicle factories. As the SpotData report shows, however, the large inflow of FDI did not translate into productivity growth in domestic firms; moreover, the contribution of foreign firms to domestic value added has been declining since 2015. The oligarchic system that has strengthened during Orbán’s years in power, together with a public procurement system favouring bidders loyal to the government, has further weakened competition and the chances of moving up in global value chains.
A victory for the opposition Tisza would likely lead to improved relations with the EU, greater investor confidence, and better chances of unblocking EU funds frozen by the European Commission. However, without a constitutional majority, far-reaching reforms of the economic system will be difficult. According to most forecasts, Hungary can expect, at best, moderate economic growth this year (2.1% according to the IMF).
Jan Strzelecki
The insurance market is growing, but an increasing number of drivers do not hold compulsory motor third-party liability insurance
351 thousand was the number of identified cases of missing compulsory motor third-party liability insurance in 2024
24.3% year-on-year was the increase in the sector’s net financial result in 2025
PLN 33.3 billion was the value of motor insurance policies alone in 2025, making them the largest segment of the market
The Polish insurance market recorded a noticeable increase in value in 2025, as shown by data from Statistics Poland. The net financial results of the entire sector rose to PLN 12.47 billion, up 24.3% year-on-year, while gross written premium increased to PLN 90.6 billion. This means that, alongside market expansion, profitability also improved.
Growth was recorded in both life insurance and non-life insurance, although it was stronger in the segment of other personal and property insurance. Gross written premium amounted to PLN 24.8 billion in Division I (life insurance) and PLN 65.8 billion in Division II (other personal and property insurance). In Division II, premium growth reached 6.0%, while in Division I it was 5.2%. This is even more evident in direct business, where Division II already accounted for 71.2% of premiums, compared with 28.8% for Division I.
Claims and benefits paid grew rapidly, but this did not prevent an improvement in performance. Gross claims and benefits paid increased in 2025 to PLN 53.8 billion, up 7.0% year-on-year, in both Division I and Division II. This pace was higher than the growth of total premiums, showing that cost pressure on the claims side has not disappeared. Despite this, the sector improved both its financial and technical result, suggesting that the larger scale of operations, the structure of products sold, and investment income provided insurers with a greater buffer than a year earlier.
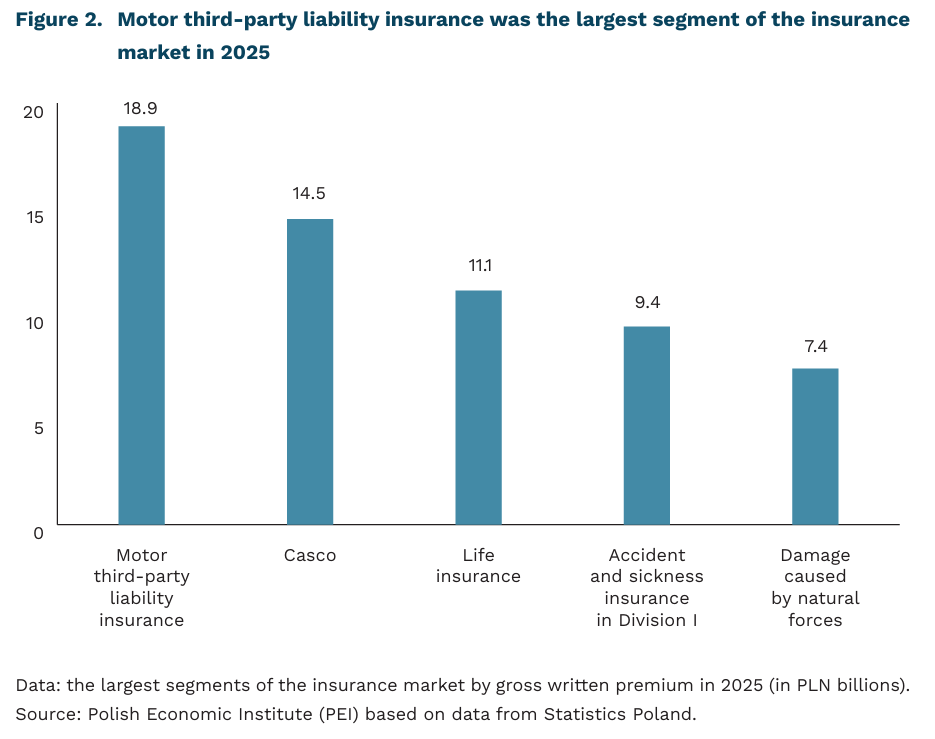
Motor insurance remained the largest pillar of the market, reaching a value of PLN 33.3 billion. The highest values were recorded for compulsory motor third-party liability insurance (PLN 18.9 billion), motor own damage insurance (PLN 14.5 billion), life insurance (PLN 11.1 billion), and accident and sickness insurance in Division I (PLN 9.4 billion). Among the major groups, the highest growth rates were recorded for insurance against damage caused by natural forces (+11.5%), general liability insurance (+8.8%), compulsory motor third-party liability insurance (+8.3%), and motor third-party liability insurance as a whole (+7.4%).
At the same time as the insurance market is growing in value, the number of drivers without compulsory motor third-party liability insurance is also increasing. The Insurance Guarantee Fund indicates that the number of identified cases of missing compulsory motor third-party liability insurance rose from 328 thousand in 2022 to 349 thousand in 2023 and 351 thousand in 2024. This means that despite the high share of motor insurance in the market and the rising value of premiums, some vehicle owners still remain outside the system of compulsory coverage.
Jakub Kubiczek
Renewables continue to grow in the U.S. despite headwinds from federal policy
1.5 percentage points increase in the share of renewables in U.S. electricity generation in 2025
2× increase (from 11 GW to 26 GW) – growth in newly installed battery storage capacity
$16 billion year-on-year higher total investment in renewables in the U.S. power sector in 2025 compared to 2024
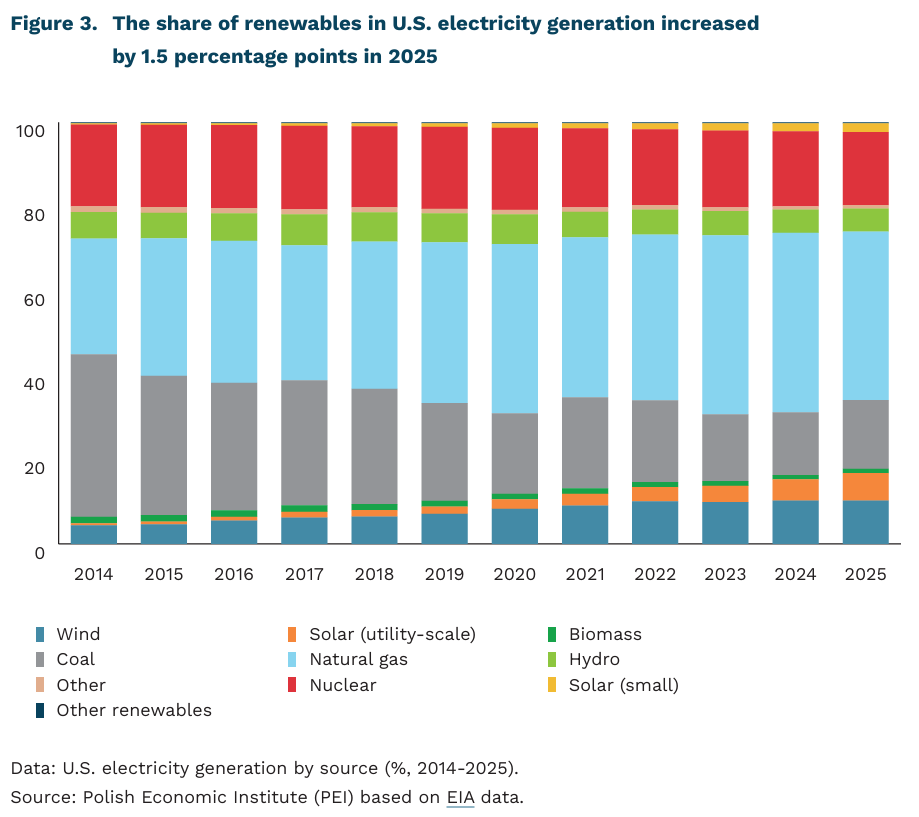
The share of renewables in U.S. electricity generation increased from 24% to 25.5% in 2025. This growth was driven primarily by the expansion of utility-scale solar (above 1 MW), with generation rising from 220 TWh to 296 TWh. Solar energy accounted for 61% of the increase in electricity demand in the United States. The largest increase in solar generation was observed in Texas, at 19 TWh. In total, nearly 30 GW of new solar capacity was installed in the U.S. in 2025 (a slight decline compared to 31 GW in 2024). At the same time, the pace of battery storage deployment doubled, reaching 26 GW (up from 11 GW in 2024).
In Q4 2025, actual investments in renewable electricity totaled $24 billion, of which $18 billion was allocated to utility-scale solar (above 1 MW) and energy storage. At the same time, announced investments reached $22 billion in total – $11.5 billion in solar, $8.4 billion in storage, and $2.1 billion in wind.
Although renewable investments remained higher than in 2024 overall, they declined by nearly $3 billion in Q4 compared to Q3 (with decreases of about $1 billion each in solar and wind, and $700 million in battery storage).
This slowdown was driven by several administrative factors. At the beginning of Q4 2025, the federal government entered a 43-day shutdown, which led to delays in projects requiring administrative approvals. In addition, the federal government revoked previously granted permits and canceled environmental reviews for some solar projects.
The wind sector faced even stronger negative impacts from federal actions. At the end of December 2025, the Department of the Interior ordered an immediate halt to the construction of five major offshore wind projects, putting $28 billion in private investment at risk. In 2026, a court ordered the reversal of the administration’s decision. Following the ruling, the U.S. government entered negotiations with one of the investors – TotalEnergies, responsible for two of the five projects – and offered a refund of $928 million paid for lease rights. In return, the company agreed not only to abandon these projects but also to withdraw from future offshore wind development plans in the United States.
Meanwhile, the Department of Energy announced significant cuts to energy-related funding. As of November 2025, it was estimated that support worth $23 billion across the broader energy sector had either been withdrawn or was under consideration for withdrawal. This included numerous research and development projects aimed at reducing the cost of solar energy (85 projects totaling $330 million).
According to White House announcements, further reductions in federal support for the energy transition are planned for 2026. These include the withdrawal of $15 billion in funding for renewables and carbon capture technologies under the Green New Deal, $6 billion allocated for electromobility programs, and $2.5 billion from the Office of Energy Efficiency and Renewable Energy (EERE).
Adam Juszczak
The number of older workers in the Polish labour market is growing
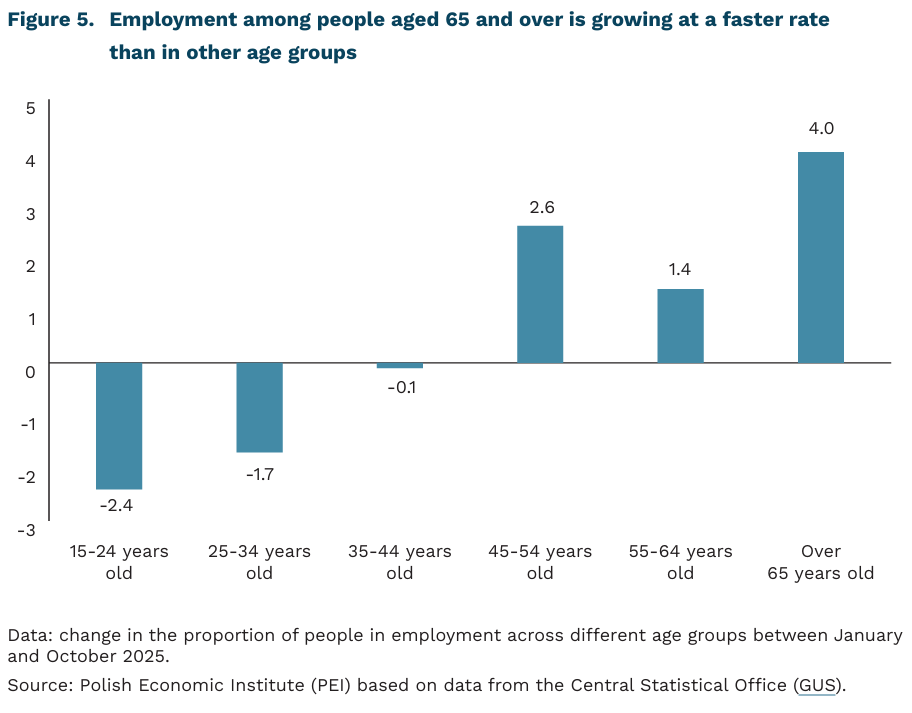
The number of workers of retirement age on the Polish labour market is steadily increasing. Between January and October 2025, the number of people aged 65 and over in employment rose by 4.0%. In October 2025, 524,000 people aged over 65 were in employment in Poland. The rise in employment among workers in this age group was significantly stronger than in other age groups, whilst in the youngest age group, i.e. those aged 15-24, we observed a significant fall in employment (by 2.4%).
The employment structure of people aged over 65 shows a clear predominance of the smallest businesses. 57% of all economically active older people work in micro- enterprises (up to 9 employees). This is due to the fact that many people of retirement age run their own businesses or work part-time in family businesses. The data illustrate a clear negative correlation between the size of the employing entity and the proportion of employees in the oldest age group. In the largest employers with over 1,000 employees, this proportion is only around 6.7%. The dominant share of older workers among the self-employed and in micro-enterprises is likely due to the fact that smaller firms offer employees greater flexibility regarding the form and timing of their work than the largest employers.
An industry analysis based on PKD sections confirms that older workers are most commonly employed in traditional sectors of the economy, particularly those facing the most severe labour shortages. In the retail and manufacturing sectors, 14.1% and 12.7% of employees, respectively, are aged over 65. In turn, 11.7% cent of older workers are employed in healthcare, 10.4% cent in education, and 8.6% cent in agriculture. Among these sectors, the employment of older workers in healthcare and education is of critical importance. Both sectors are particularly vulnerable to the effects of demographic change. According to a 2024 PIE analysis, the decline in the workforce in education was projected to reach 29% by 2035, whilst the decline in healthcare staff was projected to reach 23%.
The growing proportion of people aged over 65 in the Polish labour market is partly due to demographic changes. The decline in the number of births, which has been ongoing for many years, is reflected in the labour market, amongst other things, by the fact that the cohorts entering the labour market are, on average, half the size of those becoming eligible for retirement. In 2024, among those entering the labour market (i.e. aged 20-24), the average cohort size was 353,000, whilst the average cohort size of those of pre-retirement age was 450,000. For the labour market, this represents a shortfall of 97,000 people, excluding foreign migrants. In 2004, the size of the cohorts entering the labour market was almost twice that of the cohorts of pre-retirement age. On the other hand, the employment of older workers is also influenced by economic pressures, namely the declining value of their first pension relative to their last salary, as well as the tax relief measures in force from 2022, namely the exemption of their income from personal income tax.
Paula Kukołowicz
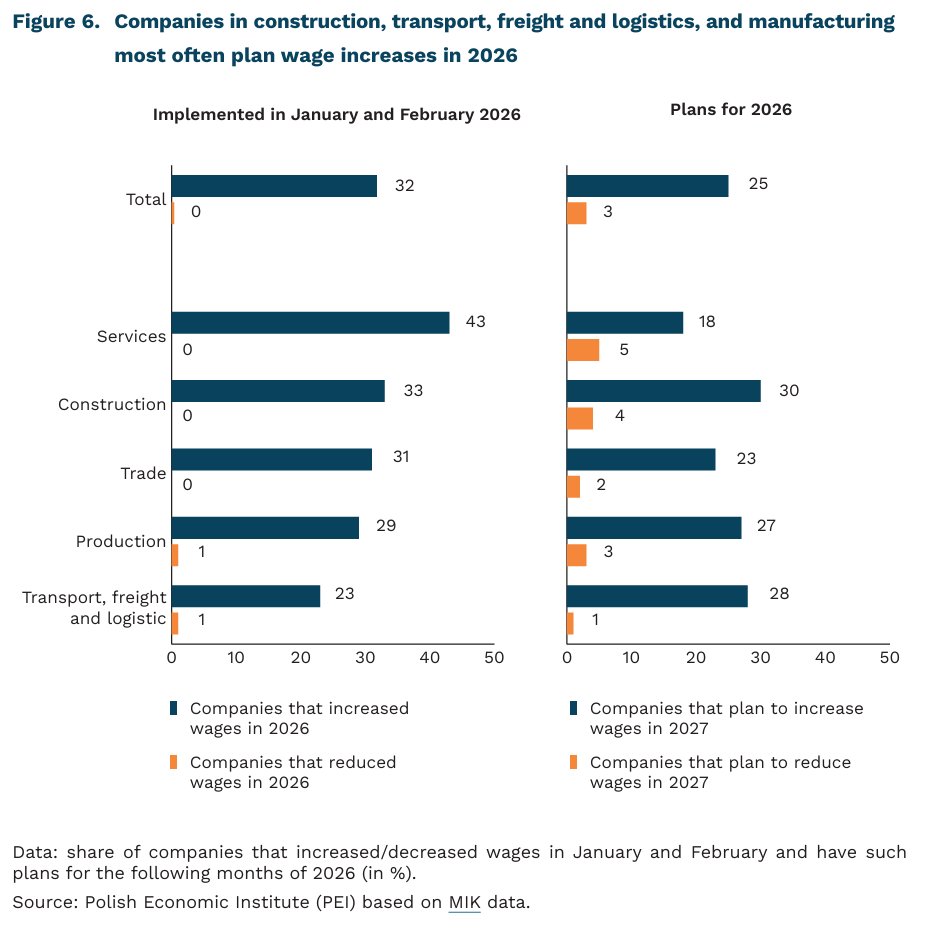
One in four companies plans to increase wages by the end of 2026
6.4% year-on-year increase in average wages in the enterprise sector was recorded in February 2026
32% of companies increased wages from January to February 2026
25% of enterprises plan to increase wages by the end of 2026
By the end of February 2026, nearly every third enterprise had increased wages, and 25% plan to do so by the end of the year – according to the March survey of the Monthly Business Climate Index (MIK). At the same time, plans to reduce wages were declared by 3% of the surveyed companies. In the survey conducted in 2024, the share of enterprises planning wage increases was 11 percentage points higher and amounted to as much as 36%. 25% of companies plan wage increases by the end of 2026 both among those that have already increased employee wages and those that have not. At the end of 2025, 34% of enterprises forecast wage increases in Q1 2026 – according to data from the NBP Quick Monitoring Survey. The planned wage increase by December 2026 may be around 5%.
Wage increases in the first months of 2026 were more often implemented by service companies (43%) and construction companies (33%). The lowest activity in this area was observed among companies in the TSL sector (23%). Plans to increase wages later this year were more common among construction companies (30%), while they were least frequent among service enterprises (18%). Among companies that have already increased employee wages, further increases were more often planned by entrepreneurs from the TSL sector (48%) and construction (36%). In turn, among enterprises that did not increase wages in the first months of 2026, plans for increases were declared primarily by manufacturing companies (34%) and construction companies (27%). In services, fewer than one in five companies plan to increase wages by the end of 2026, regardless of whether increases were granted at the beginning of the year or not.
In February 2026, a year-on-year increase of 6.4% in the average gross wage in the enterprise sector was recorded, reaching PLN 9,212.13 – according to data from Statistics Poland (GUS). In most PKD sections, the average wage was higher than in the previous year; only in mining was it lower by nearly 3%. Compared to 2021-2024, a slowdown in wage growth is observed – in that period, the annual increase ranged from 10% to 14%, while in 2025 it was 9%. The slowdown in wage growth results from declining inflation and budget discipline – according to a report by Hays Poland. Analysts from Hays Poland also indicate that the implementation of the EU directive on pay transparency will lead to greater caution in decisions regarding wage adjustments.
Aleksandra Wejt-Knyżewska
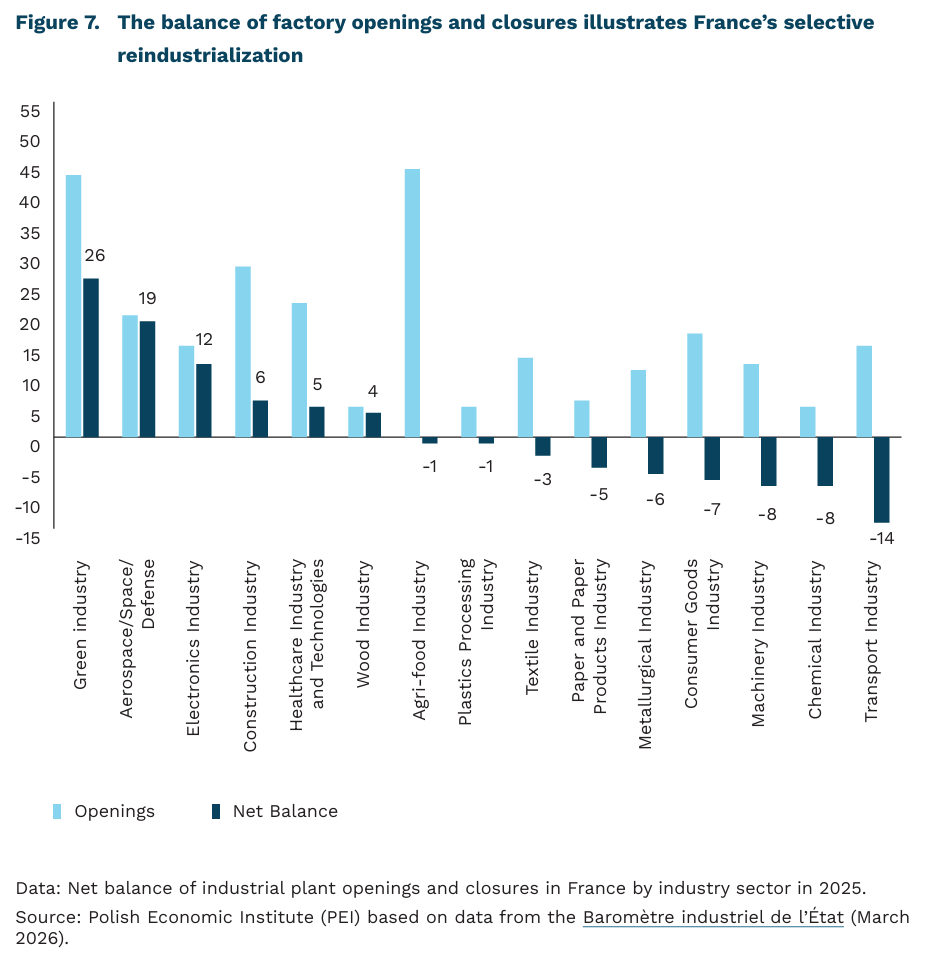
France continues to open factories, but reindustrialization is losing momentum
19 the net change in the number of industrial factories opened and closed in France in 2025
26 the net change in the number of industrial factory openings and closures in the green industry sector (i.e., encompassing technologies and value chains supporting the decarbonization of the economy and the circular economy) in France in 2025
44 the number of factories opened in France’s agri-food industry in 2025
In 2025, the number of new industrial plants in France exceeded the number of closures, resulting in a net increase of 19 nationwide. This applies to factories employing at least 20 people. The number of new factories also includes major expansions, while the number of closures includes reductions in operations. This is according to France’s State Industrial Barometer – a tool used to monitor the rebuilding of the country’s industrial capacity. However, these data should be interpreted within the broader context of France’s long-term deindustrialization. The manufacturing sector’s share of GDP fell from 16% in 1990 to 9.5% in 2025, with a low of 9.1% in 2021. Although a temporary rebound was recorded in 2022-2023, the share of industry in GDP declined again in the following two years, indicating the limited impact of reindustrialization efforts to date.
As recently as 2024, there were 88 more new and expanded factories than closed ones. In 2023, there were 189 more. This illustrates a visible slowdown in the pace of France’s reindustrialization. This slowdown is also reflected in publications by other institutions that monitor the opening and closing of industrial factories in a similar manner. According to the annual reports of the magazine L’Usine Nouvelle following the post-pandemic downturn in 2020, the industrial situation in France improved between 2021 and 2023; however, in 2024 and 2025, closures once again outnumbered new factory openings.
The highest net increase in industrial plant openings in 2025 was recorded in the green industry sector, aerospace and defense sectors, as well as in the electronics sector – 26, 19, and 12, respectively. The largest number of new factories (44) opened in the agri-food industry, but the net balance for this sector is negative due to an equally large number of factory closures (45). The largest negative net balance between the number of factories opened and closed was recorded in the transportation industry (including the automotive sector), the chemical industry, and the machinery industry, where the net figures were -14, -8, and -8, respectively. These data show that a large portion of newly established factories – about 30% – are in innovative sectors: green industries related to the decarbonization of the economy, as well as the aerospace, defense, and electronics industries. At the same time, sectors with a negative balance are primarily traditional industries, which, due to lower margins, higher energy intensity, and greater exposure to cost competition, are particularly vulnerable to the effects of rising energy prices, international pressure, and current geopolitical tensions.
Although the data presented above refer only to the number of industrial establishments, rather than employment levels or value added, such a comparison allows us to evaluate the density of the manufacturing base and the growth dynamics of industry and its individual sectors. The data presented in this way suggests that France is experiencing a selective reindustrialization, in which strategic and technologically advanced sectors play a particular role, rather than a reconstruction of the entire industrial sector. Although the French government appears to be effectively supporting new investments in selected industries, including through tax breaks for the green industry (C3IV) or the “First Factory” support instrument for innovative industrial projects under the France 2030 program, this does not change the fact that adverse trends are visible in some traditional sectors. A growing negative balance in certain industries, such as metallurgy, machinery, and chemical, could lead to a weakening of the national industrial base, increased dependence on imports, and the erosion of manufacturing capabilities in areas of fundamental importance to the economy. This shows that support for new investments does not eliminate the risk of a gradual weakening of core industries under pressure from global competition.
Filip Leśniewicz
Regulating physical availability is key to reducing alcohol consumption
1% increase in the density of alcohol retail outlets led to a 0.15% increase in per capita alcohol consumption in Canada
over 60% of studies on alcohol consumption and its geographic availability identify a positive relationship between outlet density and risky drinking, according to a 2024 meta-analysis
Although Poland has seen a downward trend in alcohol consumption in recent years, it remains relatively high compared to other developed countries and is above the EU average.
Price policy – particularly excise tax levels and their differentiation across types of alcoholic beverages – remains the primary regulatory tool in this area. While economic availability is often a key determinant of consumption, some consumers (and their purchasing decisions) are less sensitive to price, as buying alcohol is not always the result of rational calculation. Therefore, non-financial aspects of consumer decision architecture are becoming increasingly important in designing public policies aimed at reducing consumption.
Among these, physical availability is crucial – how easily, quickly, and conveniently a potential consumer can find a place to buy alcohol. The greater the availability, the higher the consumption. This is why more public authorities, including some Polish cities, are introducing restrictions – at least in terms of time (e.g., bans on nighttime alcohol sales). Empirical analyses show that such measures are effective in reducing alcohol consumption.
According to a meta-analysis of studies on the effectiveness of time restrictions in various countries, each additional day per week when alcohol can be purchased (in some countries sales are banned, for example, on Sundays) increases per capita consumption by about 3.4%. This relationship is also confirmed by studies analyzing shorter, hourly restrictions on alcohol sales.
Geographic availability also matters. One study examined alcohol consumption in the year following the relaxation of restrictions on outlet density in Philadelphia. Increased density resulted in both higher volume and frequency of alcohol consumption. Another study from a Canadian province identified a marginal effect: each additional 1% increase in outlet density raised per capita alcohol consumption by 0.15%. These findings are generalized and confirmed by a 2024 meta-analysis of several dozen studies. More than 53% of studies in this area show a positive relationship between geographic density of alcohol outlets and consumption, and 60.5% show a link between geographic availability and risky consumption (binge drinking, harmful behaviors resulting from excessive alcohol use).
Availability also has a more literal dimension, relating to how easy it is to find alcohol in a store. This includes product placement on shelves and displays, as well as the relative visibility of non-alcoholic alternatives. In a UK experiment using a simulated online alcohol store, purchasing decisions were strongly influenced by the proportion of non-alcoholic alternatives visible to participants – the greater the proportion, the fewer alcoholic products participants were willing to add to their cart. A similar study in a physical supermarket found that placing alcoholic products in more prominent locations – visible even without the intention to purchase or enter the alcohol aisle – significantly increased sales. The effects were comparable to price reductions of 4-9%, depending on the category (beer, wine, spirits). Regulating the display of alcohol in the most visible and accessible areas of stores, while increasing the visibility of non-alcoholic beverages, could help reduce impulsive alcohol purchases.
Łukasz Baszczak