
Economic Weekly 20/2026, May 22, 2026
Published: 22/05/2026
Table of contents
General secondary school opens the way to higher education rather than higher earnings for its graduates
35.5% of all upper-secondary school graduates in Poland in 2025 were graduates of general secondary schools for youth
83% of graduates of general secondary schools for youth continued their education at university in the second year after f inishing school
16% of graduates of general secondary schools for youth were working or combining work with study in the second year after f inishing school
In 2025, general secondary schools (licea ogólnokształcące, LO) [1] were completed by 161.2 thousand graduates, or 35.5% of all graduates from upper-secondary schools in Poland. Compared with 2020, the number of LO graduates increased by nearly 15 thousand, but their share in the total number of graduates fell slightly, by 2.3 percentage points. This reflects the structural changes described in PEI’s Economic Weekly, including the growing popularity of sectoral vocational schools [12/2026] and the importance of technical secondary schools as a path combining vocational preparation with further education [17/2026]. At the same time, the number of general secondary schools is increasing, mainly due to schools run by entities other than local government units. In 2015, there were 2,163 general secondary schools in Poland, excluding special schools, and by 2024 their number had risen to 2,351, an increase of nearly 9%.
Female graduates are clearly overrepresented in general secondary schools. Among 2023 graduates [2], women accounted for 64%, compared with 55% in the overall population of upper-secondary graduates. This makes LO one of the most feminised school types, surpassed in this respect only by post-secondary schools, where women accounted for 77%. In most other upper-secondary tracks, men predominate, including in technical schools (60%) and first-stage sectoral vocational schools (67%).
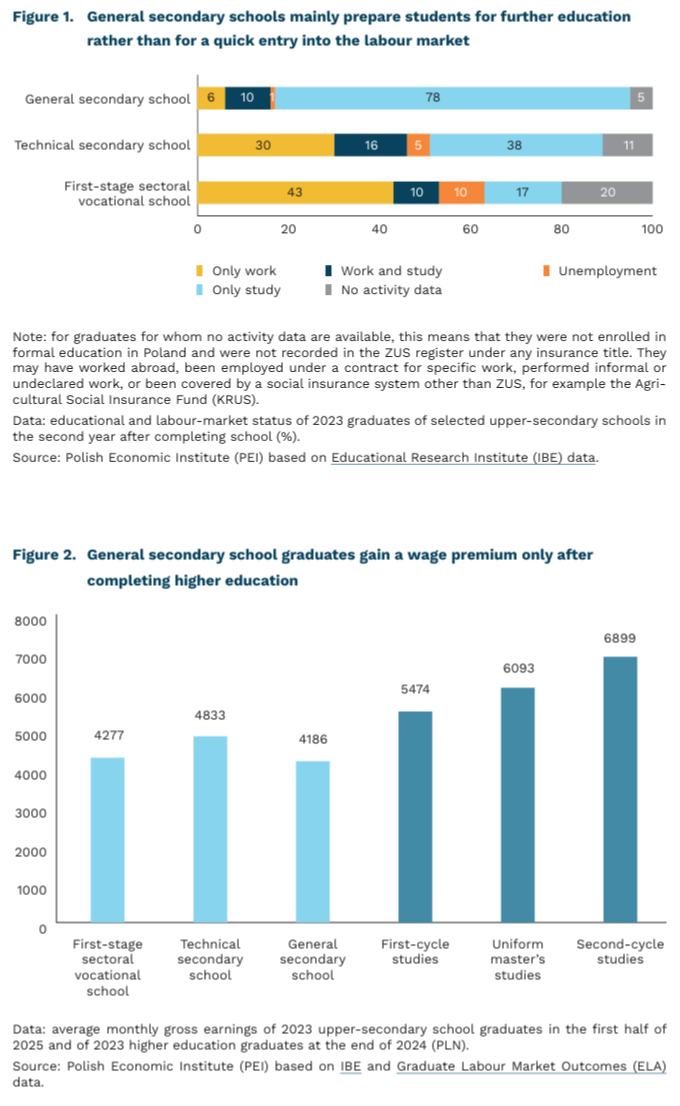
After completing general secondary school, most graduates continue their education at university. In December 2023, 76% of 2023 graduates were studying directly after school completion, while in December 2024 that share had risen to 83%. This clearly points to the dominance of the academic pathway, while also suggesting that some people begin their studies later, possibly due to a gap year, a second attempt at admissions, or a short period of work after the matura exam. The graduates in higher education most often chose fields in social sciences (43%), as well as medical and health sciences (19%) and engineering and technology (18%). Gender differences were very pronounced: women more often chose social sciences, medical and health fields, and humanities, while men more often chose engineering and technology.
The analysis of upper-secondary school graduates clearly shows three distinct educational and professional pathways that differ not only in their field of study, but also in the timing of labour-market entry and the pace at which wage gains appear. Among LO graduates, continuation of education clearly dominates, while labour-market activity is mainly supplementary. In March 2025, 88% of the 2023 cohort was studying3, including 10% combining study with work and only 6% working exclusively. Technical school and f irst-stage sectoral vocational school graduates enter the labour market earlier, and their income advantage appears sooner, especially in the case of technical school graduates, who combine vocational preparation with the possibility of further education. General secondary school primarily opens the door to university, but it does not yet guarantee a wage advantage over graduates of vocational tracks. Technical schools offer a faster start in working life while preserving flexibility, and sectoral vocational schools are increasingly becoming a genuinely chosen pathway to quick entry into the labour market.
- In this text, the term “general secondary school” refers only to schools for youth.
- For graduates of 2023, the latest data are available from the monitoring of career paths of graduates from public and non-public upper secondary schools (2025 edition). It is based on administrative data, including data from the Social Insurance Institution (ZUS) on graduates’ activity in the labour market.
- In addition to higher education, general secondary school graduates continued their education in post-secondary schools (7%) and in qualifying vocational courses (less than 0.5%).
Cezary Przybył
Further increase in imports from China and decline in exports to the United States in Q1 2026
2.2% increase in the value of Polish exports in EUR in Q1 2026
16% China’s share in Polish imports in Q1 2026
approx. 70% share of machinery, mechanical appliances and vehicles in trade between Poland and Mexico in Q1 2026
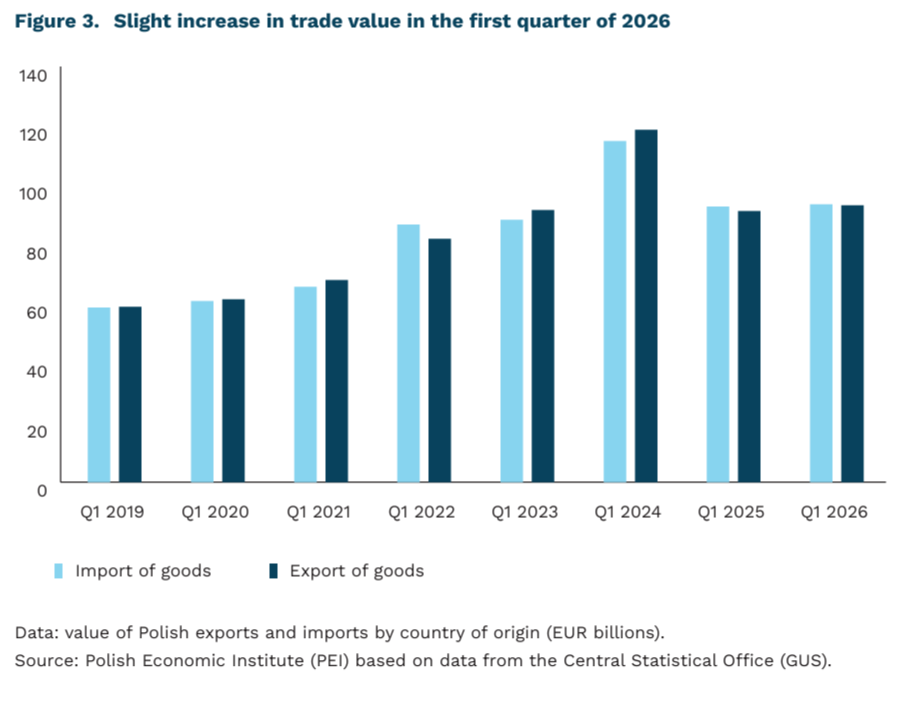
The impact of the US tariffs is visible in Poland’s trade results with the United States in Q1 2026. The value of exports in EUR fell by 11% compared with Q1 2025 and returned to the level recorded in 2024. This was the first year-on-year decline in the value of exports to the US in Q1 for several years. First three months of 2025 was marked by an excessive increase in imports related to stockpiling by companies in the US seeking to protect themselves against potential tariffs. As a result, export values have fluctuated more strongly than usual over the past two years. Interestingly, the depreciation of the US dollar led to the largest discrepancy between export dynamics expressed in EUR and USD since the pandemic. According to data expressed in USD, Polish exports remained unchanged.
In Q1 2026, the total value of Polish exports expressed in EUR increased by 2.2%. Exports rose most strongly to Ukraine, Czechia and the Netherlands. Import growth was slower, at slightly below 1%. As a result, the trade deficit persisted, although its value declined. The trade balance is usually weaker during periods of favourable economic conditions. Meanwhile, China’s share in Polish imports continued to follow an upward trend. In year-on-year terms, it increased by as much as 0.72 percentage points to almost 16%. Imports of cars rose particularly strongly, more than doubling and reaching 3% of imports from China. Increases of more than 50% were also recorded in imports of consumer electronics and batteries.
Amid growing protectionism in the Chinese and US markets, the modernised EU-Mexico agreement, which is due to be signed on 22 May this year, offers an opportunity to diversify trade directions. Mexico is the most important market for Polish products in Latin America. However, exports to Mexico accounted for only 0.3% of total Polish exports in Q1 2026 and declined by 30% year-on-year. Value-added flows show that Mexico itself accounts for more than 0.3% of value added generated in Poland, while it re-exports a further 0.15% of Polish value added.
Mexico will open its food market. In Q1 2026, machinery, mechanical appliances and vehicles accounted for more than 70% of trade between Poland and Mexico. By contrast, exports of food products represented 4% of total exports to Mexico and 0.01% of Poland’s total exports. EU supplies to Mexico are constrained by high tariffs, which reach up to 100% for some poultry products, 45% for eggs and selected pork products, and around 20% or more for selected processed products. The new agreement provides for the gradual elimination of these tariffs.
Katarzyna Sierocińska, Marek Wąsiński
Poles use GenSI at a lower rate than the EU average
22.68% of Poles used GenAI in 2025
57.81% of ICT specialists in Poland used GenAI for work-related tasks in 2025
37.12% of pupils and students in Poland used GenAI for educational tasks in 2025
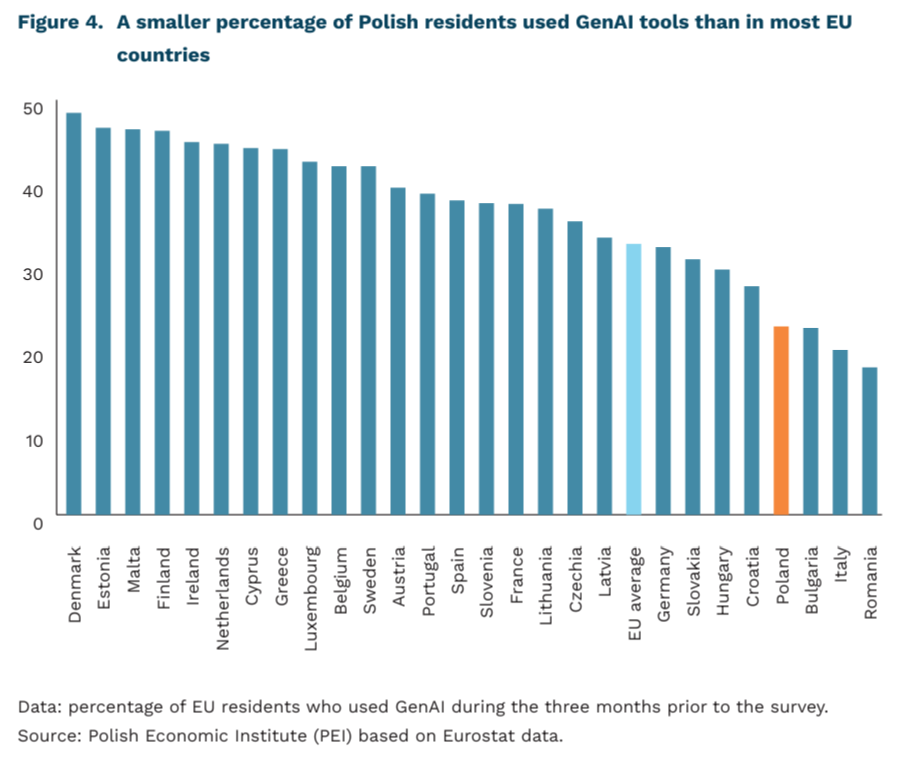
Poles use generative artificial intelligence (GenAI) less frequently than most Europeans, according to a new Eurostat study [4]. While 22.68% of Poles reported using GenAI over a three-month period, the European average was 32.66%. During the same period, the percentage in Denmark, one of Europe’s leaders in digitalization, was more than double that of Poland. The new statistics provide insight into the use of the rapidly developing GenSI technology from the perspective of individual users, rather than, as is usually the case, from the perspective of businesses.
The use of GenAI varies significantly according to demographic factors. On average, GenAI usage among people with a higher education was 23.27 percentage points higher than among those with a secondary education in Europe, and 28.19 percentage points higher in Poland. Similar patterns are evident in comparisons based on the size of the place of residence, showing that GenAI usage among inhabitants of cities in Europe was 15.45 percentage points higher than in rural areas, and Poland did not deviate from the European average in this respect.
At rather low by European standards – 19.75% – the use of GenAI for professional tasks by non-manual workers in Poland comes as no surprise (the EU average is 27.59%). The use of any type of artificial intelligence (AI) by companies in Poland stood at only 8.36% in 2025 and was one of the lowest in Europe. This situation is a result of the generally low level of digitalization in the Polish business sector, as we noted in our report titled “AI in Polish Companies”. In contrast, ICT specialists in Poland, due to the digital nature of their professions and the transformative impact of AI on their tasks, rank around the European average, with 57.81% of them using GenAI for professional tasks.
It is also worth looking at the adoption rate of GenAI among Polish secondary school pupils5 and university students – 37.12% of them used GenAI for formal education purposes (52.99% on average in the EU), placing them 24th in the EU. While GenAI tools are widely available in free versions, they may not be sufficient to meet the needs of high school students, university students or doctoral candidates. Subscriptions to paid versions of GenAI tools, which are relatively inexpensive by Western European standards, represent a significant expense for learners in the Polish context. At the same time, the low adoption of GenAI by learners should not be viewed as an unequivocally negative statistic – the unguided use of GenAI by students may have a negative impact on their educational outcomes. It is worth noting, however, that European leaders [6] in this field are actively working to promote the learning of methods for using and implementing dedicated AI-based educational tools in teaching processes.
Unlike many existing digital technologies, access to GenAI tools is not the main barrier to their use. A significant obstacle may be a lack of digital literacy – while getting started with GenAI is simple and seemingly intuitive, obtaining comprehensive results requires the ability to formulate a problem, iterate queries, and evaluate the quality of responses. It is worth noting that digital competencies in Poland are lower than the European average. Combined with limited external incentives from employers or the formal education system, individuals may not currently have sufficient motivation to actively learn how to use GenAI and explore its applications.
4. The question regarding the use of generative artificial intelligence by individuals was first asked by Eurostat in the 2025 EU Survey on the use of ICT in households and by individuals. The question will be included in future editions of the survey.
5. The study includes people aged 16 and older.
6. One example of a country actively implementing GenAI in education is France, which, starting in 2025, has introduced mandatory courses on the use of AI for elementary and secondary school students and supports the use of AI by teachers.
Jakub Witczak
Falling interest rates are driving mortgage refinancing
32,2% this was the share of refinancing in total mortgage loan sales in February 2026
almost twofold this was the increase in the share of refinancing compared with the period before the NBP started its interest rate-cutting cycle
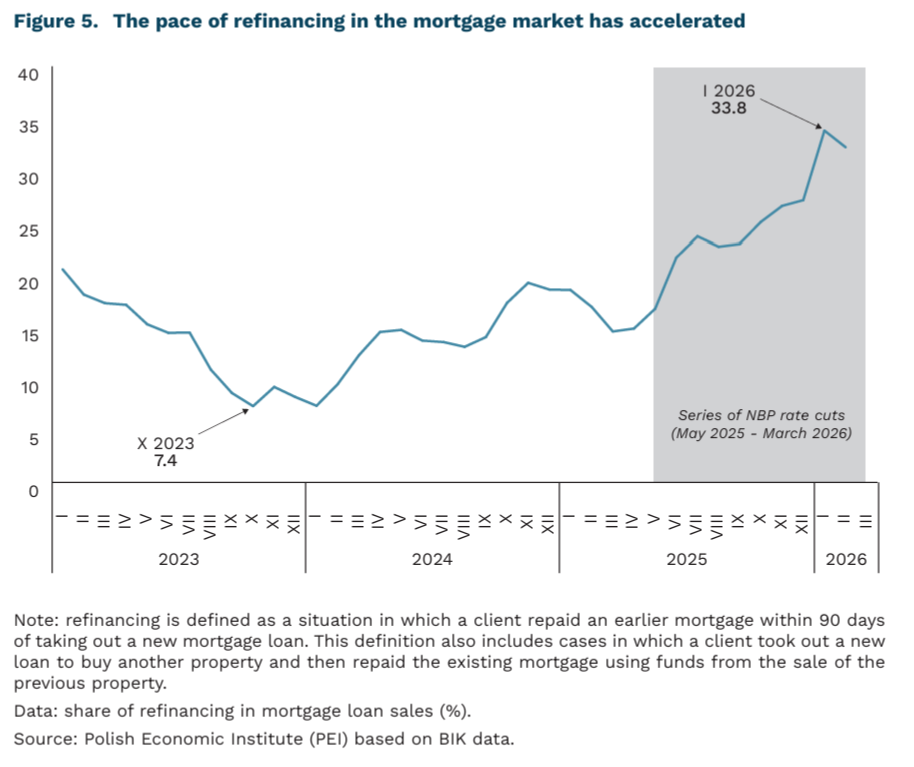
The interest rate-cutting cycle has doubled the share of refinancing in mortgage loan sales. According to BIK data provided to PIE, the share of refinancing in the number of newly granted mortgage loans rose from 16.9% in February 2025, before the rate-cutting cycle began, to 32.2% in February 2026. In January 2026, it reached a record level of 33.8%. Refinancing means taking out a new loan and using it to repay an earlier one, usually in another bank and on better terms. Each of the seven NBP interest rate cuts since May 2025, by a total of 200 basis points to 3.75%, made this option more attractive. Borrowers with periodically fixed-rate loans taken out at the peak of the tightening cycle could benefit from switching to a product with a lower rate. Borrowers with WIBOR-based loans could gain from a lower margin or by moving to a periodically fixed rate that protects them against possible future rate increases. In practice, every third newly granted mortgage loan now finances not the purchase of a property, but the repayment of an earlier mortgage.
The large scale of refinancing overstates the picture of actual demand for mortgage loans. In February 2026, banks granted 23.2 thousand mortgage loans, 52.8% more than a year earlier. After excluding refinancing, the actual number of loans granted for property purchases was around 15.7 thousand, 24.7% more than in February 2025. Demand is genuinely rising, but the increase is nearly half as large as suggested by nominal data. This may significantly change the assessment of the housing market cycle.
The March jump in mortgage loan enquiries points to this momentum continuing. According to BIK, the value of mortgage loan enquiries while the number of applicants reached 63.3 thousand, the highest reading since July 2008. Although the detailed structure of March sales is not yet available, a significant part of it was most likely driven by an acceleration of refinancing decisions amid concerns about interest rate increases following the commodity shock in the Middle East.
Assessing the mortgage loan market without taking refinancing into account can be significantly misleading, so this factor needs to be adjusted for. Monthly indicators of mortgage loan sales do not separate refinancing from loans used to purchase property. As a result, the public debate on the mortgage market relies on aggregate figures that combine two different processes: rising housing demand among households and the response of existing borrowers to changes in financing conditions.
The end of the rate-cutting cycle will most likely weaken the refinancing wave in the coming quarters. The NBP’s March cut to 3.75% was most likely the last one in this cycle, while derivatives markets are now pricing in increases in the cost of money from September 2026. In the short term, some borrowers may still bring refinancing decisions forward in order to lock in current rates, the lowest since 2022. Over the longer term, the share of refinancing in mortgage loan sales will probably stabilise or decline, gradually making monthly sales data a clearer indicator of actual housing demand. rose by 80.5% y/y in March 2026,
Sebastian Sajnóg
Solar and nuclear power in the land of oil and gas – the United Arab Emirates is striving for climate neutrality
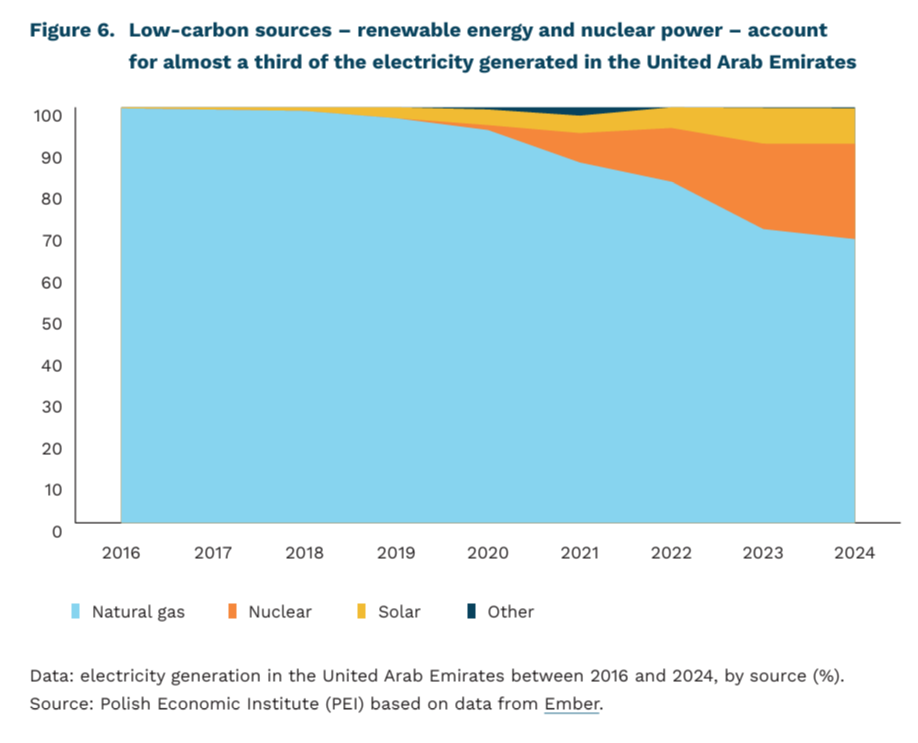
32% of the UAE’s electricity in 2024 was generated by low-carbon sources (renewables and nuclear power)
by 47% the UAE aims to reduce its greenhouse gas emissions by 2035 (compared to 2019)
3,86 GW of installed capacity has one of the world’s largest solar power plants, located in the UAE – the Mohammed bin Rashid Al Maktoum Solar Park; this is 19 times more than the largest such facility in Poland
An unexpected example of a country undergoing decarbonisation is the United Arab Emirates (UAE), a nation typically associated with oil and gas production. The Emirates have ambitions that extend beyond the fossil fuel market and – as the first country in the Middle East – have set themselves the goal of achieving climate neutrality by 2050. The country faces the major challenge of transforming the structure of its total energy production from all sources to meet the needs of the economy. According to data from the International Energy Agency for 2023, natural gas (60%) and crude oil (28%) accounted for the largest share [7].
The UAE’s progress is particularly evident in the way it generates electricity. According to Ember data, the four-unit [8] Barakah nuclear power plant located there generates 23% of the country’s electricity. However, the share of all low-carbon sources in electricity generation is higher, reaching 32% in 2024. Alongside the use of nuclear energy, this is the result of a decade of dynamic growth in photovoltaic power stations: the electricity generated by these stations has risen from 0.06 TWh in 2016 to 12.3 TWh in 2024. By way of comparison, Poland has exactly the same share of electricity generation from low-carbon sources, but it took longer to achieve this due to their more gradual development.
The UAE is home to one of the world’s largest solar power plants – the Mohammed bin Rashid Al Maktoum Solar Park, with an installed capacity of 3.86 GW. By building such facilities, the UAE aims to meet its target of reducing greenhouse gas emissions by 47% by 2035 (compared to 2019); however, according to analyses by independent institutions, its current emissions trajectory is inconsistent with this target. They emphasise that under current policies, the UAE’s emissions are likely to rise by 2030, whereas to achieve the targeted reduction in line with the net-zero pathway, they would need to fall by 53% by that time compared to current projections.
The UAE’s energy transition is intended to lead the country to the same end goal as that of developed nations – climate neutrality – but via a different route. The country does not appear to view rapid decarbonisation as an end in itself, but rather to be guided by pragmatism in its energy policy. Paradoxically, contrary to its net-zero target, the UAE plans to increase oil production from around 3.1 million barrels per day (b/d) [9] (2025 figure, according to OPEC data) to 5 million b/d by 2027. At the same time, revenues from oil sales, beyond meeting the economy’s current needs, are intended to finance the country’s energy transition. Although the country’s withdrawal from the OPEC+ group in May 2026 is not directly driven by decarbonisation ambitions, it confirms the UAE’s commitment to pursuing its own vision for the transformation of the energy system, one that is less dependent on external pressures (particularly from OPEC+ members).
7. In total for crude oil and petroleum products.
8. The power station comprises four APR1400 units based on Korean technology, each with a gross capacity of 1,417 MWe, which were commissioned in 2020, 2021, 2022 and 2024 respectively.
9. The US-Israel-Iran conflict led to a drop in production, which, according to OPEC data, stood at 2 million barrels per day in April 2026.
Wojciech Żelisko
Despite elevated uncertainty, Polish enterprises continue to plan over a multi-year horizon
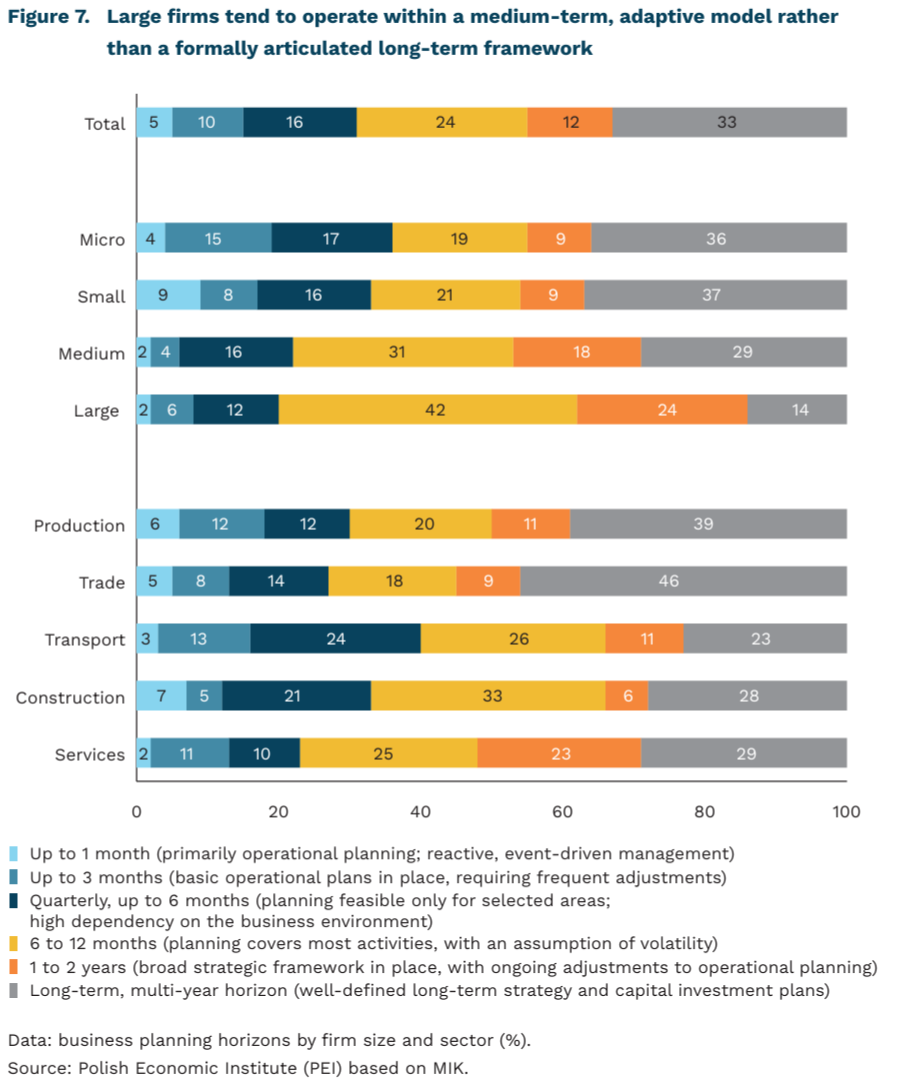
45% of firms in Poland report having a broad strategic framework or a planning horizon extending beyond one year
46% of trading companies report having multi-year corporate strategies and capital investment plans – the highest share among all sectors
37% of small enterprises report maintaining long-term strategic roadmaps and investment pipelines
Polish firms report planning beyond day-to-day operations, according to the latest MIK PIE. One-third of enterprises indicate multi-year planning horizons, including capital investment programs. A further 12% operate with a one- to two-year planning horizon, while nearly one-quarter plan 6 to 12 months ahead, reflecting a volatile business environment. By contrast, one in ten firms limits its planning horizon to three months or less, and 5% admit to operating in a purely reactive mode. Notably, a relatively large share of smaller f irms reports long-term strategic frameworks and investment pipelines – as many as 36% of microenterprises and 37% of small firms indicate multi-year planning horizons. Meanwhile, 42% of large companies acknowledge that, due to economic volatility, they operate on a 6-to-12-month horizon despite maintaining overarching strategic guidelines. It is important to note, however, that the strategies of large enterprises are inherently more complex and require more frequent recalibration than the development plans of smaller entities. The same applies to the scale and sophistication of their capital expenditure programs.
Planning horizons vary significantly across sectors, reflecting differing exposure to macroeconomic volatility. In trade and manufacturing, longer-term planning beyond the current business cycle is more prevalent: 46% and 39% of firms, respectively, report multi-year strategic frameworks. Overall, more than half of companies in these sectors operate with planning horizons of at least one year. By contrast, in transport and construction – sectors more closely tied to cyclical fluctuations – shorter planning horizons and greater operational flexibility play a more prominent role. This is particularly evident in the transport sector, where a high share of firms plan within a horizon of less than six months, underscoring the industry’s heightened sensitivity to demand volatility and changing market conditions.
In the current downturn, firms are increasingly prioritizing flexibility and resilience in their planning frameworks. The May reading of the MIK declined to 94.5 points (with a reading below 100 indicating that pessimism outweighs optimism), pointing to rising caution among businesses. At the same time, more than half of firms report having sufficient liquidity buffers to continue operating for more than three months, while a further 34% have cash reserves covering an additional two to three months. Throughout the MIK survey period (since 2021), roughly half of firms have maintained relatively solid liquidity positions despite recurring economic shocks. This has reduced pressure for immediate emergency responses or aggressive cost-cutting measures. At the same time, however, it has reinforced a more conservative stance and greater caution in forward planning and strategic decision-making.
Firms tend to maintain long-term strategic frameworks but roll them out in phases and remain cautious in higher-risk investment decisions. An increasingly prominent model combines a long-term strategic orientation with a shorter-term operational planning horizon, as reflected in firms’ reported planning structures. Companies are not abandoning growth strategies, but are adjusting their management approaches – strengthening cost discipline, phasing capital expenditure, and enhancing their capacity to absorb shocks. This points to a gradual shift away from planning based on assumptions of relative stability toward operating in an environment of persistent volatility, where flexibility and rapid responsiveness are as critical as strategy itself.
Katarzyna Zybertowicz
Most Poles do not engage in sports or recreational physical activity, yet they rate their physical fitness positively
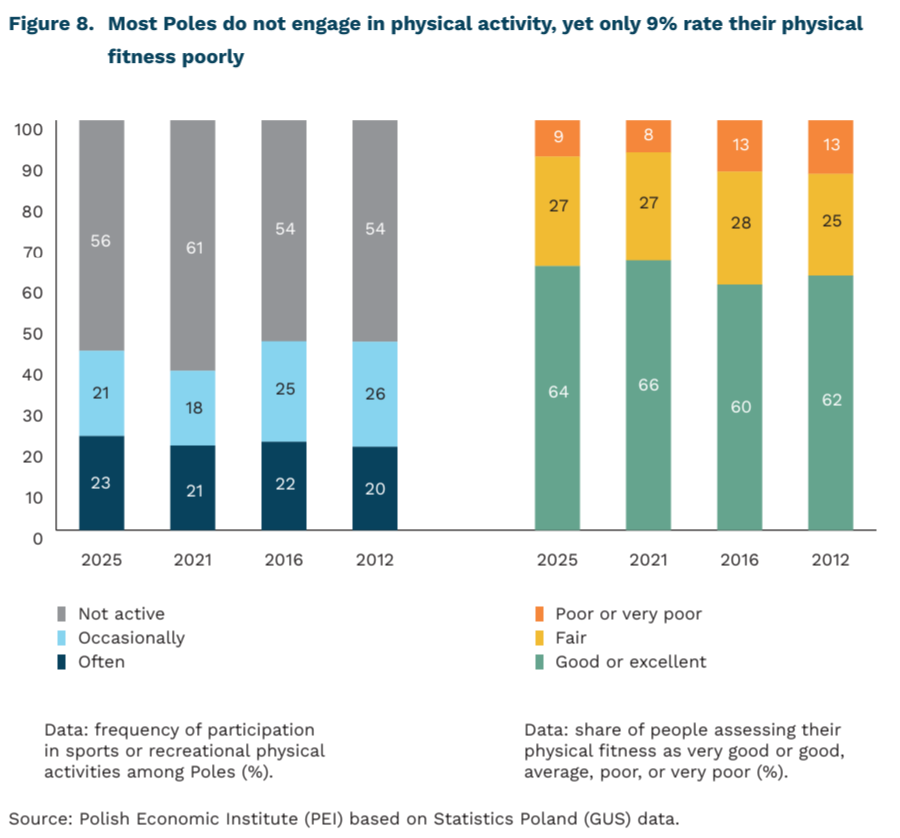
56% of Poles declared that they did not engage in any physical or recreational activity in 2025
64% of Poles rated their physical f itness as good or very good in 2025
22 percentage points separate people with higher education from those with basic vocational education in the share assessing their physical condition as good or very good
Physical activity levels among Poles have not changed significantly since 2008, although the latest Statistics Poland (GUS) data show the highest share of people frequently engaging in sports or recreational physical activity – 23% [10]. Still, more than half of Poles did not engage in any physical or recreational activity in 2025. In every surveyed period, cycling was the most popular form of sport, practiced by more than half of physically active respondents in every survey since 2008, followed by swimming. According to GUS, around one in four Poles cycled in 2025.
In 2025, 64% of Poles subjectively assessed their physical fitness as good or very good. Compared with surveys conducted in the previous decade, the share of respondents who rated their physical condition as poor or very poor decreased by around 5 percentage points.
According to the latest available data, education level was a major factor differentiating both the level of physical activity and the subjective assessment of physical fitness. In both 2021 and 2016, the share of physically active people with higher education was around 30 percentage points higher than among those with basic vocational education and around 15 percentage points higher than among those with secondary education. A similar pattern can be observed in the subjective assessment of physical fitness. In 2021, 73% of respondents with higher education assessed their physical condition as good or very good, compared with 64% among those with secondary or post-secondary education and only 51% among those with basic vocational education [11].
In 2025, one in three rural residents participated in sports or recreational physical activities. Among urban residents, the share was closer to 50%. However, this did not significantly affect Poles’ subjective assessment of their physical condition, which was at a very similar level among both rural and urban residents. Similar patterns were observed in the 2021 survey. Gender differences were also relatively small, although in each of the cited surveys men were slightly more physically active and assessed their physical condition more positively. As expected, physical activity among Poles also declines with age.
Regular physical activity and recreational exercise have a positive impact on health, including mental well-being (according to the WHO and other studies). It can therefore be concluded that physical activity helps maintain people’s productivity as workers. Conversely, insufficient physical activity generates economic costs related to absenteeism, illness, and lower well-being, among other factors, which may become increasingly important in the context of an ageing population.
In this context, particular attention should be paid to the relatively low level of physical activity among a large share of society. The belief held by most Poles that they are in good physical condition is likely an overly optimistic self-assessment, as it is subjective in nature and therefore more difficult to anchor in objective criteria within a survey setting than measures such as the frequency of participation in sports or recreational activities. Public policy should therefore address this insufficient level of physical activity in society and treat it as an issue requiring preventive action within the healthcare system.
10. Statistics Poland (GUS) conducted the survey Participation in Sports and Physical Recreation in the following years: 2025, 2021, 2016, 2012, and 2008. Due to changes in the wording of the questions, the 2008 survey is only partially comparable with the later editions.
Łukasz Baszczak
