Economic Weekly 25/2026, June 26, 2026
Published: 26/06/2026
Table of contents
Limited network capacity and rolling stock availability are holding back further growth in Poland’s passenger rail volumes
a 56.6% increase in the number of rail passengers in Poland was recorded in 2025 compared with 2015
every 3.5 minutes trains, ran on each track of Warsaw’s cross-city railway line
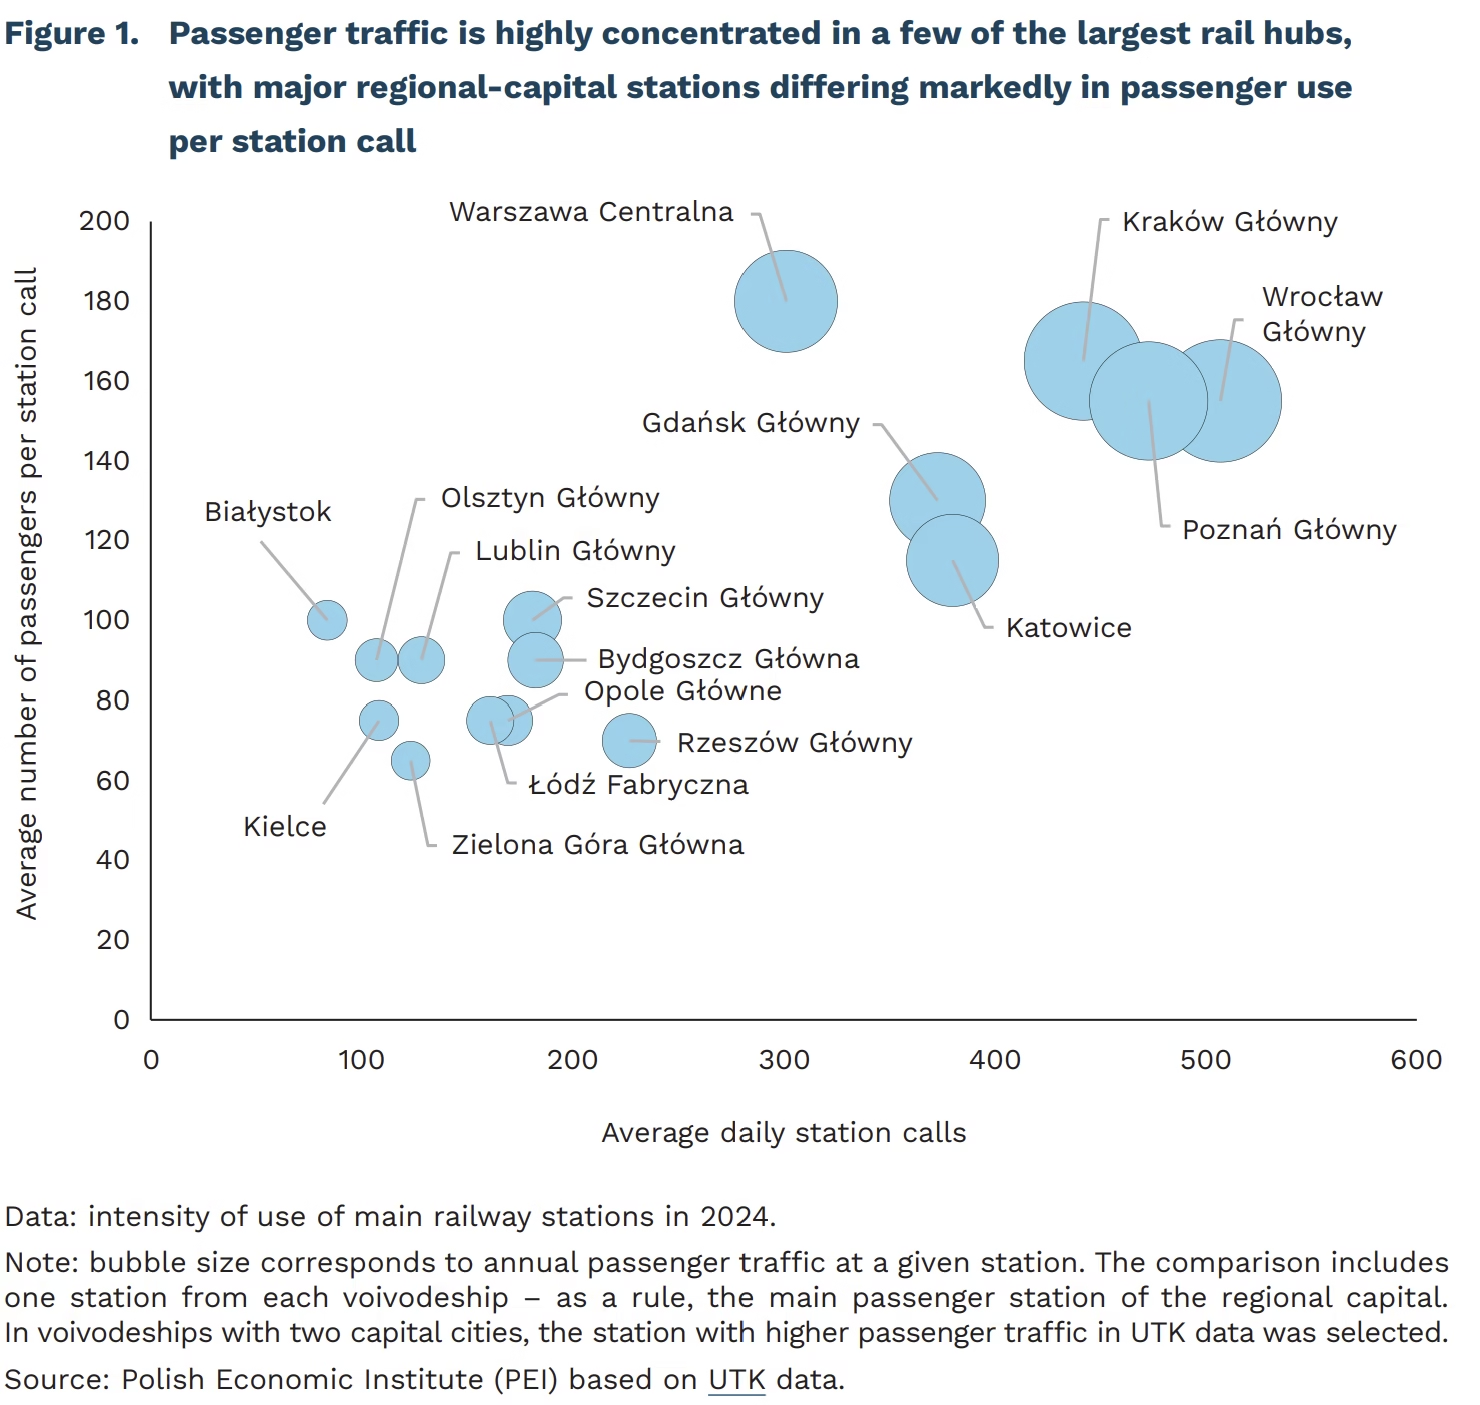
at 27 railway stations in Poland, annual passenger traffic exceeded 10 million in 2024
In 2025, 438.97 million passenger journeys were made by rail in Poland, 7.7% more year on year and more than 56.6% above the 2015 level. Over the same period, passenger-kilometers rose to almost 30.7 billion, up 7.8% year on year and 76% higher than in 2015. Rail use reached 11.7 journeys per capita, including long-distance, regional and suburban services, the highest level since 1995. The scale of this increase shows that passenger rail in Poland has entered a new phase of development. On the most popular routes between the largest cities, demand during peak travel periods is increasingly exceeding available capacity. The main constraint on further growth is the ability of the rail system to handle rising traffic – both in terms of infrastructure capacity, especially at key rail junctions, and rolling stock availability.
Capacity constraints primarily affect Poland’s largest rail hubs: Warsaw, Kraków, Wrocław, Poznań and the Gdańsk-Gdynia-Sopot area. These hubs include the most heavily used railway stations in the country. According to data from Poland’s Office of Rail Transport (UTK), in 2024 passenger traffic (defined as the number of passengers boarding or alighting at a given station) exceeded 20 million at: Wrocław Główny (28.8 million passengers), Kraków Główny and Poznań Główny (26.9 million passengers each), and Warszawa Centralna (20.04 million passengers). In these hubs, continued growth in metropolitan rail traffic overlaps with intensive interregional services. Both segments use the same infrastructure, gradually exhausting capacity on critical sections of the track network, such as the western approach to Wrocław Główny or Warsaw’s cross-city line, where at peak times trains run every 3.5 minutes on each track. In the Gdańsk-Sopot-Gdynia Tricity capacity constraints are compounded by heavy freight traffic serving the seaports, while in the Katowice rail junction they are exacerbated both by the complexity of the infrastructure and by ongoing reconstruction works. At 27 railway stations in Poland, annual passenger traffic exceeded 10 million in 2024.
Despite investment in the purchase and modernisation of locomotives, carriages and electric multiple units, rolling stock availability remains a second constraint. During the strong growth in passenger rail volumes observed in recent years, the number of electric multiple units and seated passenger carriages remained broadly stable. In practice, the constraint is not only the number of vehicles recorded in operators’ inventories, but the number actually available for service. In the long-distance segment, the number of carriages ready for operation has risen to around 1600 but, with demand continuing to grow, maintaining an adequate operational reserve remains crucial. This problem was particularly visible during periods of peak demand, when limited carriage reserves made it difficult to lengthen trainsets and quickly replace rolling stock taken out of service.
Further development of passenger rail will require greater capacity at key rail junctions while rolling stock reserves are strengthened. Without both, rising demand will increasingly result in crowded trains, difficulties in securing seats, less attractive timetables and greater vulnerability to service disruptions. Some improvements are already under way, but the key challenge is to ensure sufficient scale and pace, and to align infrastructure investment with expansion of the rolling stock fleet.
Krzysztof Krawiec
Poland’s price advantage over richer EU countries is shrinking
73.3% of the EU average was the level of consumer prices in Poland in 2025
less than 58% of the EU average was the level of consumer prices in Poland in 2015
a near doubling of gas and electricity prices in Poland over the past five years
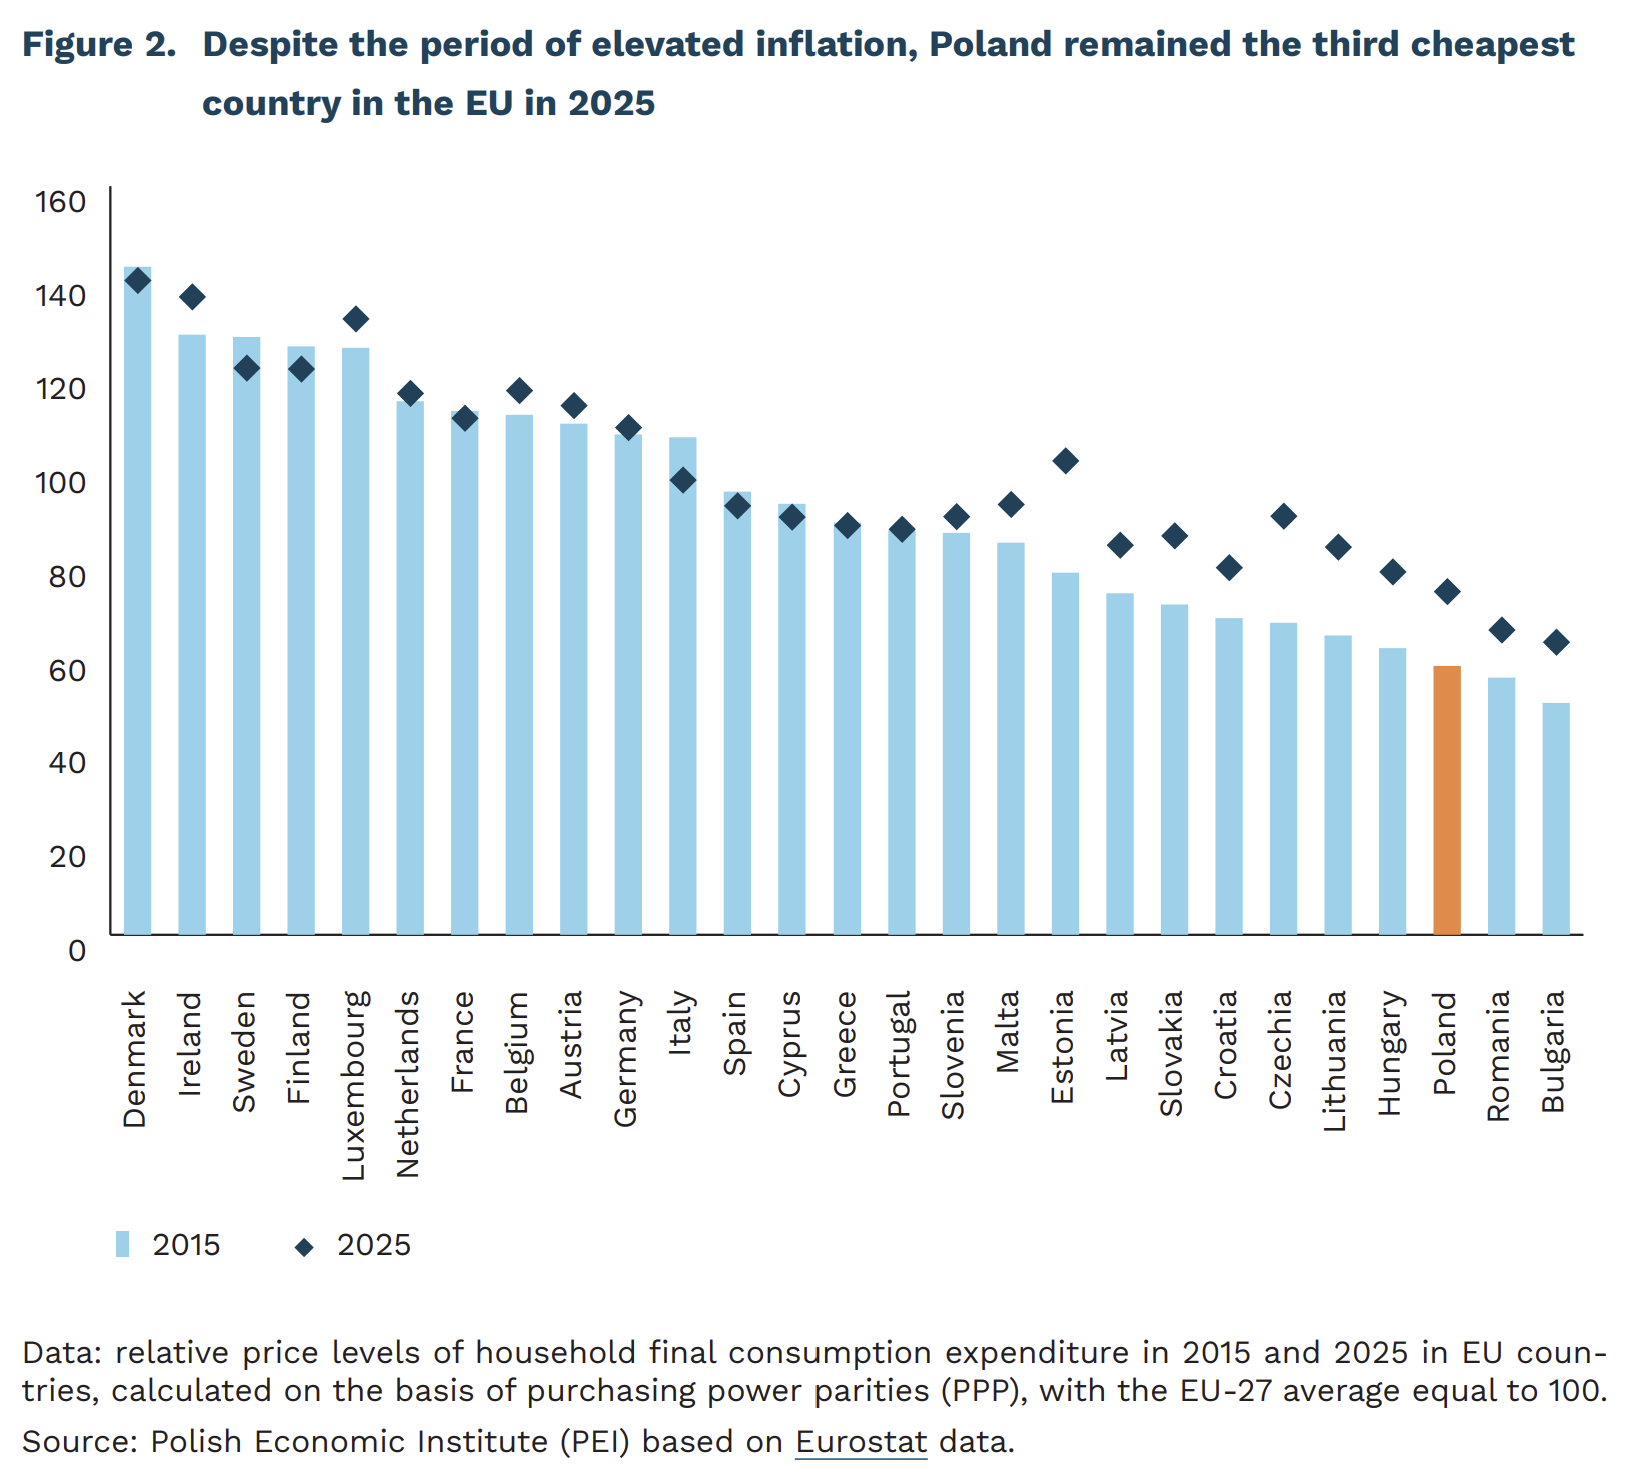
Poland is consistently closing the price gap separating it from EU countries. In 2015, the average price level of consumer goods in Poland stood at just under 58% of the EU average. In 2025, however, the average consumption basket already cost 73.3% of the EU average.1 The relative price level rose particularly dynamically in 2020-2025, when Poland, along with Estonia, was among the Central and Eastern European countries narrowing the price gap with Western Europe the fastest. The process was driven, on the one hand, by the stronger-than-in-Western-Europe impact of the energy shock, linked to the economy’s high energy intensity and the large weight of energy and food in the consumer basket. On the other hand, it was fuelled by significant wage growth, which raised labour costs and put upward pressure on prices, especially in the services sector.
Despite the recent episode of elevated inflation, Poland remained among the cheapest EU countries. In 2025, only Romania and Bulgaria had lower price levels than Poland, at 65.1% and 62.5% of the EU average, respectively. Meanwhile, the highest-price economies in the EU have remained unchanged since 2018: Denmark, Ireland, and Luxembourg, whose average price levels in 2025 exceeded 130% of the EU average. It is noteworthy that Poland’s lower prices compared with other Central and Eastern European economies are partly the result of a deep market effect, which fosters competition and drives down retail margins.
The acceleration of price convergence in Poland over the past five years has been driven mainly by spending categories that households cannot easily reduce: food, energy, and services. While gas and electricity prices rose by nearly twofold and hairdressing, dental, and home renovation/maintainance services became about 70% more expensive, prices of many industrial goods remained relatively stable. On the other hand, consumer services in Poland are still clearly cheaper than in Western Europe. In 2025, service prices hovered around 60% of the EU average, while prices of clothing, cars, and household appliances had almost already converged with the rest of the EU economies.
In the long run, Poland’s catching up with Western European price levels is a consequence of participation in the single market and ongoing real convergence. Structural factors such as the absence of trade barriers, the free movement of goods, people, services, and capital, and the gradual harmonisation of regulations all support the disappearance of price dispersion within the EU. In addition, in economies at a lower level of development, according to the Balassa-Samuelson effect, faster productivity growth in the export sector also creates wage pressure in non-tradable services, which leads to higher prices in this part of the economy. As a result, as Poland catches up with richer countries in terms of income and productivity, it also naturally moves closer to their price levels.
1 The calculations were based on the Price Level Index (PLI), which measures how expensive a given country is relative to the EU average. The index is calculated as the ratio of Purchasing Power Parity (PPP) to the current exchange rate, with the EU average set at 100.
Hubert Pliszka
EU Budget for 2028-2034: Between Austerity, Cohesion and Competitiveness
EUR 1.73 trillion proposed EU budget for 2028-2034 under the Cypriot proposal
3.9% lower Cypriot proposal for “Clean transition & industrial decarbonization” compared with the European Commission’s proposal
EUR 22.3 billion budget for “Clean transition & industrial decarbonization” under the European Competitiveness Fund proposed by the Cyprus Presidency
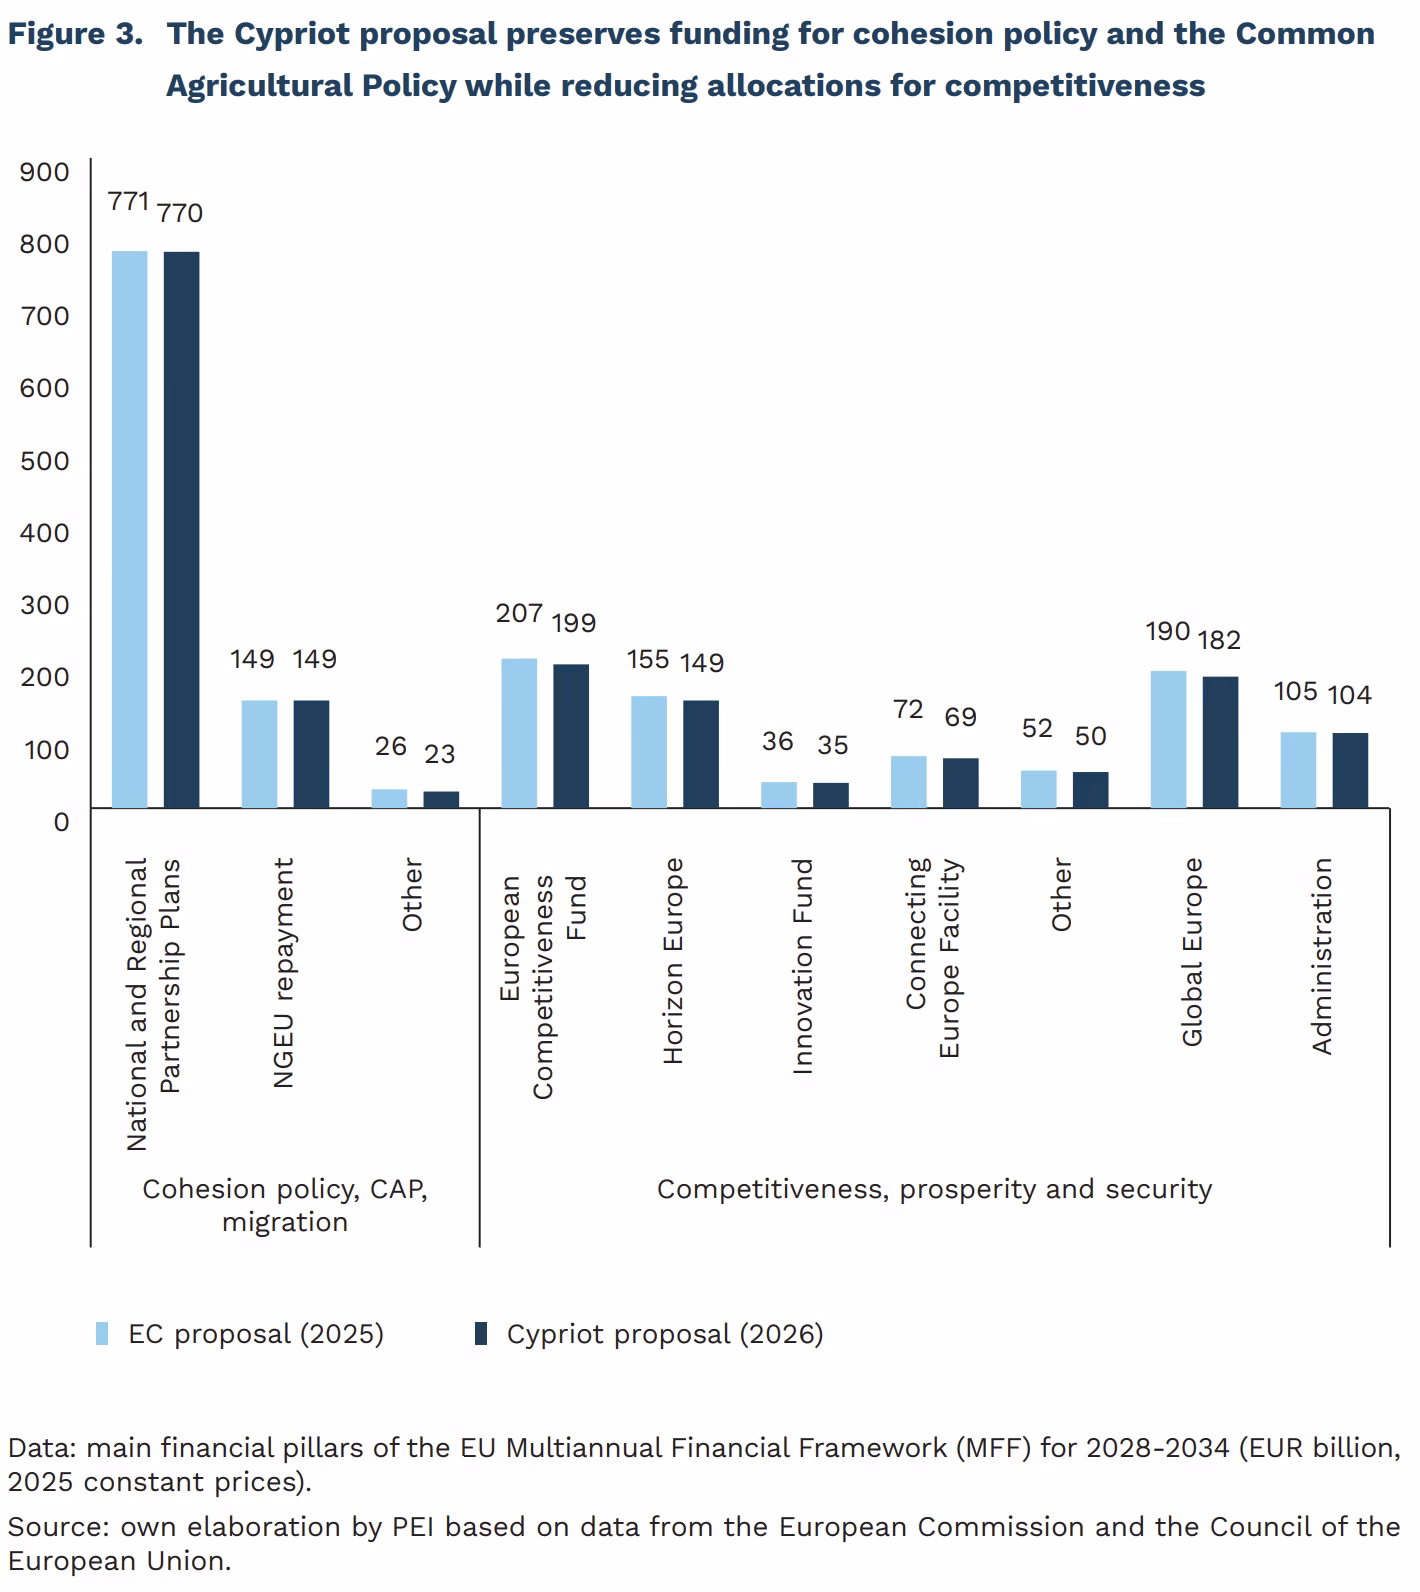
Cyprus, holding the Presidency of the Council of the European Union (EU) in the first half of 2026, has proposed reducing the EU budget for 2028-2034 by only 2%, from EUR 1.76 trillion to approximately EUR 1.73 trillion, while protecting “traditional” spending priorities. Under the European Commission’s (EC) original proposal, the share of expenditure devoted to cohesion policy, the Common Agricultural Policy (CAP), and migration was set to decline from 62% in the 2021-2027 budget to 43% in the next Multiannual Financial Framework (MFF). However, the EU’s net contributors called for a smaller overall EU budget. In response, the Cypriot Presidency proposed moderate cuts to the MFF, distributed unevenly across spending categories. The reductions primarily affect programs managed centrally by the European Commission, including the European Competitiveness Fund (ECF) – the new flagship instrument of the EU budget, which is intended to be centrally administered by the Commission. Cyprus proposed reducing centrally managed funds from EUR 522 billion to EUR 502 billion. By contrast, funding for cohesion policy and agriculture would fall only marginally, from EUR 946 billion to EUR 942 billion. Excluding repayments under the NextGenerationEU (NGEU) program, this would increase the share of this budget pillar to just under 45% of the total MFF.
The Cypriot Presidency proposed an ECF budget of EUR 199 billion, representing a 3.9% reduction compared with the Commission’s proposal. Consequently, funding for clean technologies – one of the ECF’s four priority areas, alongside digital technologies, defense, and biotechnology – would decrease to EUR 22.3 billion. Regardless of the final agreement on the budget, the ECF will constitute the largest ever EU fund dedicated to clean technologies. It will also operate in conjunction with Horizon Europe, the EU’s research & innovation program, whose proposed budget amounts to approximately EUR 150 billion.
The European Council has reached agreement on the main design elements of the ECF, although financial allocations remain part of the broader MFF negotiations. In its partial negotiating position, the European Council advocated strengthening Member States’ oversight of the Fund, thereby limiting the degree of centralization originally proposed by the Commission. Member States also clarified how the ECF should be coordinated with other EU programs, particularly Horizon Europe and InvestEU, to ensure greater coherence in support for strategic projects.
In April, the European Parliament (EP) adopted its negotiating position, calling for a more ambitious MFF, including a budget 10% larger than proposed by the Commission and the treatment of EU debt servicing outside the MFF expenditure ceilings. The Parliament supports stronger funding for competitiveness, defense, and security, provided that separate and sufficient resources are maintained for cohesion policy and the Common Agricultural Policy, while ensuring a meaningful role for regions and local authorities in implementation.
The Cypriot proposal reduces the overall EU budget only symbolically while seeking to preserve the relative importance of cohesion policy and the Common Agricultural Policy within the MFF. Further negotiations among Member States are expected to focus on adjusting this balance. The so-called “frugal” countries, including Germany, the Netherlands, and Sweden, favor significantly deeper spending cuts, while seeking to protect competitiveness-related expenditure to a greater extent. By contrast, the “Friends of Cohesion” group, represented notably by several Central European Member States, is likely to oppose such an approach. Negotiations will also address the European Commission’s proposal to introduce greater flexibility into budget management, including the creation of a reserve and broader possibilities for reallocating funds across expenditure headings. The MFF requires unanimous approval by Member States, followed by the consent of the European Parliament. Reaching a compromise by the end of 2026 may prove challenging, while prolonging negotiations into 2027 would increase the risk of failing to adopt the budget, as several major EU Member States are scheduled to hold national elections next year.
Marianna Sobkiewicz, Jan Strzelecki, Marek Wąsiński
Polish society has permanently entered a phase of demographic imbalance
in 2043 according to UN projections – half of Poles will be at least 50 years old
since 2021 deaths more than births have been slowing the rise in the average age of Poles
since 1991 Poland has experienced demographic imbalance (the number of expected births exceeds the actual number of births)
Forecasting demographic trends is an exceptionally difficult task. As shown by previous analyses, Poland’s actual population decline is proceeding faster than the 2023 projection by Central Statistical Office anticipated. Demographic analyses and forecasts nevertheless remain an important tool for planning infrastructure, the pension system and public services. This article proposes two new approaches: the first decomposes the impact of births and deaths on the average age of the population, while the second assesses the demographic balance of society.
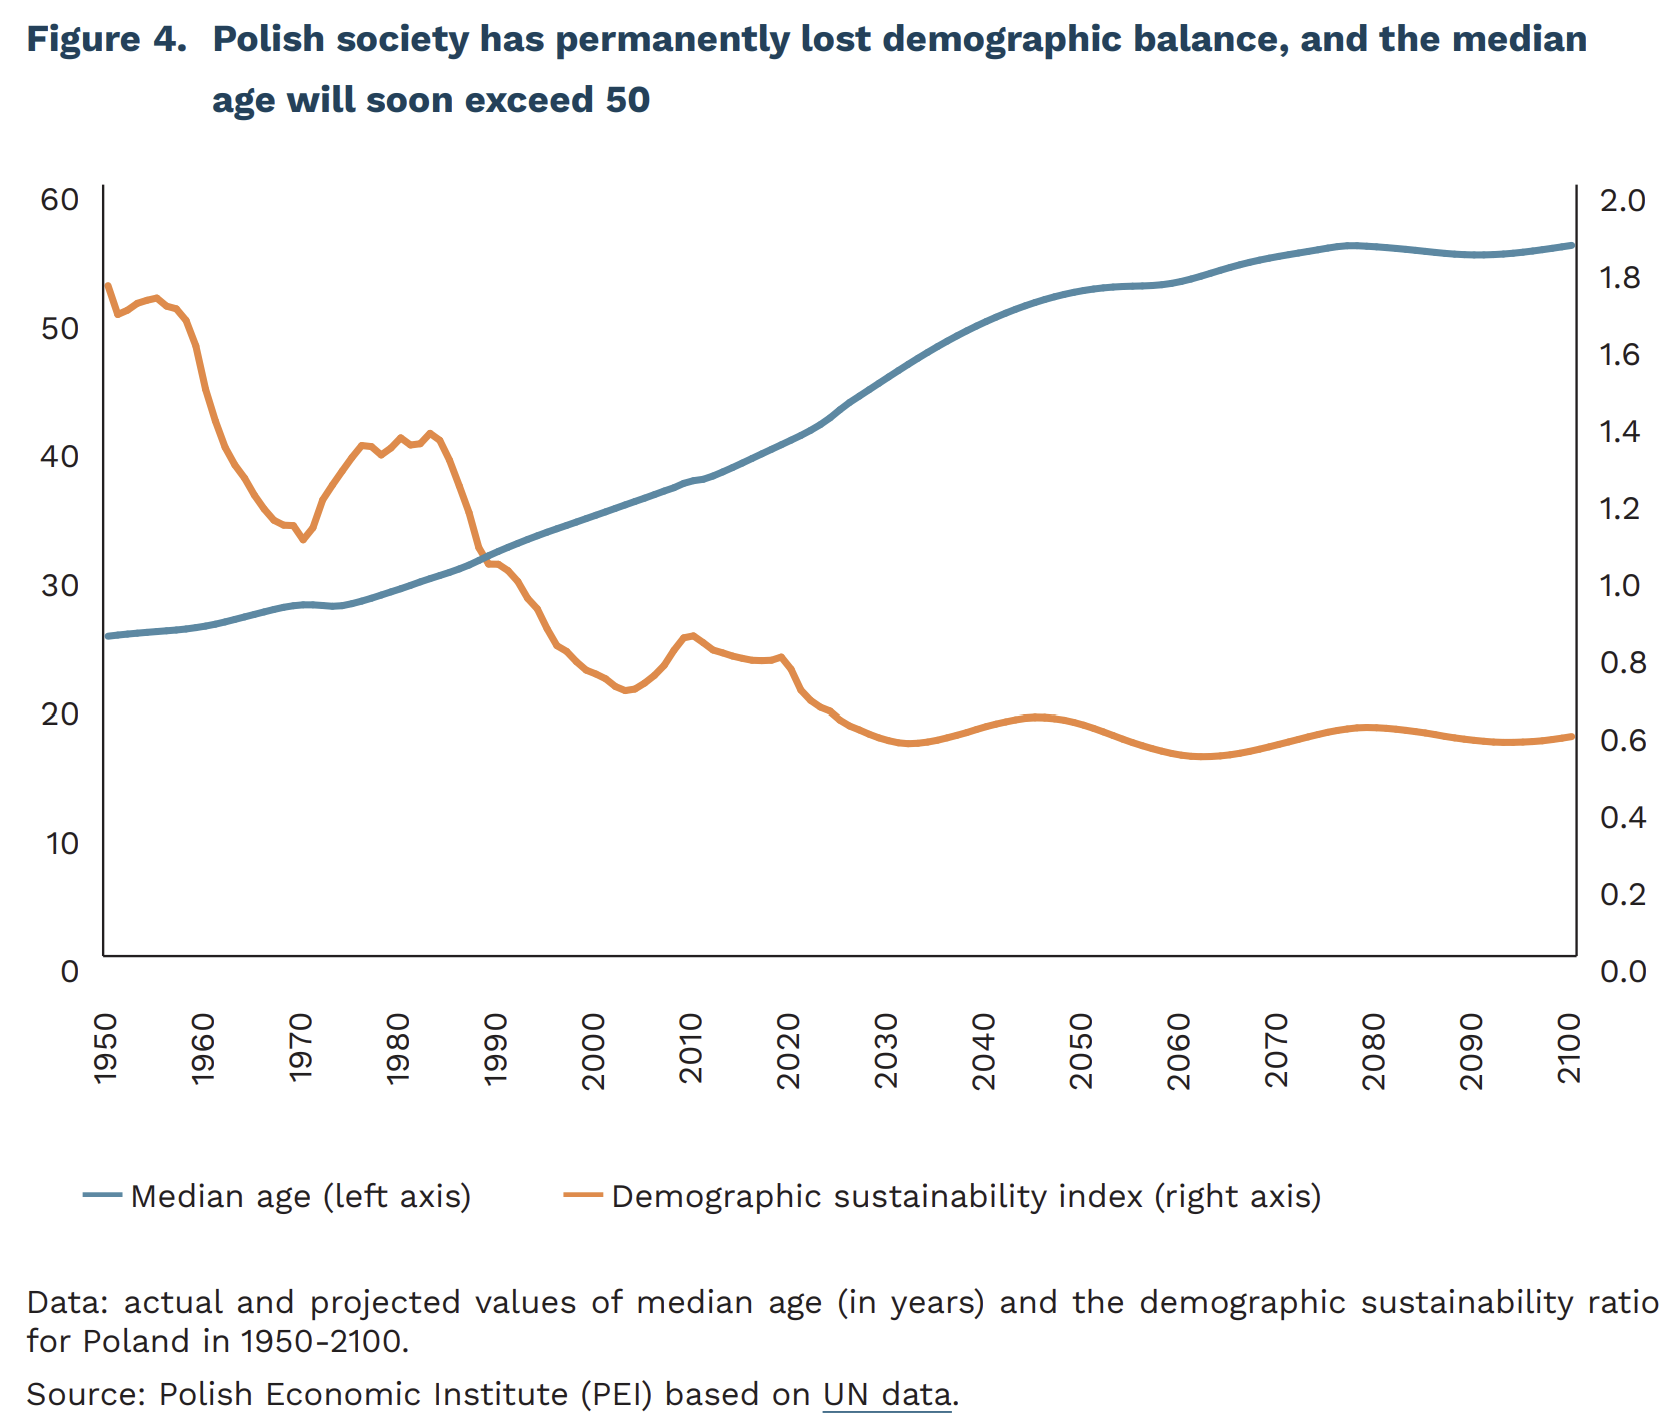
Polish society is among the fastest-ageing in the world. According to the 2024 UN projections, already in 2043 half of the population will be at least 50 years old.2 If the world’s largest economies3 are taken into account, Poland will be among the five countries with the highest median age in 2043, alongside South Korea, Japan, Italy and Spain.
The population is ageing because the number of births is falling, while the number of deaths at older ages is not rising enough as people live longer. The decomposition of this process leads to the paradoxical conclusion that, in Poland today, it is deaths rather than births that contribute more to slowing the increase in the population’s average age. In 1950-2020, births slowed population ageing more strongly than deaths. The turning point came in 2021. Since then – contrary to intuition – demographic “rejuvenation” no longer stems from births, but from the fact that ever older cohorts are dying.
To assess the actual demographic condition of societies, researchers have proposed a new measure – the demographic sustainability ratio. It is calculated as the ratio of the number of observed births to the number of births needed4 to keep population size constant. A value above 1 indicates a birth surplus, 1 indicates balance, and below 1 indicates demographic imbalance and pressure for population decline. It is a better measure for assessing demographic processes than the popular TFR indicator, because it shows not only fertility, but also whether the number of births is sufficient to maintain the population given its age structure.5
The Polish case shows how quickly the sustainability ratio can move from a birth surplus to lasting imbalance. In the mid-20th century, the ratio stood at around 1.7. From the 1960s to the 1980s, it fluctuated around 1.1-1.3. In 1991, it fell below 1, and from that point on the number of births has never again been enough to fully “replace” the population at the observed level of mortality. The latest UN projections suggest that after 2030 the ratio will stabilise at around 0.6. This means that the number of births will be roughly 40% lower than what is needed to keep population size constant.
The combination of demographic imbalance and rapid growth in the median age is not a short-term deviation, but a new demographic normal to which the labour market, social policy and public finances must adapt. It implies a permanent change in the conditions under which the state operates: fewer people of working age, greater pressure on the pension, healthcare and care systems, and a greater role for migration as a tool to ease labour shortages. At the same time, the current decade is the last window for systemic reforms – without prompt action, demographic trends will narrow the scope for public policy for generations to come. The faster the state adapts its institutions to the new demographic structure, the greater the chance that population ageing will become a managed process rather than a crisis forced by inaction.
2 Only in six European countries will the median age then be higher – Greece, Bosnia and Herzegovina, Spain, Andorra, San Marino and Italy. Worldwide, only in 17 countries (out of 236) will the median age be higher.
3 By nominal GDP above USD 1 trillion.
4 The number of needed births is the quotient of population size and life expectancy.
5 TFR can suggest a similar situation in two countries even if their demographic structures are completely different, because one country may have a younger population and the other an older one. The demographic sustainability ratio takes this broader perspective into account. It shows whether the number of births corresponds to what is required to maintain population size at a given level of mortality and age structure.
Cezary Przybył
Medium-sized companies are best at adapting to market changes
0.6% of Polish enterprises are medium-sized companies
17% of persons employed in the enterprise sector work in medium-sized companies
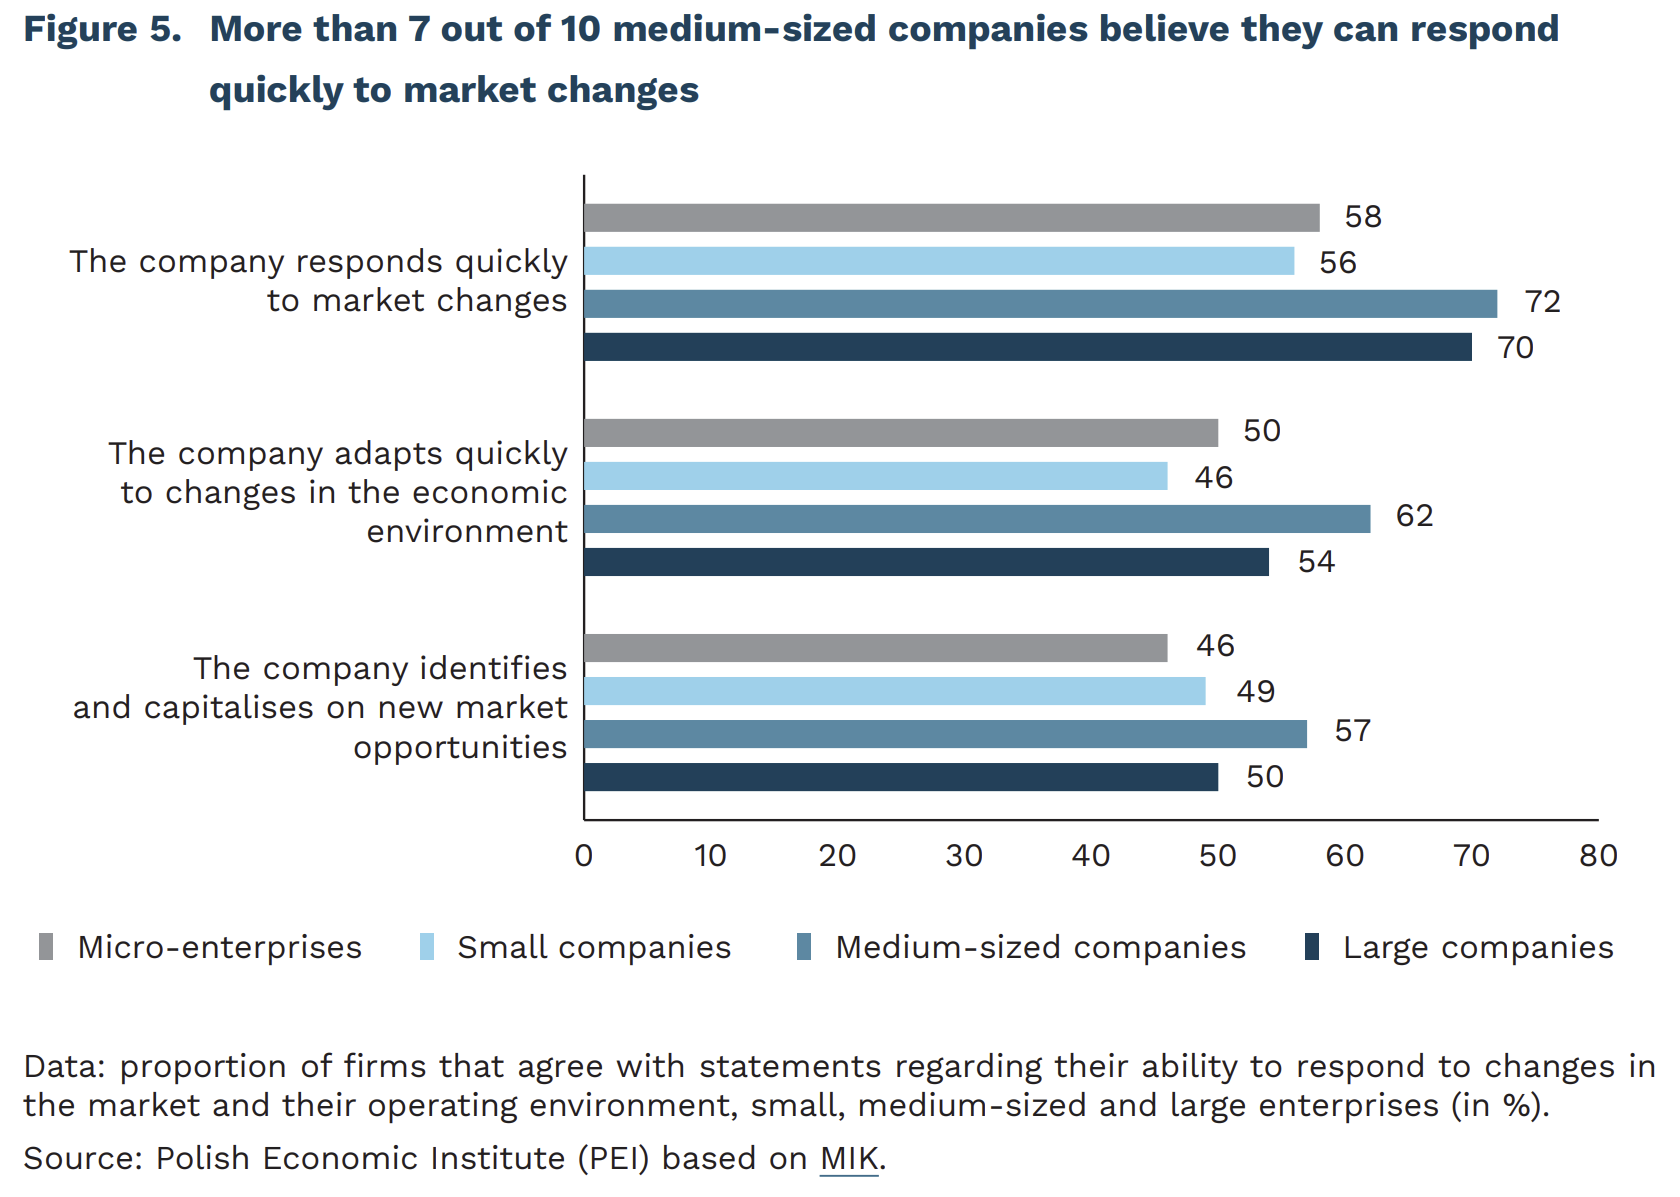
72% of medium-sized enterprises declare that they respond quickly to market changes
According to Eurostat data for 2024, there are almost 16,000 medium-sized enterprises operating in Poland, employing almost 1.6 million persons. This means they account for 0.6% of Polish companies and employ nearly 17% of persons working in the enterprise sector. At the same time, in 2023, medium-sized enterprises accounted for 10.3% of Poland’s GDP.
Medium-sized companies adapt to market changes better than large enterprises – this follows from research conducted for MIK (Monthly Business Climate Index) in June 2026. As many as 72% of companies employing between 50 and 249 persons declare that they respond quickly to market changes, compared with 70% of large enterprises giving the same answer (alongside 58% of micro-enterprises and 56% of small enterprises). Furthermore, medium-sized enterprises most frequently indicate that they are able to adapt quickly to changes in the economic environment. Entrepreneurs running medium-sized companies more often than others assess that they can identify and exploit new market opportunities (medium-sized: 57%, large: 50%, small: 49%, micro: 46%). At the same time, in the June MIK survey, medium-sized enterprises least frequently of all cite uncertainty in the economic situation as a barrier to their operations (46%, compared with 58% among micro-enterprises, 63% among small enterprises, and 64% among large enterprises).
In June, the MIK value for medium-sized companies stands at 102.8 points, indicating a prevailing positive sentiment over negative. The MIK for medium-sized enterprises in June, as for most of the period covered by the MIK survey, is lower than for large companies but markedly higher than for small and micro enterprises. Positive sentiment has prevailed over negative in medium-sized enterprises for most of the past twelve months. The positive sentiment in medium-sized companies stems primarily from the fact that they more frequently experienced growth rather than decline in sales value and the number of new orders. At the same time, medium-sized companies report an improvement in sales more often than other enterprises (24% vs. 20% among micro-enterprises and 16% each among small and large enterprises). Furthermore, more medium-sized firms intend to hire rather than make redundancies (11% vs. 4%), and almost 1 in 10 plans to raise wages over the next three months. More than half of medium-sized enterprises also declare having sufficient financial resources to operate for more than three months.
Medium-sized companies combine features of both neighbouring categories (small and large enterprises), but have their own specific features. Although they account for a small share of all enterprises, they play an important role as employers, offering stable jobs. Unlike the smallest entities, which are more vulnerable to economic fluctuations, medium-sized companies possess an organisational structure and reserves that allow them to weather more difficult periods. They are more innovative and technologically advanced than small enterprises, though they lag significantly behind the largest enterprises in this respect. They are also less likely than large firms to engage in investment activity. At the same time, the slightly smaller scale of their operations allows them greater operational flexibility than the largest companies.
Anna Szymańska
Poles want a digital country, as long as it is transparent and secure
84% of respondents from Poland said that the digitization of everyday public and private services offers the opportunity for a more convenient life
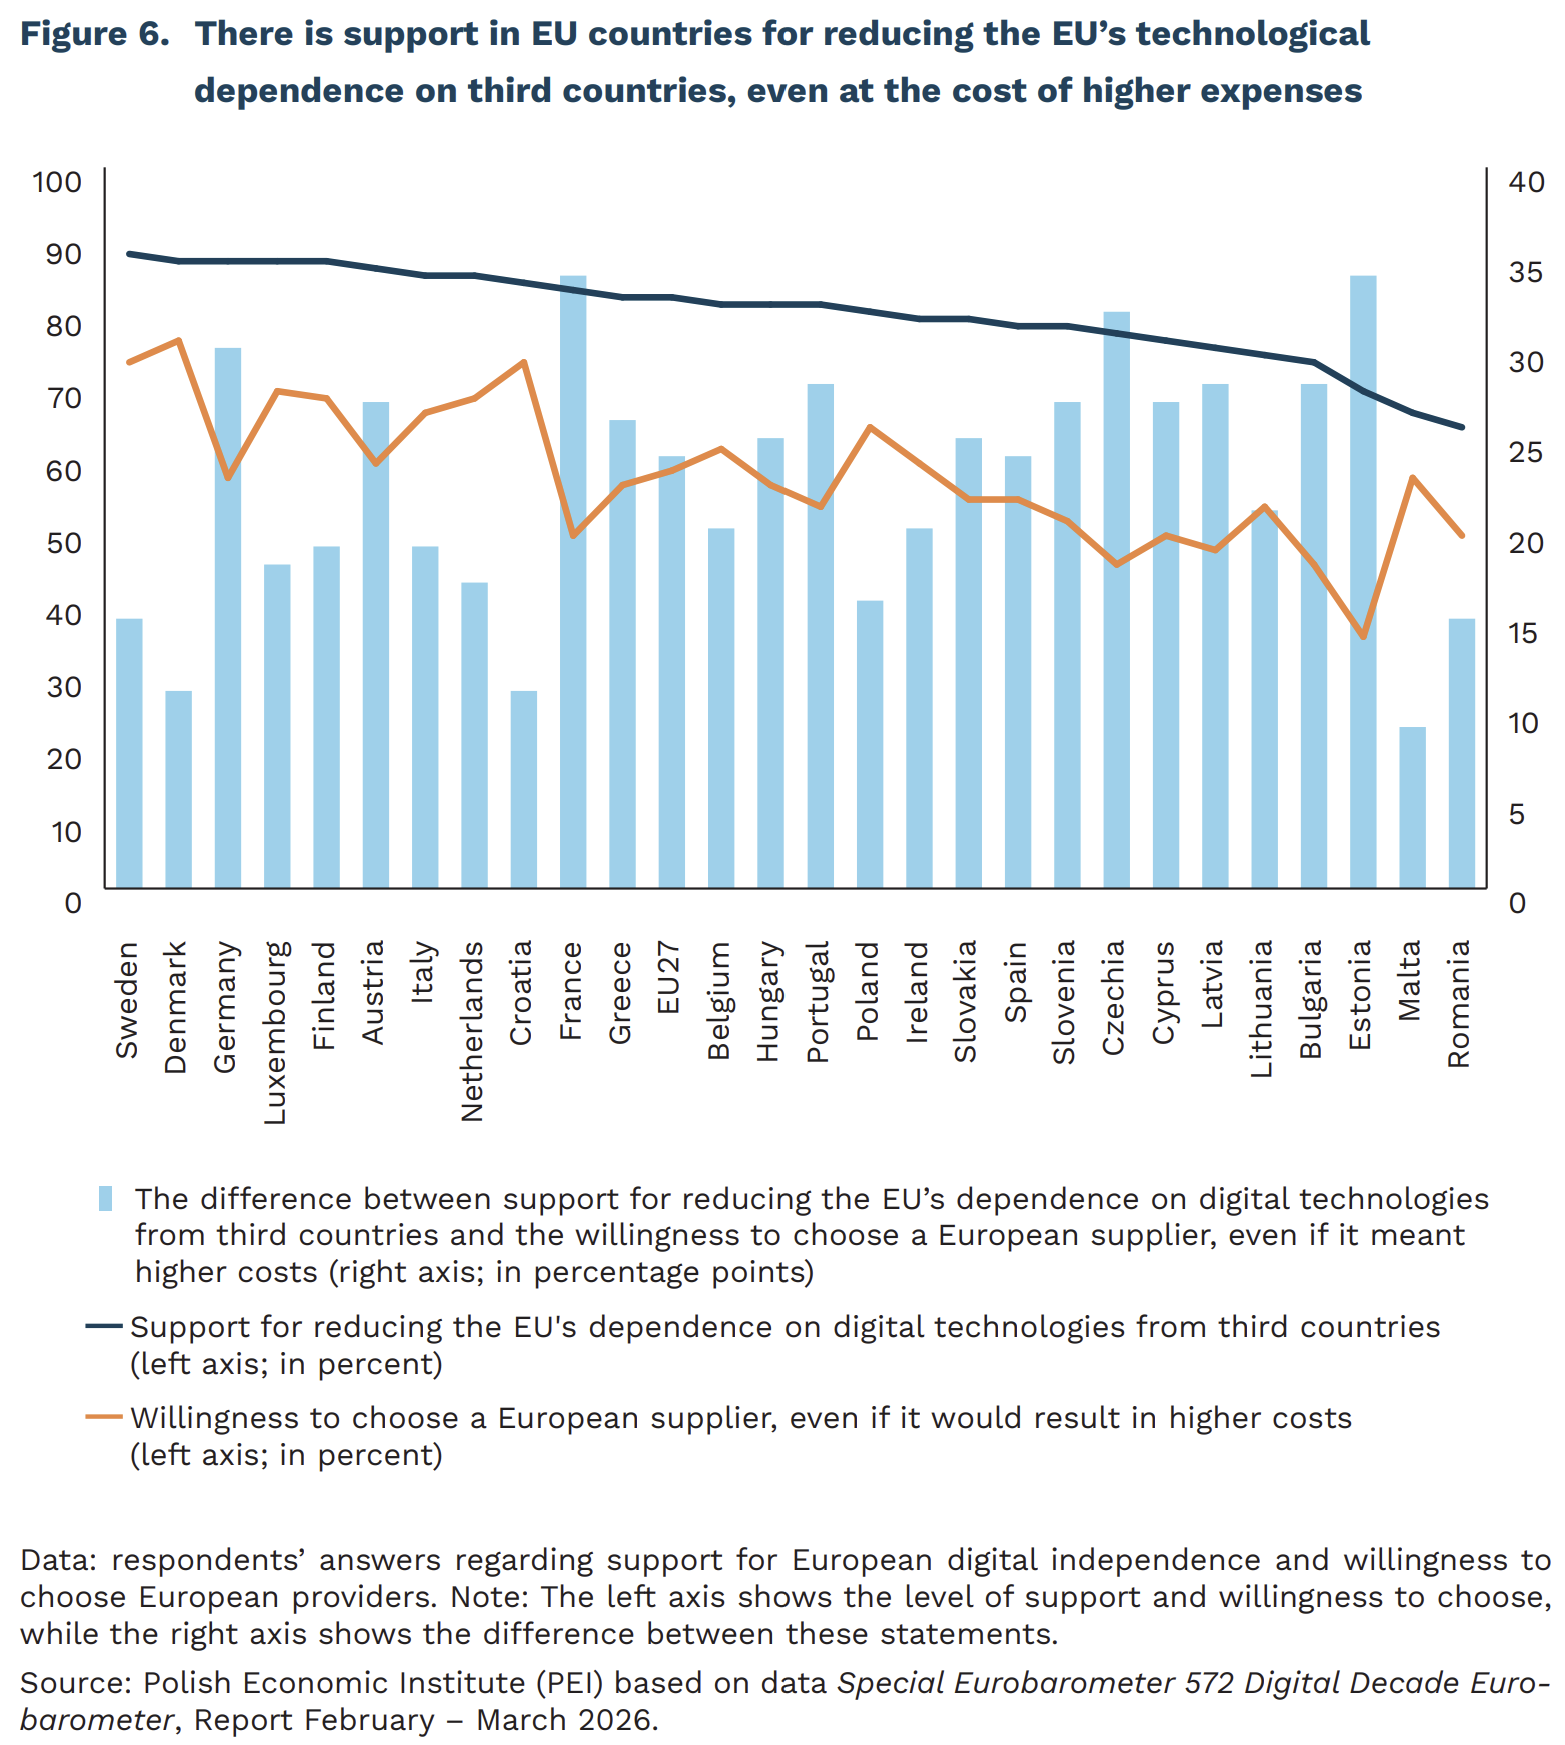
82% of Europeans believe that the EU should reduce its dependence on digital technologies from third countries
In all 27 EU member states, a majority of respondents believe that the digitization of everyday public and private services makes their lives easier. The most enthusiastic supporters of digitization are found in Sweden (86%), Poland (84%), and Denmark (83%). When asked which technologies are likely to have the most positive impact over the next ten years, respondents cited digital health technologies (55%), green technologies, including energy-efficient ones (50%), 5G/6G technologies (42%), and artificial intelligence (AI) and automation (39%).
Compared to other EU countries, Poland follows the European trend: the public wants more digitization and digital services, but at the same time, it demands transparent rules and security. Of particular importance are the protection of children and young people, as well as the impact of online manipulation on democratic processes (disinformation, foreign interference, AI-generated content, and deepfakes). On average, 92% of respondents in the EU believe that the EU should strengthen its efforts in this area, while in Poland this figure stands at 87%. A similarly high level of support exists for the protection of democratic processes in the digital environment – on average, 87% of respondents in the EU and 86% in Poland consider this area important.
Questions about the choice of digital service providers show that, for EU citizens, the country of origin of a tech company may matter. Europeans support greater digital independence for the EU, but they are less willing to pay extra for European solutions. 82% of Europeans believe that the EU should reduce its dependence on digital technologies from third countries. 50% of users are more likely to choose European solutions when they offer greater data protection. At the same time, 58% of them would be willing to use a digital service provider based in the EU, even if it meant slightly higher costs, although this statement elicits a higher level of disagreement compared to other questions.
At this stage of digitalization, the biggest challenge is no longer convincing people to use technology, but ensuring security and building trust that the technology will have a positive impact on their lives. It is evident that in the debate on new technologies, increasing emphasis is being placed on addressing not the need to implement technology, but how to ensure that it is used safely. The data indicate that the issue of the EU’s technological sovereignty is increasingly entering the public consciousness, and a relatively large proportion of respondents even accept the higher costs associated with choosing European suppliers.
Magdalena Lesiak
Does the emergence of smartphones reduce fertility?
33% and 52% according to a study by Myers and Hooper, the emergence of iPhones accounted for between 33% and 52% of the decline in fertility in the United States in 2007-2011
The thesis that the emergence of smartphones and social media contributed to the decline in fertility is gaining increasing popularity. An analysis by the Financial Times suggests that in many developed countries fertility rates began to fall more sharply after 2007, the year the iPhone was launched. Meanwhile, a US study uses a natural experiment related to one mobile network’s temporary monopoly on iPhone sales in the United States. The authors, Myers and Hooper, show that in counties covered by that network, fertility declined faster than in comparable regions. The effect was particularly visible among women aged 15-24 and may have explained between 33% and 52% of the decline in fertility among women aged 15-44 between 2007 and 2011.
Some researchers argue that this is not a direct effect of a new invention, but rather the catalysing of processes that already existed. Several possible channels of such indirect influence of smartphones on fertility are identified:
― acceleration of changes in social norms, especially in the area of entering relationships;
― changes in free time activities and socializing – thanks to the ability to stay in live contact with friends online, young people meet and spend time together in physical contact less often, which may make it more difficult to enter relationships;
― highlighting the opportunity cost of parenthood by exposing people to an attractive lifestyle that is harder to reconcile with raising children;
― a negative impact on mental health, which is supported by research on young people’s health around the world. Poor mental health may make it harder to find a partner or may lead people to postpone plans to have children.
The operation of the first two channels is inferred indirectly, among other things, from the declining sexual activity of young people, although it should be emphasised that these declines have occurred mainly over the past 5-10 years, rather than since 2007.
The “Financial Times” analysis can be criticised for cherrypicking data. In the eight countries presented, fertility trends have declined more rapidly since around 2007, when smartphones entered the market, but in other developed countries this period does not represent a turning point. In Poland, the largest decline in the 21st century has been visible since 2017. Similarly, for trends in countries such as France or Germany, 2007 does not appear to be significant. It is also considered problematic that the analysis use too short reference period, especially since it was a period of a temporary increase in the fertility rate, which distorts the comparison.
In the Myers and Hooper study, the relatively large decline in fertility in 2008 alone is surprising, given that iPhones were still not widely adopted at that time. There is a highly plausible confounding factor here: the financial crisis, which also began in 2007 in the United States, may have affected fertility in a way that is almost impossible to fully account for in empirical study, although the authors control for economic factors. The confounding factor in play could be the broadly understood uncertainty, which may encourage people to postpone having a child even when their personal financial situation is not poor.
Moreover, part of the observed effect may have resulted from a decline in the number of unplanned teenage pregnancies, hence the large decline in fertility among 15-19-yearolds. Easier access to emergency contraception in the United States around the same period may also have played a role. However, even if it was smartphones that contributed to a decline in unwanted pregnancies, this effect does not help us better understand changes in reproductive preferences and decisions, since it would mainly operate by reducing the frequency of unplanned pregnancies.
There are also grounds for doubt regarding the proposed channels through which smartphones and social media affect fertility. These channels may accelerate ongoing processes, but they are not their primary cause. In the case of changing social norms around relationships, the emergence of dating apps may have mattered more than the invention of the smartphone itself or the existence of social media. Yet even in this case, dating apps may have accelerated changes in social norms – another catalytic rather than causal effect – which have made people today more likely to marry for love than for financial or cultural reasons. As a result, they spend more time searching for a partner who is right for them, which may delay having children. However, dating apps did not themselves cause the change in these norms. In this sense, the effect does not provide a new insight into changes in the architecture of childbearing decisions.
Similar doubts can be raised regarding the opportunity-cost channel of parenthood, which also existed earlier, while social media may simply have made it more visible. There is also, for now, no good reason to believe that changes in how free time is spent would affect people’s willingness to enter a stable relationship or have a child – which today is usually a well-considered intention arising from deeply grounded life preferences. In delaying the birth of a first child, reducing the number of large families, or changing the share of voluntarily childless people, the key factors seem rather to be deep economic and social transformations that took place long before the spread of the internet or social media. Therefore, discovering a statistically significant effect of smartphones or social media in fact tells us little about what actually influences fertility intentions. Focusing on social media or smartphones sometimes seems to reflect technophobic attitudes more than it helps us understand new sources of demographic change.
Łukasz Baszczak