Economic Weekly 9/2026, March 6, 2026
Published: 06/03/2026
Table of contents
The gas market is more sensitive to conflict in the Middle East than the oil market
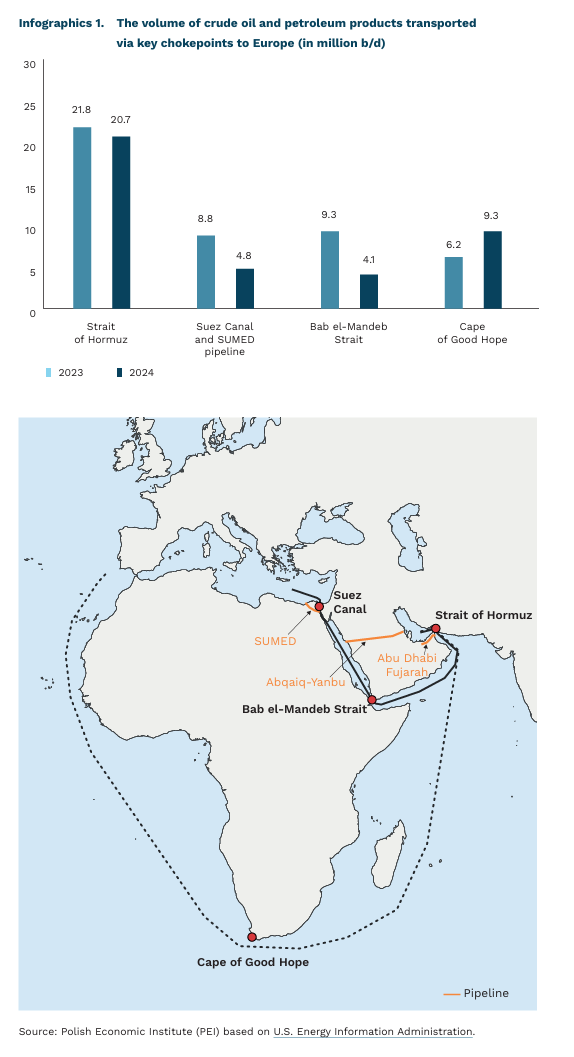
26% of global maritime oil trade in 2023 passed through the Strait of Hormuz
almost half of the maritime oil trade passing through the Red Sea declined in 2024 relative to 2023
16% of Poland’s gas supplies came from Qatar in 2024
For the European Union and Poland, the primary risk is not the security of oil and gas supplies, but the economic impact of rising prices for these commodities (for gas, from 40% – according to El Pais to 130% according to Goldman Sachs). The EU sources a large share of its oil from Norway and the United States (around 30% in the third quarter of 2025). At that time, the largest imports from countries in the Strait of Hormuz region came from Saudi Arabia, accounting for approximately 7% of total imports. In 2025, 48% of Poland’s total crude oil supplies came from Saudi Arabia (data from Statistics Poland, codes CN 2709 and 2710), although most of these shipments bypassed the Strait of Hormuz. However, the increase in oil prices may be partially offset by the announced rise in OPEC+ oil production of 206,000 b/d. Nevertheless, as the conflict continues, the risk of a significant increase in inflation and the associated economic consequences is growing. In the case of gas, the pattern of import dependence is different. Nearly 60% EU’s liquefied natural gas imports in the third quarter of 2025 came from the United States, while only 6% came from Qatar. In Poland’s case, the share was higher – in 2024, 16% of gas supplies came from Qatar. In 2025, 16 of the 81 LNG cargoes received at the port of Świnoujście originated from Qatar.
Located between Iran and Oman, the Strait of Hormuz remains the second most important chokepoint for global seaborne trade in natural resources after the Strait of Malacca. In recent years, oil flows through the Strait of Hormuz have averaged around 20 million barrels per day, accounting for approximately 27% of global maritime oil trade and about 20% of global petroleum liquids consumption (EIA). However, a relatively small share of tankers passing through the Strait was bound for Europe – around 6% were destined for the continent, while the vast majority went to Asia. Nevertheless, any suspension or significant disruption of traffic through the Strait would have important consequences for global oil and gas prices.
From the perspective of the energy security of Europe and Poland, a shutdown of the Strait of Hormuz would be of lesser significance for oil supplies due to the presence of regional pipelines that allow this maritime bottleneck to be bypassed. A pipeline to Fujairah in the United Arab Emirates enables shipments to avoid the Strait, while another leading to Yanbu in Saudi Arabia allows flows to bypass both the Strait of Hormuz and the Bab al-Mandab Strait. A third, the SUMED pipeline, transports oil directly to the Mediterranean Sea, bypassing the Suez Canal. Comparable infrastructure does not exist, however, for gas exports from the region, particularly from Qatar. Consequently, the implications for the gas market would be more serious than for the oil market. In addition, limited storage capacity for these commodities could prove problematic, potentially leading to production shutdowns.
Less important for global trade, but of particular significance from the perspective of imports to Europe, are the Bab el-Mandeb Strait and the Suez Canal. More than half as much of the global seaborne crude oil trade was transported via the Red Sea than via the Strait of Hormuz (11.1% through the Bab el-Mandeb Strait and 11.4% through the Suez Canal and the SUMED pipeline linking the Red Sea with the Mediterranean). Of this, 75% of the crude transported was destined for the European market (approximately 3 million barrels per day). The alternative route around Africa via the Cape of Good Hope accounted for 7.7% of global oil trade.
The Red Sea had already begun to play a smaller role from 2023 onwards. Between 2023 and 2025, the transit of oil-carrying vessels through the Suez Canal declined by more than 45%. The main reason for the reduction in flows were attacks by the Houthi movement on vessels passing through the Bab al-Mandab Strait (over 120 attacks), which accounted for 11.1% of global oil transport in 2023. The US military intervention resulted in an informal agreement not to target ships, nevertheless, shipowners continued for a considerable period to choose the longer but safer route around the Cape of Good Hope. At the beginning of 2026, it appeared that the situation was normalising and that the Suez Canal was regaining its importance for imports to Europe.
Krzysztof Krawiec, Katarzyna Sierocińska, Marek Wąsiński
Airspace restrictions now affect 22 countries
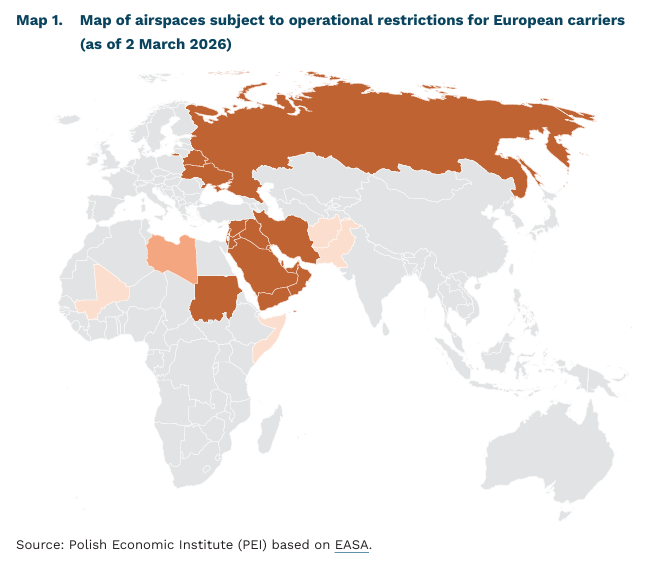
airspace in 22 countries remains partially or completely inaccessible to European air carriers
95 million passengers were handled by Dubai airport in 2025
54 million passengers were handled by Doha airport in 2025
The ongoing escalation of tensions and military operations in the Middle East has disrupted civil aviation. Restrictions resulting from security warnings concerning airspace in the Persian Gulf region – one of the main transfer hubs for travel between Europe and Asia – have led to route adjustments and longer flight times. The situation at Dubai International Airport in the United Arab Emirates is of particular importance. In 2025, it was the second-busiest airport in the world by passenger traffic, handling more than 95 million passengers (nearly half of them transfer passengers). Another major airport in the region is Doha, which handled more than 54 million passengers in 2025, around three quarters of them in transit (for comparison, Warsaw Chopin Airport handled a record slightly above 24 million passengers last year). Even after the cessation of hostilities, a return to normal operations will be a gradual process, and restoring the full route network may take many months – also due to a decline in passenger confidence in this route.
The European Union Aviation Safety Agency (EASA), in its Conflict Zone Information Bulletins, currently maintains 14 active bulletins covering 21 countries; restrictions also apply to flights over Belarus. EASA warnings are not legally binding but constitute official safety recommendations at the European Union level. In the Middle East and Persian Gulf region, the recommendations cover the entire airspace of Iran, Iraq, Israel, Jordan, Kuwait, Lebanon, Oman, Qatar, the United Arab Emirates, Saudi Arabia and Bahrain; a similar warning has also been issued with regard to Sudan. As of 4 March, civil aviation operations were taking place in countries such as Saudi Arabia, the United Arab Emirates and Oman; however, European air carriers are generally not currently operating regular commercial services to these destinations. On 4 March, Israel also announced plans to resume civil flights. EASA also recommends avoiding operations in the airspace of Pakistan, Afghanistan, Somalia and Mali below specified flight levels. In the case of Libya, the Agency recommends completely avoiding f lights at all altitudes, except for operations to airports located on the coast, provided that approaches are conducted from the sea, full coordination with the local administration and ATC is ensured, and a proper risk assessment is carried out by the carrier.
Security restrictions in the airspace over the Middle East and the Persian Gulf complicate route planning on Europe–South and East Asia routes. At the same time, the inability of European carriers to overfly Russia results in longer flight paths and extended travel times. As a result, air traffic has become concentrated in a narrow corridor of airspace over Georgia, Armenia and Azerbaijan, while some services to Japan are operated via polar routes over the Arctic. In practice, this leads to longer flight times, higher operating costs, lower route profitability and a greater concentration of traffic in limited air corridors. At its narrowest point, the distance between the borders of Iran and Russia is only 165 km, although aircraft are typically routed at some distance from the Azerbaijani–Iranian border.
Krzysztof Krawiec
Nearly 40% of new sole proprietorships in Poland were founded by women
102.8 thousand sole proprietorships registered by women in Poland in 2025
87% of the sole proprietorships established by women were founded by Polish nationals, while 13% were set up by foreign women
62% of the sole proprietorships started by Polish women operate in professional, scientific and technical activities, trade, healthcare, and other service activities
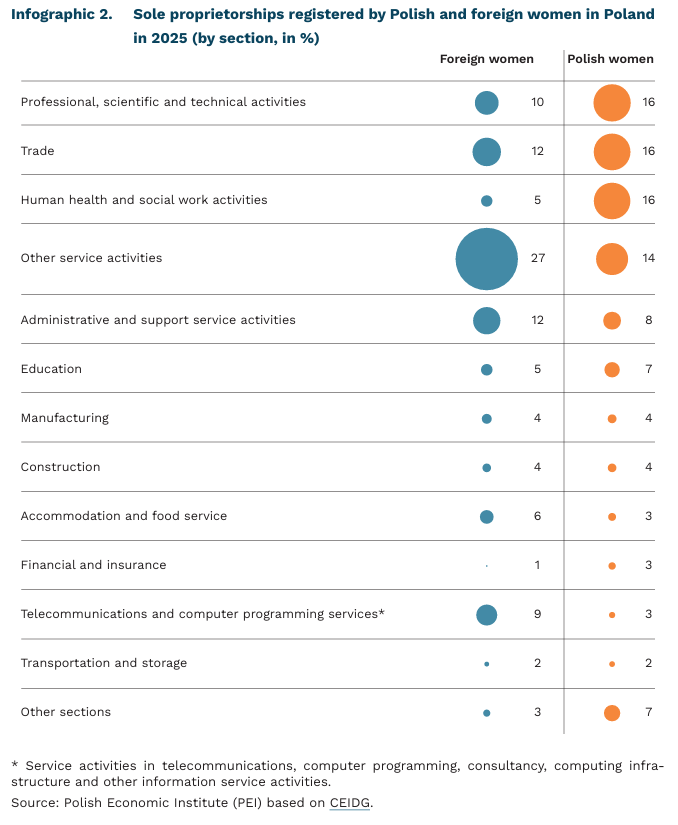
In 2025, women established 102.8 thousand sole proprietorships, accounting for 39% of all newly created businesses in Poland, according to data from the Central Registration and Information on Business (CEIDG). Most of these businesses – 87% – were registered by Polish women, while 13% were founded by foreign women.
Most sole proprietorships registered by foreign women (61%) operate in four sectors: other service activities, trade, administrative and support service activities, and professional, scientific and technical activities. Foreign women most often choose to operate in other service activities (27%), compared with 14% among Polish women. More often than Polish women, they are also active in telecommunications and computer programming services, administrative and support services, as well as accommodation and food service activities.
Six out of ten new sole proprietorships established by Polish women are concentrated in professional, scientific and technical activities, trade, human health and social work activities, and other service activities. In the sectoral structure of businesses run by Polish women, human health and social work accounts for 16%, compared with only 5% among foreign women. A similar pattern appears in professional, scientific and technical activities, financial and insurance activities, and trade. Some sectors have a similar or identical share in the structure of newly established businesses among both Polish and foreign women (e.g., manufacturing and construction).
Overall, the data point to two distinct profiles of women’s entrepreneurship in Poland. Businesses founded by immigrant women are more likely to operate in sectors with low entry barriers. In contrast, Polish women more often start businesses in sectors requiring diploma recognition or professional licenses. These differences are systemic in nature: migrant women face institutional barriers (e.g., recognition of qualifications, limited access to capital), which direct them toward sectors with lower entry barriers and more flexible regulations (mixed embeddedness theory). Formal labor market and integration requirements shape migrants’ employment structures and their concentration in specific market segments, as confirmed by OECD data.
Aleksandra Wejt-Knyżewska
The professional activity of Poles is growing, but the increase in employment is most visible in micro-enterprises
17.3 million people declared that they were in paid employment in Poland in the fourth quarter of 2025
3.2% the unemployment rate in Poland in Q4 2025 (measured using the survey method)
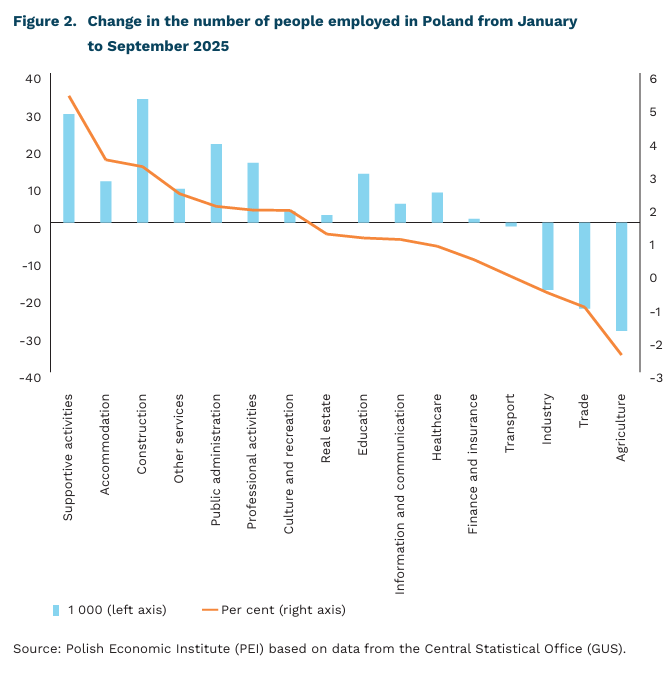
2.5% the decline in agricultural employment between January and September 2025
Both data from district labour offices and Labour Force Survey (LFS) data indicate an increase in unemployment. In January 2026, compared to December 2025, the number of registered unemployed increased by 45,000, and in 2025 as a whole, by almost 100,000 people. The increase in unemployment is also indicated by survey data, according to which the unemployment rate rose from 2.8% in the fourth quarter of 2024 to 3.2% in the fourth quarter of 2025. The observed increase in the number of unemployed persons is largely a consequence of changes in the rules for registration at labour offices. Following the change in the law, it became possible for unemployed persons to register at employment offices competent for their place of residence (rather than their place of registration). The path to registration was also opened to farmers with the smallest farms.
At the same time, however, with unemployment higher than in the previous year, a record number of people are working in Poland. LFS data show that this number increased in 2025 to 17.3 million people, i.e. by 99,000 people. Conclusions about high employment levels are also confirmed by national economic data, according to which the number of people in employment rose by 80,000 between January and September 2025, reaching 15.1 million [1]. The simultaneous increase in the number of unemployed and the number of employed indicates that economic activity is growing, meaning that more and more Poles are working or want to work and are looking for opportunities to do so.
The data also indicate significant changes in the structure of employment and an emerging mismatch between supply and demand in the labour market. From January to September 2025, the largest declines in employment were recorded in agriculture, trade and industrial production. In trade, the number of people in employment fell by 23,000 (-1%), in industrial production by 17,000 (-0.5%) and in agriculture by 29,000 (-2.5%). The decline in employment in agriculture can be explained by the facilitation of registering farmers as unemployed persons. However, data on employment in industrial production and trade indicate that the Polish economy is losing jobs in sectors that traditionally absorbed the largest number of medium- and low-skilled workers. At the same time, however, some industries recorded an increase in employment, with the highest increase in construction (+33,000, or 3.2%), administration and support activities (+29,000, or 5.3%), public administration (+21,000, or 2%), professional and scientific activities (+16,000, by 1.9%) and education (+13,000, by 1%).
The data paint a moderately positive picture of the labour market in Poland. The observed increase in economic activity contrasts with the fact that almost all of the growth in employment in the past period was generated by micro-enterprises and self-employed persons. In turn, employment in small, medium and large enterprises in Poland fell by 0.8% in 2025. These changes indicate the growing fragmentation of the Polish economy, which in the long term may herald problems with maintaining the pace of productivity growth in the Polish economy. This is indicated by the decline in employment in the largest entities, which have more capital and incur higher investment expenditure, and the increase in employment in micro-enterprises. At the same time, the number of job offers in employment offices and on recruitment portals is lower than in previous years.
- National economy data do not include persons employed under non-social security-covered civil law contracts and persons working in budgetary units conducting activities in the field of national defence and public security.
Paula Kukołowicz
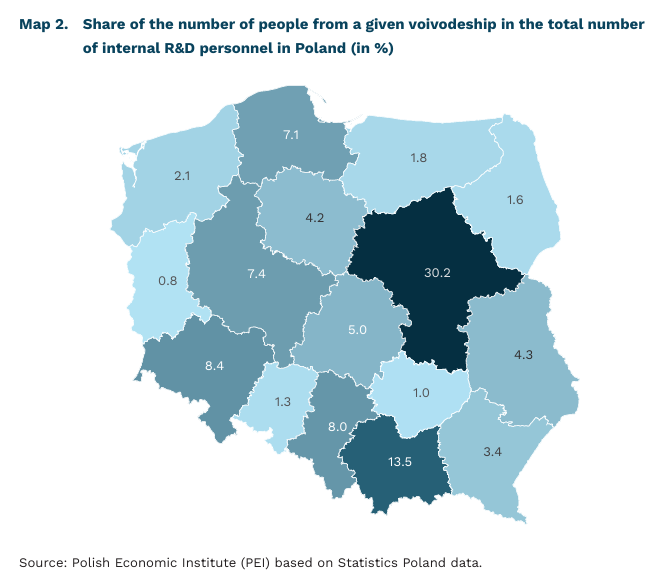
Regional disparities may limit further growth in R&D personnel numbers in Poland
320,000 people were involved in R&D activities in Poland in 2024
30% the share of people from the Mazowieckie voivodeship in the total number of internal R&D personnel in Poland in 2024
1.15% of economically active people working in R&D in Poland in 2024
According to the Statistics Poland (GUS), 320,000 people were involved in research and development (R&D) in Poland in 2024. This is 36,000 more than in 2020. The number of people who can be classified as R&D personnel is growing steadily in Poland, although this trend was interrupted in 2008 and 2024. The geographical concentration of R&D employees in the country and the significant gap between Poland and the EU average remain a challenge.
263,000 people worked as internal R&D personnel (i.e., individuals working within organisations rather than external collaborators) in Poland in 2024. This is 37,000 more than in 2020 and 142,000 more than in 2007. The highest level was reached in 2023, when over 266,000 people worked in R&D. R&D personnel include all persons directly involved in research and development activities who devote at least 10% of their total working time to these tasks, according to data from the Statistics Poland (GUS). This category may include both internal R&D personnel (i.e., employees conducting research and development as part of their own unit’s activities) and external personnel (i.e., associates involved in R&D work).
According to Eurostat data, 1.15% of the economically active population worked in R&D in Poland. This is a higher percentage than in several countries such as Lithuania, Croatia, Slovakia, and Bulgaria, where the figure was around 1%. At the same time, it is significantly lower than the EU average (1.6%). The highest values of this indicator were recorded in Central and Northern European countries, including Belgium (2.34%), Denmark (2.30%), Finland (2.28%), and Sweden (2.24%).
30% of all internal R&D personnel in Poland work in the Mazowieckie voivodeship. Next in line are the Małopolskie (14%), Dolnośląskie (8%), and Śląskie (8%) voivodeships. At the other end of the spectrum are the Lubuskie, Świętokrzyskie, and Opolskie, where approximately 1% of classified R&D personnel worked. This distribution illustrates the dominance of several metropolitan areas where innovative activity is concentrated and the negligible share of such activity in regions at the other end of the spectrum.
The systematic increase in the number of people working in R&D points to a growing demand for innovative, research, and development skills in the economy. At the same time, the gap between Poland and the EU average is significant, which may limit the competitiveness of the Polish economy in the future. Large regional differences in the share of voivodeships in the total number of R&D personnel may result from agglomeration effects or the presence of academic centers. At the same time, in the long term, this may contribute to perpetuating differences in productivity and wages between regions, as well as hampering progress in innovation on a national scale. Research on innovation in China shows, among other things, that relations with more innovative regions are important for the development of peripheral regions. In order to strengthen less innovative voivodeships, the emphasis should therefore be placed not so much on building local clusters in regions with less developed R&D activities today, but on designing lasting cooperation relations with those voivodeships that are currently leading in this activity.
Filip Leśniewicz
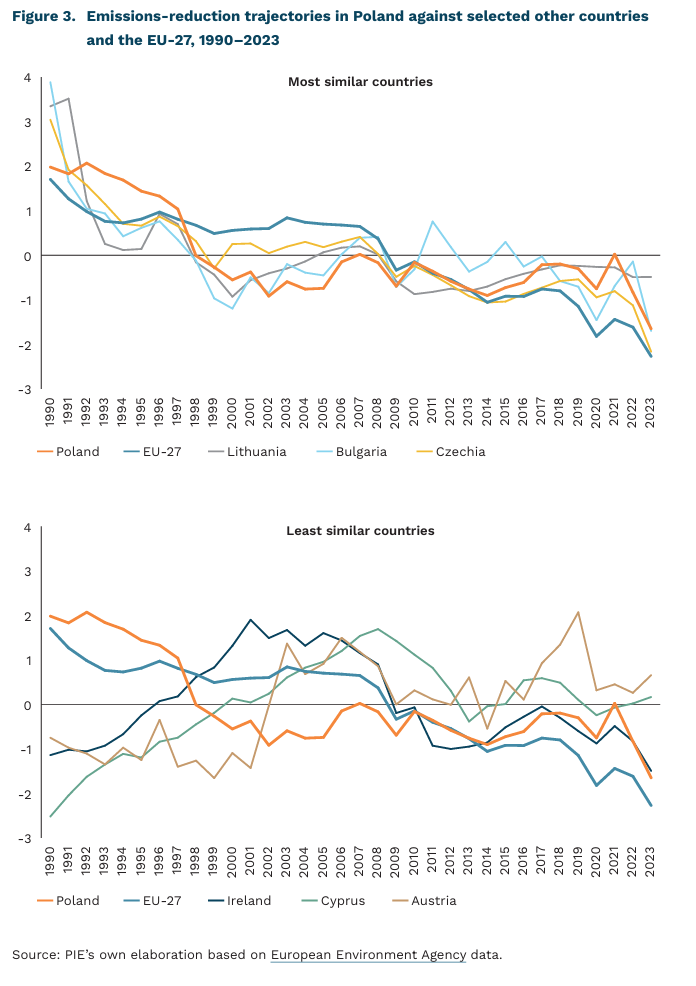
Poland’s economy follows Czechia, Bulgaria and Lithuania in reducing net emissions
a 28.7% decline was recorded in net emissions from the Polish economy in CO₂eq in 1990-2023
a delay of just under 1 year characterises Poland’s emissions-reduction trajectory compared with the countries with the most similar emissions pathway
Total net emissions from the Polish economy declined by 28.7%, from 476 million tonnes of carbon dioxide equivalent (CO₂eq) in 1990 to 316 million tonnes CO₂eq in 2023 (EEA). Over the period analysed, net emissions declined in all sectors except transport. The largest absolute reduction was recorded in the energy sector, which nevertheless remains Poland’s largest sectoral emitter (148 million tonnes CO₂eq in 2023). To assess which countries follow emissions trajectories most similar to that of Poland, we applied the Dynamic Time Warping method (DTW), comparing both the shape of the trajectory and the dynamics of change in the time series, the method identifies countries with similar emission patterns. For cross-country comparability, the data were standardised so that differences in absolute emission levels did not drive the similarity assessment.
The trajectories of reductions in total net CO₂eq emissions in Czechia, Bulgaria and Lithuania are closest to the path observed in Poland, according to the DTW results. In these countries, as in Poland, emissions fell sharply in the first half of the 1990s and then stabilised at a relatively constant level, with only minor fluctuations. These economies shared an energy-intensive production structure inherited from the previous system, with a high share of industry, which underwent profound restructuring during the political and economic transition. A renewed decline in emissions began in the second decade of the 21st century, already during these countries’ membership in the European Union. A shift of around -1 to -1.5 suggests that analogous movements (declines and increases) occur, on average, about one year earlier than in Poland, implying a slight lag in Poland’s pace of change relative to these countries.
Despite the higher energy intensity of the Polish economy, the calculations indicate that Poland lags the EU-27 average in the pace of emissions reduction by just under one year. The shape of the EU emissions-reduction trajectory is broadly similar to Poland’s, but differs in showing a more consistent decline in emissions beginning around 2005. This date can be linked to the entry into force of the EU Emissions Trading System (EU ETS).
Among EU Member States, the lowest similarity to Poland in terms of emissions-reduction trajectories was observed for Cyprus, Ireland and Austria. The shape of these countries’ trajectories differs markedly from that Poland: whereas Poland and other countries in the region recorded strong declines in the 1990s, Cyprus, Ireland and Austria exhibited an upward trend that only stabilised in the first decade of this century. Given the pronounced differences in the course of the decarbonisation trajectories analysed, the DTW-based matching is less clear-cut; consequently, conclusions regarding time shifts should be interpreted with particular caution.
Krzysztof Krawiec, Jakub Kubiczek
Foreigners in Poland relatively rarely feel discriminated against
12.5% of foreigners living in different EU countries experience discrimination in access to housing
4.3% of foreigners living in Poland feel discriminated against in public spaces
6% of foreigners living in Poland feel discriminated against in contacts with institutions and public administration or when using public services
According to the latest Eurostat data describing 2024, citizens of different European Union countries generally feel significantly more discriminated against in various life situations when they live outside their country of origin. However, the scale of this discrimination varies.
Europeans most often feel discriminated against when searching for housing (either to buy or rent). Discrimination in this area is experienced by 12.5% of surveyed EU citizens living outside their home country, compared with 4.3% of Europeans living in their country of origin who report this form of discrimination. The smallest share of EU citizens feels discriminated against in the education sector (i.e. in interactions with educational institutions). This concerns only 4.3% of EU citizens residing outside their country of origin and 2.3% of Europeans living in their own country.
Only 4.2% of people living in Poland who were not born here, report experiencing discrimination in public spaces (e.g. in shops, restaurants, sports facilities, etc.). Only seven other EU countries have a lower share (the EU average is close to 8%). The lowest rate is in Croatia. Countries with the highest share of foreigners experiencing discrimination in public spaces are those with a high proportion of immigrants in the population: the Netherlands ranks first (over 16%), followed by Austria, Denmark, and Finland. Poland also performs relatively well regarding perceived discrimination in interactions with administration, institutions, and public services – only 6% of foreigners report discrimination, which is the 7th best result in the EU. Unfortunately, the share of foreigners experiencing discrimination when searching for housing in Poland is 12.9%, which is above the EU average.
However, the Eurobarometer survey indicates broader problems with discrimination. The 2023 edition of the survey shows an increase in the belief among EU citizens that discrimination is widespread in almost every area compared with 2019. The only area where Europeans reported discrimination less frequently is religious discrimination.
With regard to discrimination in employers’ evaluation of job candidates, EU citizens believe that age (being too young or too old) is the most important discriminatory factor. In 2023, 52% of EU citizens expressed the belief that ageism exists in recruitment processes. The second most commonly perceived factor of discrimination was physical appearance. The smallest share of EU citizens believed that candidates in their country could experience discrimination in recruitment due to place of residence or religion.
Łukasz Baszczak