Economic Weekly 21/2025, May 30, 2025
Published: 30/05/2025
Table of contents
Almost Two-Thirds of Polish Companies Offer Flexible Working Arrangements
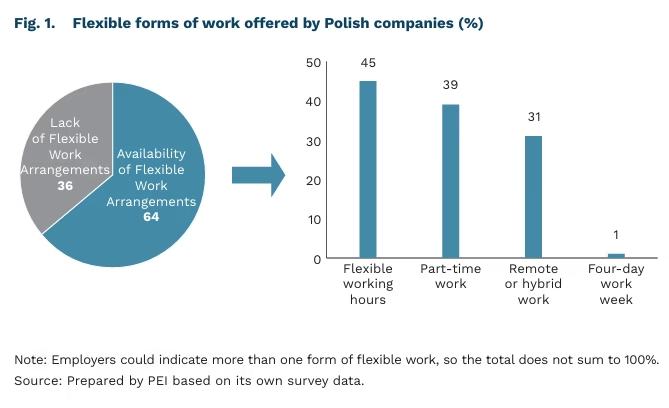
64% of companies offered flexible working arrangements to employees in 2024
45% provided flexible working hours in 2024
38.9 hours average number of hours worked per week by Poles in 2024
According to a PEI survey conducted in December 2024 on a sample of 1,000 companies, 64% of Polish businesses provided employees with flexible working arrangements. Flexible working hours were the most common form of alternative work organisation, offered by 45% of surveyed entities in 2024, compared to 42% the year before. This practice was particularly common among large companies (66%) and those operating in Administrative and Support Service Activities (62%), Professional, Scientific and Technical Activities (59%), and Information and Communication (59%). Allowing part-time work was slightly less common, with 39% of companies offering this option in 2024, down from 41% the previous year. It was most frequently available in large (41%) and medium-sized (39%) enterprises, as well as in sectors such as accommodation and food service activities (52%) and arts, entertainment and recreation (52%).
Remote or hybrid work was available at 31% of companies in 2024, down slightly from 33% the previous year. This arrangement was more prevalent among large companies (48%) and those in the Information and Communication; Professional, Scientific and Technical Activities; and Administration and Support Services Activities sectors. In contrast, the four-day working week remains rare among Polish companies – only 1% of those surveyed by PEI in both 2023 and 2024 had adopted it.
Despite the growing availability of flexible work arrangements, Poles remain among the longest-working nations in the EU. In 2024, Polish employees worked an average of 38.9 hours per week – nearly 3 hours more than the EU average. Only Greeks (39.8 hours) and Bulgarians (39.0 hours) worked longer. The shortest working hours were recorded in the Netherlands (32.1 hours), Denmark, Germany, and Austria (each with 33.9 hours). Although average weekly working time in Poland has fallen by more than 1 hour since 2016 (from 40.0 hours), the country still ranks near the top for working hours. These cross-country differences reflect the inclusion of both full-time and part-time employees in the average. Countries with shorter working hours tend to have a higher share of part-time workers.
In terms of work-life balance, Poland performs worse than most EU countries. In the OECD Better Life Index, under the work-life balance component, only two EU member states (Austria and Ireland) scored lower than Poland. The highest scores in this area were achieved by Italy, Denmark, Spain, and the Netherlands.
Anna Szymańska
The Majority of Poles Believe That Young Children Should Be Cared for Primarily by the Family, Not Government Agencies
85% of children under the age of 3 do not receive any formal care or education
75% of Poles believe that preschool children should be primarily cared for by the family
In Poland, the majority of children under the age of 3 are looked after exclusively by their parents (58% compared to the EU average of 48%). As many as 85% of children in this age group do not receive any formal care or education (compared to 61% in the EU). In 2023, 54% of municipalities had a crèche or children’s club, and just 38% of rural municipalities. This highlights ongoing gaps in access to institutional childcare for the youngest children. Additionally, parents face barriers such as a lack of facilities near their place of residence, limited availability of free places, high costs, and inadequate opening hours that are not aligned with their work schedules.
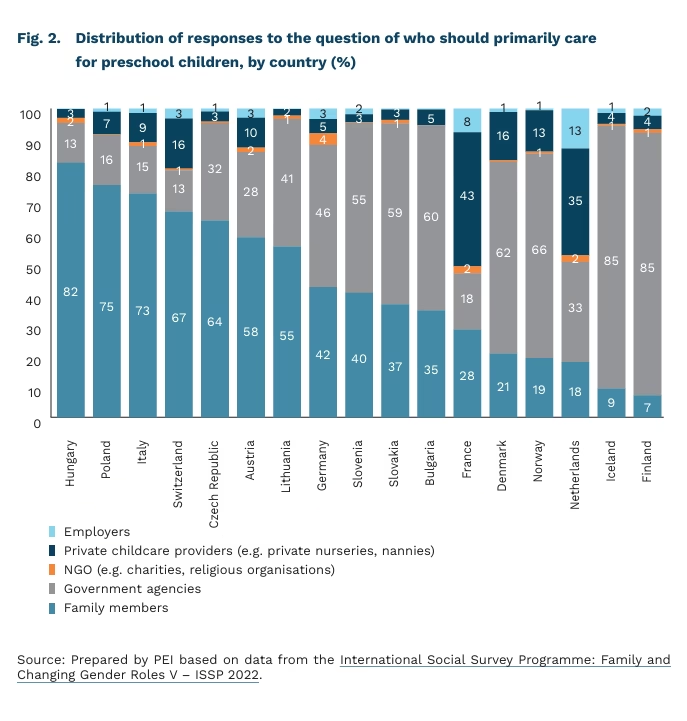
Social norms around childcare in Poland continue to favour the family as the primary provider. According to the ISSP survey, 75% of Poles believe that young children should be primarily cared for by the family. Only 16% of respondents chose government agencies, while 7% pointed to private providers. Similar views are prevalent in Hungary and Italy. In contrast, Scandinavian countries tend to view childcare as a responsibility of the state. In France and the Netherlands, the majority of respondents favour private providers.
Social attitudes towards parental roles are gradually shifting towards egalitarianism, but traditional divisions still prevail. The ISSP survey shows that the majority of Poles (60%) believe that mothers and fathers are equally predisposed to the daily care of children. By comparison, in the most progressive societies in this respect – France and Norway – as many as 80% of citizens share this view. Among Poles, 72% declare that the mother and father should share daily care equally, but only 51% believe that parents should be equally responsible for the financial upkeep of the family. Moreover, egalitarian views do not materialise in most families. According to the PEI survey, mothers do more of the work at home and often declare that they are satisfied with this division.
Expanding the availability of institutional childcare for the youngest children has a positive impact on maternal labour force participation, equal opportunities, and fertility rates as demonstrated in countries such as Germany and Norway. In Poland, improved access to childcare has positively affected maternal employment; however, this effect has been more pronounced in less conservative regions and weaker in regions where traditional values are more deeply rooted. In Australia, traditional views on parental gender roles were associated with reduced reliance on institutional childcare, regardless of parents’ employment status.
The predominance of family-based childcare in Poland is shaped by three mutually reinforcing factors: limited access to childcare services, persistent traditional cultural norms, and everyday social practices that reinforce them. An additional contributing factor may be limited trust in institutional care providers, stemming in part from entrenched stereotypes. As a result, the effectiveness of programmes aimed at expanding institutional childcare may remain constrained.
Iga Rozbicka
Developed Countries Are Building Less than Before the Inflation Crisis
11.6% projected share of the construction sector in global GDP by 2028
46% share of 150 surveyed countries where construction investment declined in 2023
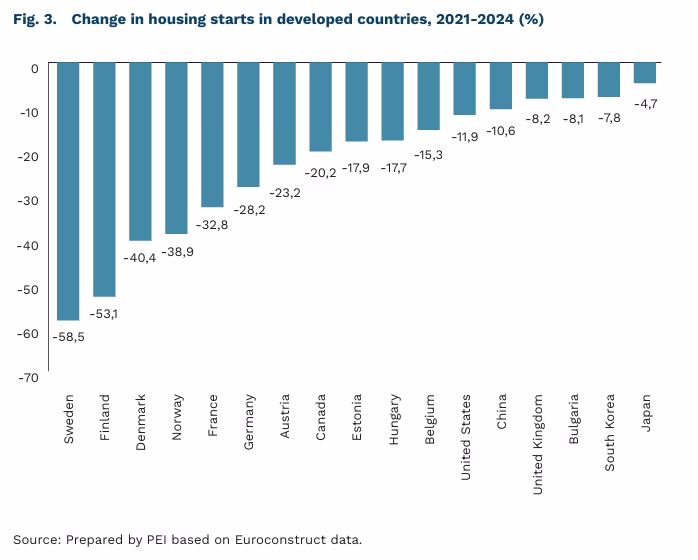
-58% drop in housing starts in Sweden between 2021 and 2024
For years, the global construction sector expanded more rapidly than global GDP, acting as a key engine of growth. By 2028, however, its share of the global economy is expected to drop to a record low of 11.6% of GDP, compared to 13% in 2007. This decline is driven in part by the increasing importance of the services sector in today’s economies.
Since 2023, construction investment has not only stopped contributing to GDP growth but has begun to weigh it down. In the wake of the inflation crisis, construction sectors in many countries, particularly developed ones, have weakened. According to the Euroconstruct report, investment in construction has declined both in China and the United States, which together represent 43% of the global construction market, compared to levels before the pandemic and the inflation surge.
The steepest declines are seen in residential construction. Many countries have recorded double-digit drops in housing starts, with the sharpest contractions occurring in the Scandinavian countries, Germany, France, and Italy. Between 2021 and 2024, housing starts fell by 58.5% in Sweden, 53% in Finland, and 40% in Denmark. These declines are driven by a combination of high interest rates, rising construction costs, and increasingly stringent regulations in developed economies. These pressures coincide with a growing housing shortage in many urban areas, underscoring the widening gap between social needs and market realities.
The situation in Central and Eastern Europe is markedly different. Unlike in Western Europe, most countries in the region saw significant growth in the number of dwellings completed in 2024, both compared to 2021 and the pre-pandemic period. Robust performance in Poland, Slovakia, Romania, and the Czech Republic is driven by several factors, including ongoing economic convergence, a lower housing stock per 1,000 inhabitants, relatively low levels of household debt, and strong demand for infrastructure.
Tomasz Mądry
There Are Weak Signs of Recovery in the German Economy
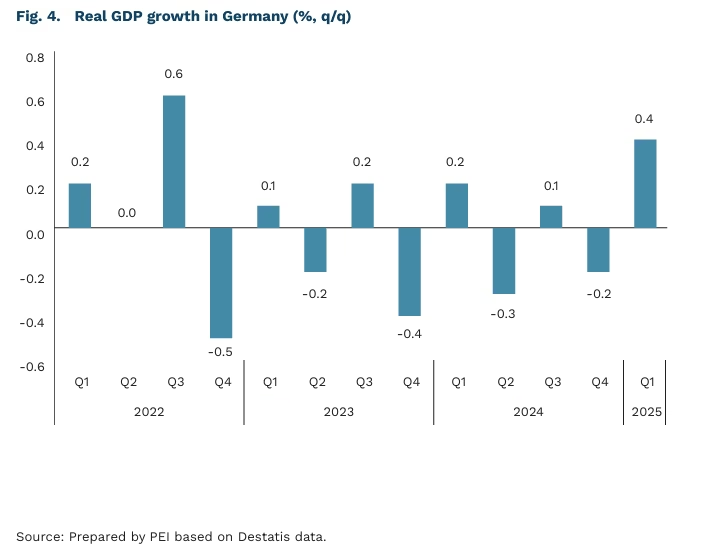
0.4% the quarter-on-quarter growth of Germany’s real GDP in Q1 2025
3.2% the increase in German exports compared to Q4 2024
The German economy is showing tentative signs of recovery, though strong and sustained growth remains elusive. In Q1 2025, real GDP increased by 0.4% q/q, exceeding the consensus forecast of 0.2%. This growth was largely driven by improved performance in March, particularly in the industrial sector and exports. Exports rose by 3.2% q/q, with strong demand for pharmaceutical products, cars, trailers, and semi-trailers, especially from the US market amid fears of escalating trade tensions. Private consumption (up 0.5% q/q) and investment (up 0.9% q/q) also contributed positively to the economic rebound. German GDP growth outpaced the EU average of 0.3% during the same period.
Business sentiment in Germany is gradually improving. The Ifo Business Climate Index rose to 87.5 points in May, up from 86.9 points in April. Optimism increased across key sectors – manufacturing, services, trade, and construction – particularly in trade and industry, where firms revised their forecasts upward due to stabilising order volumes. However, companies rated their current business situation slightly less favourably than in the previous month. Meanwhile, the manufacturing Purchasing Managers’ Index (PMI) rose to 48.8 points in May, just below the consensus forecast of 49. Although still below the 50-point threshold that indicates expansion, this was the highest reading recorded in the past 33 months.
Poland’s main trading partner remains in stagnation. Germany’s GDP declined by 0.2% year-on-year in Q1 2025, and the country is unlikely to experience any growth over the course of the year. According to the German Chamber of Industry and Commerce (DIHK), GDP is expected to contract by 0.3% in 2025, marking the longest period without economic growth in Germany since World War II. Despite moments of temporary optimism, the overall business climate remains subdued in the long term. The German economy continues to be weighed down by uncertainty related to global trade tensions, weak domestic demand, and high labour costs. At the same time, hopes for recovery are centred on a stimulus programme focused on investment, which could support a return to positive GDP growth in 2025
Piotr Kamiński
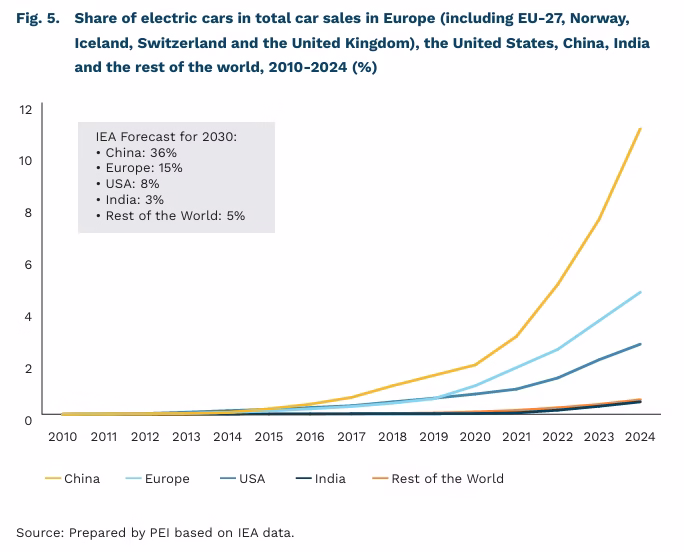
Asia Leads in Terms of Newly Registered EVs
1 in 4 cars sold worldwide in 2025 will be electric
4.7% the share of electric cars in Europe (EU-27, Norway, Iceland, Switzerland and the UK) in 2024
70% China’s share of global electric vehicle production in 2024
In 2024, 17 million electric cars were sold worldwide, accounting for over 20% of all new vehicle sales. According to forecasts by the International Energy Agency (IEA), global sales of electric vehicles are expected to reach 20 million units in 2025, with electric cars making up more than 25% of total global sales. The IEA projects that their market share could exceed 40% by 2030.
China remains the global leader in electric vehicle sales, accounting for nearly half of global car production in 2024. That same year, 48% of new cars registered in China were electric. In the United States, electric car sales grew by approximately 10% year-on-year in 2024, with 1 in 10 new cars sold being electric. That same year, every tenth car sold in the U.S. was equipped with an electric drive. In Europe, between 2022 and 2024, electric vehicle sales stagnated due to reduced public support for their purchase, although the share of electric vehicles in total registrations remained at a relatively high percentage in 2024 (IAE).
The development of electromobility is particularly visible in Asia and the Pacific. Excluding China, electric car sales in developing Asian economies grew by 40% in 2024 compared to the previous year. The largest EV markets in the region are Thailand, Indonesia, and Vietnam, where smaller and more affordable electric cars dominate (IAE).
Although rising global demand for electric vehicles presents an opportunity for Europe’s export-oriented automotive sector, the industry is currently facing major challenges in transitioning to zero-emission vehicle production. The difficulty lies not only in gaining a competitive advantage in global exports, but also in maintaining its share of the EU’s internal market. According to the European Automobile Manufacturers’ Association (ACEA), in 2023, the value of electric car imports into the EU reached EUR 9.7 billion in 2023, while exports to China totalled only EUR 0.9 billion. In 2022, the automotive industry employed 3.5 million people and accounted for 1.7% of the EU’s total gross value added. That same year, EU automotive exports to non-EU countries amounted to EUR 235.6 billion – 7.2% of total EU exports (EUR 3,291 billion). These figures are cause for concern, given the automotive sector’s historically central role in the European economy.
Krzysztof Krawiec
Three Decades After the Fall of Apartheid, South Africa Still Tops Global Inequality Rankings
72% of private agricultural land in South Africa is owned by 30,000 to 40,000 white farmers
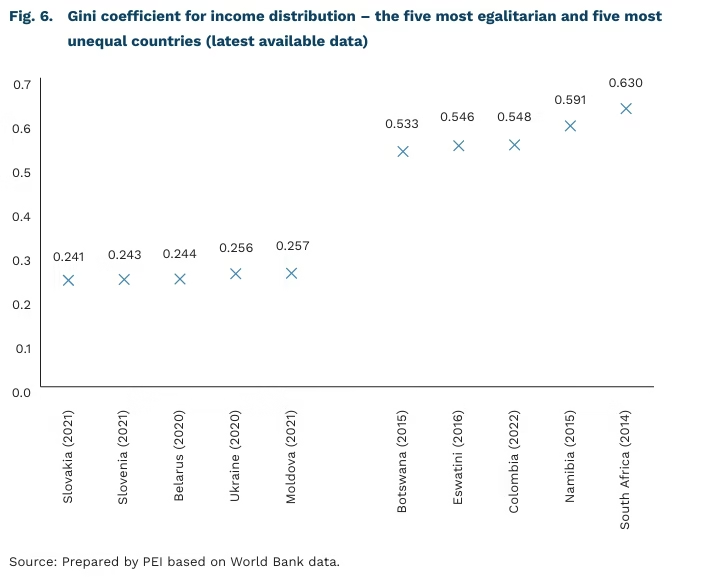
0.63 the Gini index for income distribution (the highest income inequality in the world, according to the World Bank)
19 million South Africans receive social grants (31% of the population)
The visit of South African President Cyril Ramaphosa to the White House reignited international attention on the situation of white commercial farmers in South Africa. According to estimates, between 30,000 and 40,000 white-run commercial farms account for around 72% of privately owned agricultural land. In stark contrast, black farmers – despite making up 81% of the population – own just 4% of the land. This disparity in land ownership underscores a broader issue: the persistence and reproduction of income and wealth inequality in post-apartheid South Africa.
According to the World Bank, South Africa has the highest income inequality in the world. The Gini index for income distribution stands at 0.63, based on the latest available data. This marks an increase from 0.59 in 1993 and 0.57 in 2000, although it briefly peaked at 0.65 in 2005. (The Gini coefficient theoretically ranges from 0, indicating perfect equality, to 1, indicating maximum inequality.) Wealth inequality is even more severe. According to one study the richest 10% of South Africans control 86% of the country’s total wealth. The top 0.1% own nearly one-third, while the wealthiest 0.01% (approximately 3,500 individuals) hold more wealth than the poorest 90% combined.
The apartheid system, an official policy of racial segregation introduced in 1948, formally ended with the democratic transition in 1994. However, its legacy continues to shape the social structure and the distribution of income and wealth. Inherited spatial segregation means that a significant portion of the black population lives in townships and on urban fringes, with limited access to quality education and the labour market. As the younger generation often inherits the social and economic capital of their parents, inequalities within and between generations are perpetuated for much of the black population.
Government redistribution mechanisms, particularly the social grant system, which currently supports around 19 million citizens (31% of the population), have had only moderate effects. Estimates suggest that these transfers reduce the Gini coefficient by just 6.7%. Affirmative action programmes, such as Black Economic Empowerment (BEE), aimed at increasing black participation in the economy, have not led to a broad breakthrough. Instead, they have contributed to the emergence of the so-called “black diamond” class – a small group of privileged entrepreneurs, often closely tied to political structures.
Although inequality in South Africa has a racial dimension, the persistently high Gini coefficient is increasingly driven by disparities within racial groups. The income gap between white and black South Africans (as well as people of mixed heritage, referred to as Coloureds) is gradually narrowing. However, the incomes of the wealthiest members of the black community are rising much faster than those of the poorest. In 1995, only 350,000 black South Africans were in the top 15% of earners; by 2022, this number had risen to approximately 5.6 million. This trend is also reflected in the growth of the black middle class, now estimated at 3.4 million people (7% of the black population). Changes are also evident in asset ownership – by 2022, black investors accounted for about 30% of the Johannesburg Stock Exchange’s market capitalisation.
Dominik Kopiński
Europe Is Dependent on American Cloud Services and Software
EUR 400 billion estimated annual spending by EU companies on cloud services and software
83% share of US providers in the European cloud and software market
In an era of accelerating digital transformation, the rising importance of cloud services and software is becoming a key factor shaping the competitiveness of modern economies. A report by the Asterès Institute presents estimates on the extent to which companies in the European Union rely on cloud and software solutions from the United States.
According to Asterès, companies in the EU spend approximately EUR 400 billion annually on cloud services and software – equivalent to 2.2% of their total turnover. Of that amount, 83% (around EUR 330 billion) goes to US-based providers. The report also notes that in 2022, EU countries exported USD 413 billion worth of IT services, generating a trade surplus of USD 225 billion – USD 194 billion of which was attributed to Ireland alone.
Asterès estimates that purchases of cloud services and software by European firms from American providers directly generated USD 285 billion in turnover in the US, supporting more than 800,000 jobs and creating USD 186 billion in added value. These figures represent approximately 0.6% of US GDP and 0.5% of total US employment.
The authors of the report highlight significant challenges in accessing data on trade f lows in digital services, particularly those related to cloud computing and software. Trade statistics for IT services in the EU are notably skewed by the role of Ireland, where many US tech corporations base their European operations. These digital giants may export services directly from their home countries or provide them locally through subsidiaries based in Europe. In the latter case, expenditures on these services are reflected in the foreign direct investment income of these companies. However, this approach also faces limitations: existing databases lack sufficient detail and completeness to accurately trace the sectoral and geographical distribution of such exchanges, particularly the flow of digital services between the EU and the United States.
The data presented in the Asterès report point to a significant imbalance in the cloud computing and software market between the European Union and the United States. The potential to redirect part of this spending to benefit European firms is considerable. At the same time, it is important to acknowledge the risks associated with the EU’s growing dependence on a small number of foreign providers. Such a high level of reliance could pose systemic risks and disruptions, and mitigating these should be a strategic priority for EU policymakers.
Filip Leśniewicz