Economic Weekly 2/2026, January 16, 2026
Published: 16/01/2026
Table of contents
U.S. intervention in Venezuela as a challenge to the interests of Moscow and Beijing
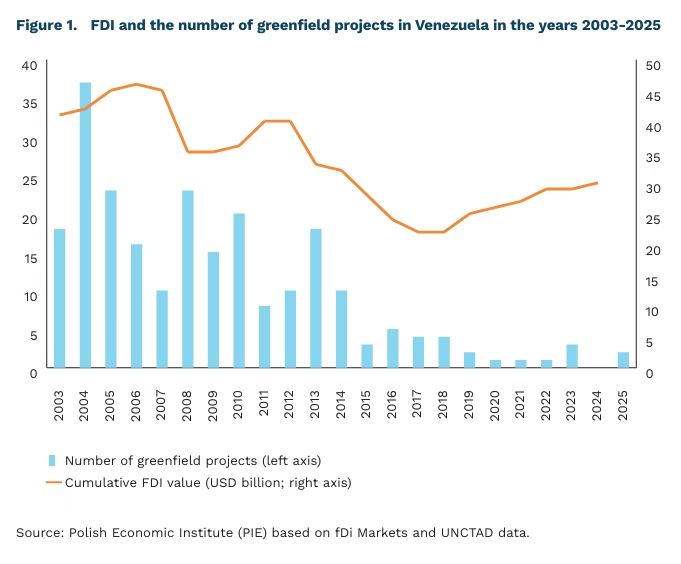
USD 30.5 billion the cumulative value of FDI in Venezuela in 2024
approx. 80% of Venezuelan crude oil exports have gone to China
USD 12 billion the estimated amount of Venezuela’s outstanding loans to China
The U.S. intervention in Venezuela on 3 January 2026 may affect the breakup of the existing Venezuela–Russia–China arrangement. This is consistent with the new U.S. security strategy announced at the end of last year. After three decades(1), the United States is returning to a dominant role in the Latin American region and continues to displace competing states, in this case China and Russia.
For Russia, a disruption of the existing economic cooperation with Venezuela would mean a reduction of influence in the region and risks to investment projects, as well as a potential decrease in profits from exports of this commodity as a result of a further decline in oil prices. Russia’s cooperation with Venezuela was primarily political in nature, and in the economic sphere was limited to the defence and oil sectors(2). Venezuela imported Russian weapons, financing these transactions with loans from Moscow. However, the exact scale of this trade is difficult to determine, as both countries do not publish statistics. Lukoil and Rosneft were among the largest investors in the country, especially in the period before the Chávez presidency (1999-2013), engaging, among other things, in new extraction projects. Russian loans and investments, however, declined after the imposition of U.S. sanctions on Venezuela, and subsequently due to sanctions on Russia following the invasion of Ukraine. The two countries nevertheless cooperated in circumventing them.
China is the largest recipient of Venezuelan oil – approximately 80% of exports of this commodity go to the Chinese market, although the last documented shipment took place in March 2025. Even a complete cutoff of supplies would not, however, constitute a significant burden for China, as Venezuelan crude covers only about 4-5% of the demand of Chinese refineries. Beijing is also – after Russia – one of the two main suppliers of armaments and a key bilateral creditor. Venezuela accounts for approximately 85% of China’s arms exports to Latin America over the past decade, and Chinese banks have extended loans to it totalling USD 106 billion, earmarked, inter alia, for the development of oil infrastructure. A significant part of these obligations was repaid in the form of oil deliveries. It is estimated that approximately USD 12 billion remains outstanding.
Since 2013, that is during the Maduro presidency, China has announced the largest number of planned investments in Venezuela (11 projects). During this period, the cumulative value of foreign direct investment (FDI) in Venezuela declined markedly, while China remained the most important source of FDI. Data from fDi Markets show that announcements of new foreign investments have also virtually disappeared. Since 2013, only 54 new FDI announcements have been recorded in Venezuela, with an estimated value of USD 7.4 billion, the vast majority of which concerned investments in the oil sector and originated from China. Moscow, demonstrating its support for the Maduro regime, ranked fourth in terms of the number of announced projects (6). Some of these investments, however, remained only on paper. For example, the construction of a Kamaz automotive plant announced in 2024 was not implemented.
- The previous armed intervention, the so-called Operation Just Cause, took place in Panama in 1989.
- It consisted primarily in the purchase of Venezuelan oil at prices lower than market prices, its refining and possible resale in exchange for technical support for the oil sector (e.g. supplies of diluents).
Dominik Kopiński, Jan Strzelecki, Katarzyna Sierocińska
The Polish cosmetics market is the growth leader in EU countries
EUR 5.8 billion is the value of the cosmetics market in Poland in 2024
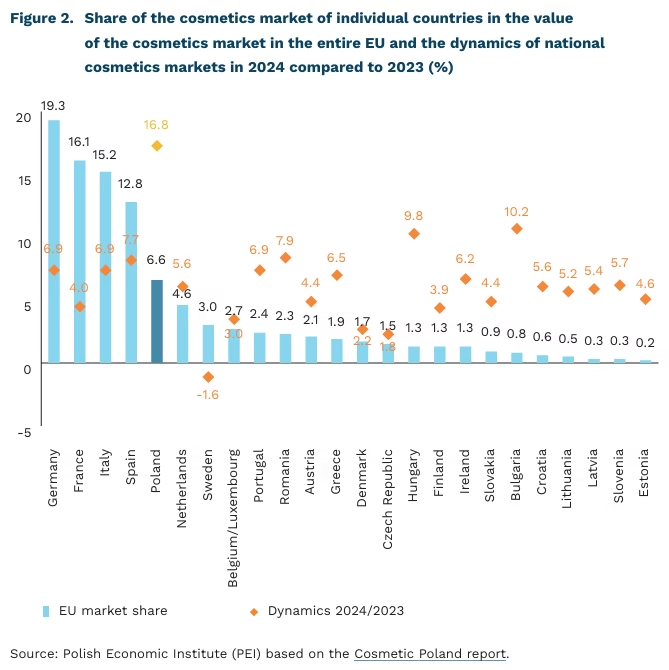
16.8% is the year-on-year growth rate of the cosmetics market value in Poland in 2024
The Polish cosmetics market was worth EUR 5.8 billion in 2024, according to the Cosmetics Poland report. This placed Poland fifth in the total value of the EU cosmetics market. This is the result of cooperation between Polish producers, distributors, and retailers, which form an integrated cosmetics market value chain. The contribution of individual links in this chain to the creation of cosmetics market value varies. In Poland, production has a lower share (45%) than the EU average (54%) in the creation of cosmetics market value. However, retail sales in Poland generate the value of the cosmetics market to a greater extent (29%) than the EU average (21%).
In 2024, the Polish cosmetics market recorded the highest growth dynamics in the entire European Union – 16.8% y/y. Poland overtook not only rapidly developing European markets, such as Bulgaria with 10.2% y/y dynamics and Hungary (9.8%), but also the largest and most mature cosmetics markets – Germany (with 6.9% y/y dynamics), France (4.0%), Italy (6.9%).
In 2024, the value of cosmetics exports reached EUR 6.0 billion, making Poland the f ifth largest exporter of cosmetics in the EU, including the second largest exporter of oral and dental care products, the third largest exporter of toilet soap, and the fourth largest exporter of skincare, manicure and pedicure cosmetics, as well as shaving products, deodorants, and shower gels. It is worth noting that cosmetics exports in the first 10 months of 2025 amounted to nearly EUR 5.5 billion, over 6% more than during the same period of the previous year. This is twice the growth rate of Poland’s total exports (3%).
In 2024, there were 1,320 registered cosmetics companies in Poland, 91% of which were micro-enterprises, according to the Cosmetics Poland report. Nearly three-quarters of the companies are predominantly Polish-owned, generating 45% of the industry’s revenue and 65% of its net profit. Combined, manufacturers, distributors, and retailers employ over 65,000 people.
The development of Polish cosmetics companies is supported by the relatively good financial condition of their businesses, rising incomes, and improved consumer awareness of beauty and health, as well as the development of their own brands and investments in marketing that increase the visibility of Polish brands globally. The competitiveness of domestic companies stems from innovative products with personalized cosmetic solutions, a diverse offering tailored to various market segments (e.g., organic products, dermocosmetics, beauty, skincare, and premium products), and the development of diverse sales channels, including e-commerce.
The cosmetics industry is expected to continue its dynamic growth, although Polish companies will face significant challenges. These include tightening regulations on chemicals and packaging, as well as growing protectionism in global trade. Competing with foreign cosmetics companies with long-standing global recognition will also be difficult.
Urszula Kłosiewicz-Górecka
Photovoltaics and onshore wind covered large part of electricity demand in 2025
26.7% was the average total share of photovoltaic and wind power plants in meeting Poland’s electricity demand in 2025 (calculated in 15-minute intervals)
6.5% was the average relative error of forecasts for electricity production from photovoltaics and onshore wind for the following day in 2025 (weighted by the volume of this production)
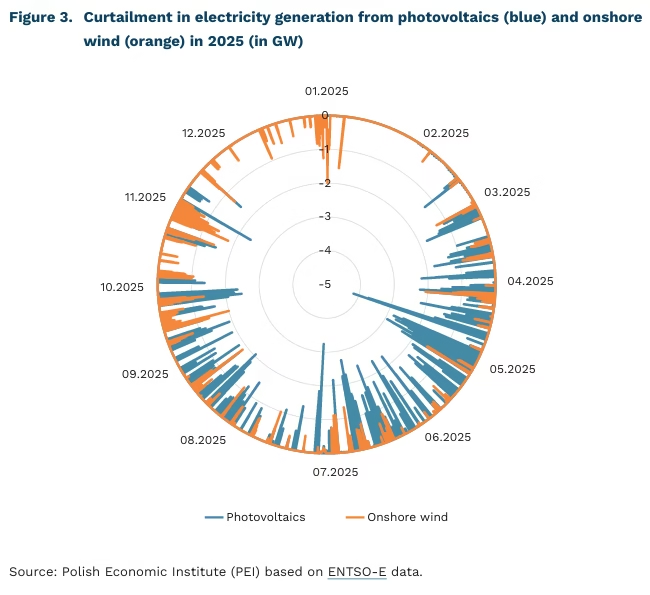
112 MW of photovoltaic capacity was shut down on average due to curtailment of renewable energy production in 2025 (equivalent to one very large PV farm); in the case of wind, an average of 45 MW was shut down (equivalent to 14 onshore wind turbines)
Photovoltaics and onshore wind power had another year with a significant share in meeting Poland’s electricity demand. ENTSO-E data show that in 2025, the average total share of these sources in meeting the electricity demand, calculated in 15-minute periods, was 26.7%. Their maximum share in a single 15-minute period reached 86.5% on the last day of June, accompanied by high electricity exports abroad, which ensured the stability of the power system at that time. The minimum share reached 0.5% at the end of August, illustrating the significant variability of electricity generation from these sources.
Onshore wind covered on average more of the demand than photovoltaics (14.6% compared to 12.1%) and stood out with a lower 15-minute maximum (55.2% compared to 76.6%). Its minimum share was 0.3%, which shows that electricity production from this source fluctuates significantly but never drops to zero.
The data shows that, contrary to opinions appearing in public debate about the unpredictability of electricity production from renewable sources, forecasting errors are minor. The transmission system operator, Polskie Sieci Elektroenergetyczne, recorded more accurate estimates of energy generation for photovoltaics than for onshore wind in 2025. The average relative error, weighted by electricity production volume, reached 5.7% for solar power plants and 7.1% for wind power plants. Taking both sources together, the weighted average error was 6.5%, while its median – insensitive to extreme values – was 5.7%. This proves that even with larger volumes of electricity generation from RES in the future, their underestimation should not pose a challenge for the power system operator, especially with better AI-supported forecasting tools.
The pace of adapting the power system to the new way of operating, which is slower than the increase in renewable energy capacity, means that curtailing electricity production from these sources has become normal. Photovoltaics reach their peak electricity generation at midday, when demand in the system is relatively lower, hence they are characterised by a higher maximum production curtailment (almost 4.2 GW) and its annual average (112 MW) than for onshore wind. Maximum (almost 2.1 GW) and average (45 MW) onshore wind curtailment are not as significant. The averages indicate that limiting energy generation from these sources in 2025 had the same effect as completely shutting down one very large PV farm and 14 wind turbines. The power system usually copes without permanently limiting photovoltaic and onshore wind production (median equal to zero), but in the future, with the progressive increase in the share of RES in the electricity mix, this may change and, paradoxically, become the optimal way for the system to function.
Wojciech Żelisko
Higher education reduces but not eliminates the risk of long-term unemployment
14.7% registered unemployed persons in Poland with obtained tertiary education in November 2025
34% registered unemployed persons with higher education who remained unemployed for more than 12 months in November 2025
43% registered unemployed persons with higher education who remained unemployed for more than 12 months in November 2021
People with higher education still constitute a minority among registered unemployed persons in Poland, accounting for approximately 15%. As shown by the structure of unemployment by level of education, the largest share in the registers is held by people with lower secondary/primary education or below (26%) or lower secondary vocational education (24%), while people with post-secondary non-tertiary and upper secondary vocational education account for 22%, and those with upper secondary general education for 13% of the unemployed. In the longer term, there is a slight increase in the share of people with higher education in the total number of unemployed. While in 2021 they accounted for an average of 13.7% of registered unemployed in individual months, in 2025 this figure was 14.9% on average.
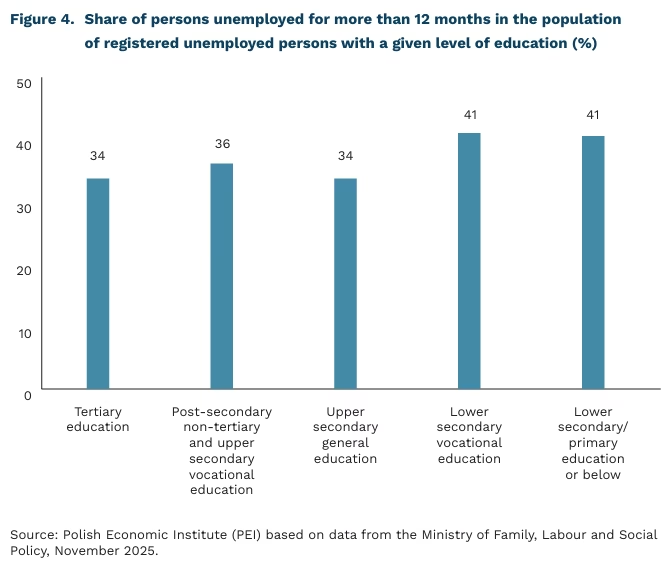
The structure of unemployment by level of education indicates that the risk of longterm unemployment is relatively lower among people with higher education and general secondary education. In November 2025, the share of people who had been unemployed for more than 12 months in these groups of unemployed persons was 34%. The situation is worse among the unemployed with lower secondary vocational education and lower secondary/primary education or below, as the share of long-term unemployed in these groups reached 41%.
Long-term unemployment leads to a gradual loss of skills, making it difficult to compete in a rapidly changing labour market. Long periods of unemployment can also be viewed negatively by employers as a sign of reduced motivation or productivity, further limiting the chances of re-employment. At the same time, long-term unemployment is associated with a deterioration in mental well-being and increased stress levels, creating a self-perpetuating mechanism that hinders active job seeking (OECD, 2025).
Compared to 2021, we see a clear decrease in the share of long-term unemployed people in all education groups. The highest unemployment rates lasting more than 12 months were recorded at that time as a result of disruptions in the labour market caused by the COVID-19 pandemic and restrictions on the functioning of many sectors of the economy. At that time, the percentage of registered unemployed persons with higher education who had been out of work for over a year was 43%. In subsequent years, the share of long-term unemployed persons steadily declined, reaching significantly lower levels in 2025, although still varying according to the level of education.
The above data indicate that higher education still reduces the risk of long-term unemployment to some extent compared to lower levels of education, but as the number of university graduates increases, its protective role may gradually weaken. A slight increase in the share of university graduates in the unemployment registers and a significant percentage of long-term unemployed signal the need to better adapt the education system to the changing needs of the labour market and to place greater emphasis on updating skills throughout one’s professional career.
Dominika Prudło
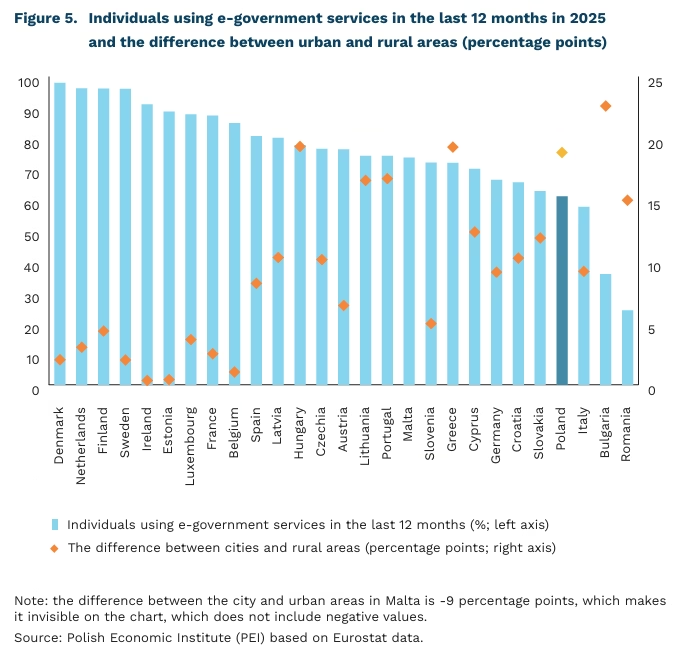
E-government in Poland in 2025. Urban-rural differences and the generation gap
61% is the percentage of people using public administration services online in Poland.
98% is the percentage of people using public administration services online in Denmark.
19 percentage points is the difference in the percentage of people using e-government services living in cities and rural areas in Poland
Compared to other EU countries, Poland in 2025 remains in the lower part of the ranking in terms of the share of people using public administration services online. Over the last 12 months, 61% of people in Poland have used e-government services online, which places our country among the lowest performers in the EU. This low rate may be due to overlapping barriers.
Northern European countries have the highest scores in terms of e-government usage. In Denmark, the Netherlands, Finland, and Sweden, 96% or more of the population has used online public administration services in the last 12 months. At the other end of the scale are the countries of south-eastern Europe – Romania and Bulgaria – where the figures are 24% and 36% of the population, respectively. The chart also shows that Poland’s low score is accompanied by significant regional differences. The difference in the percentage of people using e-government between urban and rural areas in Poland is 19 percentage points, which is significantly greater than in countries with the highest adoption of e-government, where the gap is symbolic. At the same time, Poland is not an exception in this category – particularly large gaps between urban and rural areas can also be seen in Bulgaria, Greece, and Hungary, among others.
Another factor reducing the overall use of e-government may be differences between countries in terms of specific age groups. In Poland, 82% of people aged 25-34, 70% aged 45-54, 51% aged 55-64, and only 28% aged 65-74 used public administration services via the Internet. In the oldest of these groups, 97% of people in Denmark, 95% in the Netherlands, and 91% in Sweden used e-government in 2025. On the other hand, only 33% of people in Greece, 32% in Croatia, 12% in Bulgaria, and only 8% of the population in Romania. At the same time, the level of education may have an impact on these results. Among the seven countries with the lowest overall percentage of people using e-government, as many as six in 2024 had a percentage of people with higher education below the EU average in the 30-54 age cohort (the exception was Poland, which was above the EU average) and in the 55-74 age cohort (the exception was Germany, also above the EU average).
The results presented indicate that the relatively low level of e-government use in Poland is not solely a matter of the overall digitization of public services, but is largely due to overlapping barriers related to place of residence, age, and level of education. In one of the PEI Economic Weekly, we also presented significant differences in digital skills between urban and rural areas in Poland, which indicate another barrier to the use of public administration services online. As a result, improving Poland’s score requires measures that will simultaneously increase the accessibility and usability of e-services outside large centers and lower the entry threshold for groups less inclined to use digital channels, primarily the elderly and rural residents. Failure to make greater efforts in this direction will negate efforts to improve the use of e-government services in the country.
Filip Leśniewicz
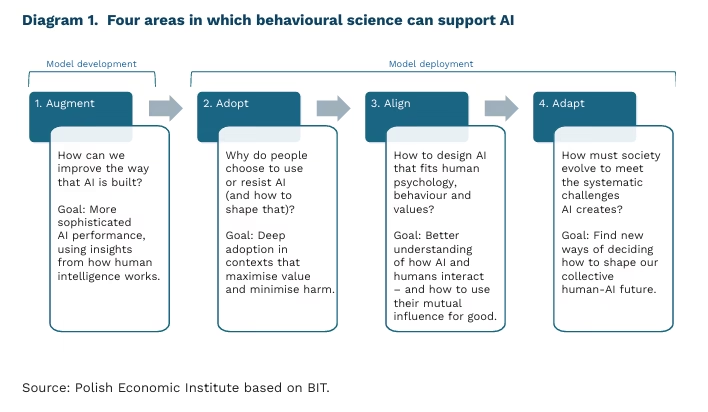
Behavioural science can support AI
The success of AI technologies should not be measured solely in terms of processing power, but also by how well it integrates with the complexities of human behaviour, researchers from the Behavioural Insights Team (BIT)(3) argue. They identify four key areas in which behavioural science can support AI: (1) augmenting AI by infusing behavioural intelligence into LLMs; (2) enabling effective adoption; (3) aligning AI with humans and their responses; and (4) supporting social adaptation.
Behavioural science can be used in the development of AI models. Traditional large language models function in a similar way to System 1 – an intuitive, fast mode of thinking, often based on associations. Such tools are highly effective at recognising patterns, but are also prone to simplifications. In humans, the “fast” system is complemented by System 2 – slower, analytical and reflective(4). AI models may be equipped with a mechanism similar to System 2, enabling them to decide when rapid inference is sufficient and when deeper analysis is required – a “metacognitive controller” that manages different reasoning strategies.
For AI tools to deliver the expected benefits, they must be widely and broadly adopted – expanding their use is a classic behavioural challenge. Currently, AI is often used for quick, simple tasks, which familiarizes users with the technology but offers limited value in achieving long-term goals such as increasing productivity or reducing administrative burdens. Three factors are crucial for expanding adoption: motivation, skills, and trust. Barriers along this path often stem from issues identified by behavioural science, such as status quo bias – resistance to changing the current state.
Thanks to research in behavioural science, AI systems can be designed to respect users’ preferences and values and not undermine their wellbeing. This is particularly important because language models can be highly persuasive. As a result, they may influence changes in opinions – for example on socio-economic issues – as shown by PIE research. There is also a risk that AI will become a powerful tool for deliberate manipulation – for instance in cases of financial fraud.
AI is not only a technological change, but also a profound social transformation. Researchers from BIT point to three key principles that should guide the design and deployment of AI for the common good. First, it is necessary to consciously shape norms of human–AI interaction. Anthropomorphization and the uncritical delegation of decisions to machines should be avoided, and care should be taken to ensure that AI supports rather than weakens human capabilities. Second, the impact of AI on interpersonal relationships should be consciously managed so that technologies do not replace social bonds. Third, the future of relations between humans and artificial intelligence should be shaped deliberately and in a participatory manner, rather than allowing such norms to develop in a spontaneous and uncontrolled way.
3. BIT is a UK-based team of experts that focuses on applying behavioural science to improve decision-making and the effectiveness of public policies. Behavioural science is an interdisciplinary field that examines how people make decisions and which factors influence their behaviour.
4. More information on System 1 and System 2 can be found in Daniel Kahneman’s book Thinking, Fast and Slow.
Iga Rozbicka
Trump vs. the Fed: the effects of political pressure on central bank independence
approx. 0.5% decline in S&P 500 futures following the 11 Jan 2026 statement
approx. 0.6% decline in Nasdaq futures following the 11 Jan 2026 statement
Political pressure that weakens central bank independence undermines conditions for economic growth. Financial markets reacted negatively to the escalation of tensions. S&P 500 futures fell by around 0.5%, and Nasdaq futures by around 0.6%. Gold reached a record level of about USD 4,600 per ounce and rose by more than 1.5% intraday, while silver increased by around 5%. If political pressure to cut interest rates intensifies, markets may view it increasingly unfavorably. As a result, Donald Trump’s actions may produce the opposite effect to what is intended, as they increase uncertainty in the markets.
The nature of central bank independence has once again become a subject of public debate due to Donald Trump’s current pressure on the Federal Reserve. The U.S. President expects interest rate cuts. In his view, monetary policy is excessively restrictive, which negatively affects economic growth. According to Trump, an easing of monetary policy would contribute to a rebound and also increase the competitiveness of U.S. exports.
Trump’s pressure was already visible during his first term. Donald Trump repeatedly criticized Federal Reserve decisions and, beyond sharp media statements, also attempted to influence the Fed’s personnel composition. In his second term, the conflict has escalated again. The criticism has expanded not only to the decisions themselves, but also to the rationale for the Federal Reserve itself.
Jerome Powell, the Fed Chair, has faced intensified pressure. In connection with his testimony before a Senate committee on 25 June 2025 regarding a USD 2.5 billion building renovation, Trump has raised this issue, accusing Powell of mismanagement. On 11 January 2026, Powell confirmed that the Fed had received subpoenas related to his June testimony on the renovation, and that the threat of charges is being used as an element of political pressure. It is worth noting that Powell is currently serving a second term, which ends in May 2026.
The dispute between Trump and the Fed is of particular significance because the U.S. economy is a key link in the international system of economic interconnections. While in the case of a smaller economy a crisis might translate into the global situation only to a limited extent, in the case of the United States – given its scale, extensive financial linkages, and the role of the dollar – disruptions to confidence can generate tensions across many markets at the same time. In practice, a crisis in the U.S. often means a crisis of global proportions.
Jakub Kubiczek