Economic Weekly 24/2026, June 19, 2026
Published: 19/06/2026
Table of contents
Poland has nearly exhausted its export-diversification potential
0.06 the product-concentration index of Polish exports – the lowest among 219 economies
259 of 261 SITC commodity groups are covered by Polish exports
26.9% was Germany’s share of Polish goods exports in 2025
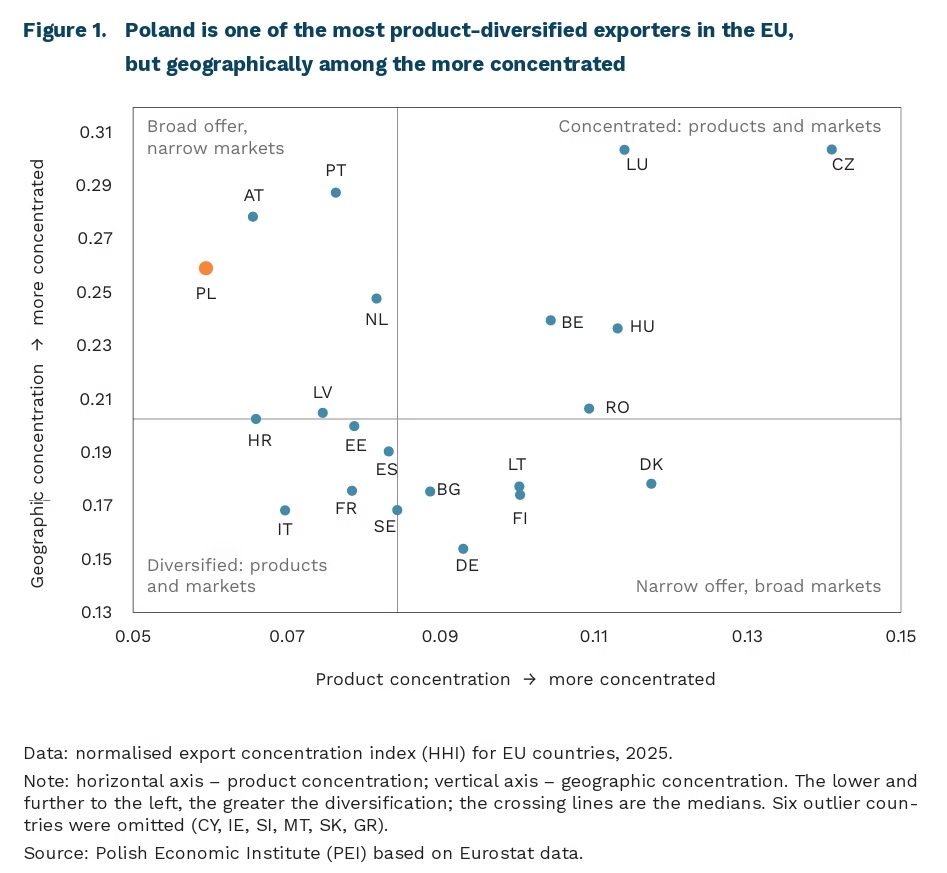
Poland has the most product-diversified export basket in the world. The UNCTAD concentration index – a normalised Herfindahl-Hirschman index that ranges from 0 under full diversity to 1 when all exports rest on a single product – stood at 0.06 for Poland in 2024, the lowest value among 219 economies. New calculations on data available for the EU alone show that Poland remained the EU leader in 2025. The result does not depend on the level of data granularity: Poland leads both when exports are split into 261 commodity groups and when they are broken down into more than 3,000 five-digit categories. Differences within the region are pronounced – export concentration in automotive-dependent Slovakia is more than four times higher (0.25 vs. 0.06), and in Czechia more than twice as high (0.14).
Underlying this result is an export basket that is now not only broad but also exceptionally even. The number of products barely changes – already in 2005 Poland exported 256 of 261 commodity groups (SITC-3), much as in 2025. What has changed is the distribution across products: the share of the single largest product fell from 6.0% of exports in 2005 to 2.6% in 2025, and covering 90% of export value today requires roughly 625 products (SITC-5), against fewer than 580 two decades ago. Progress in diversification is therefore the result of an increasingly even spread of exports rather than a broadening of the offer.
The variety of the basket does not, however, translate into its complexity. The Economic Complexity Index (ECI) considers not only how many different products a country exports but also how rare they are – how few other economies manage to make them. On this measure Poland fares markedly worse: in 2024 it ranked 26th in the world, lower than in 2018 (22nd), and sat mid-table within the EU. At the top of the ranking, by contrast, are exporters of electronics, pharmaceuticals and precision instruments, whose baskets are narrower but technologically more sophisticated. The distinction has practical significance: future economic growth is better signalled by complexity than by the sheer number of products.
The resilience that diversification provides also depends on its second dimension – the geographic structure of exports. Here Polish exports remain concentrated: around 75% of their value goes to the EU internal market and 26.9% to Germany alone – to a degree typical of a regional economy tightly integrated with the Union.
A broad and even basket shielded exports from a collapse in any single industry and supported catching up in development. The scope for broadening it further, however, is limited: diversity rises with development only up to a certain threshold, beyond which economies begin to re-specialise. Most advanced exporters have already passed this point – Italy and Austria in 2009, Japan in 2011, and South Korea in 2001. The number of exported products is almost exhausted, while exports themselves already reach half of GDP [1]. Future gains for Poland will come not from increasing the number of exported goods but from raising their complexity. For Poland this means moving up the value chain in industries where it is already strong, such as automotive and electronics.
- Exports of goods and services account for about 52% of Poland’s GDP (2024), above the EU average (50%) though below the region’s most open economies (Slovakia – 85%, the Netherlands – 82%, Czechia – 69%); the ratio has stabilised since 2020. Poland is thereby more trade-open than Italy (22%), Japan (15%) or South Korea (31%) were when they began to re-specialise.
Aleksandra Sojka
Poles are increasingly living alone
15.5 million the number of households in Poland in 2025
35% of all households in Poland were single-person households in 2025
25% of all households in Poland had children in 2025
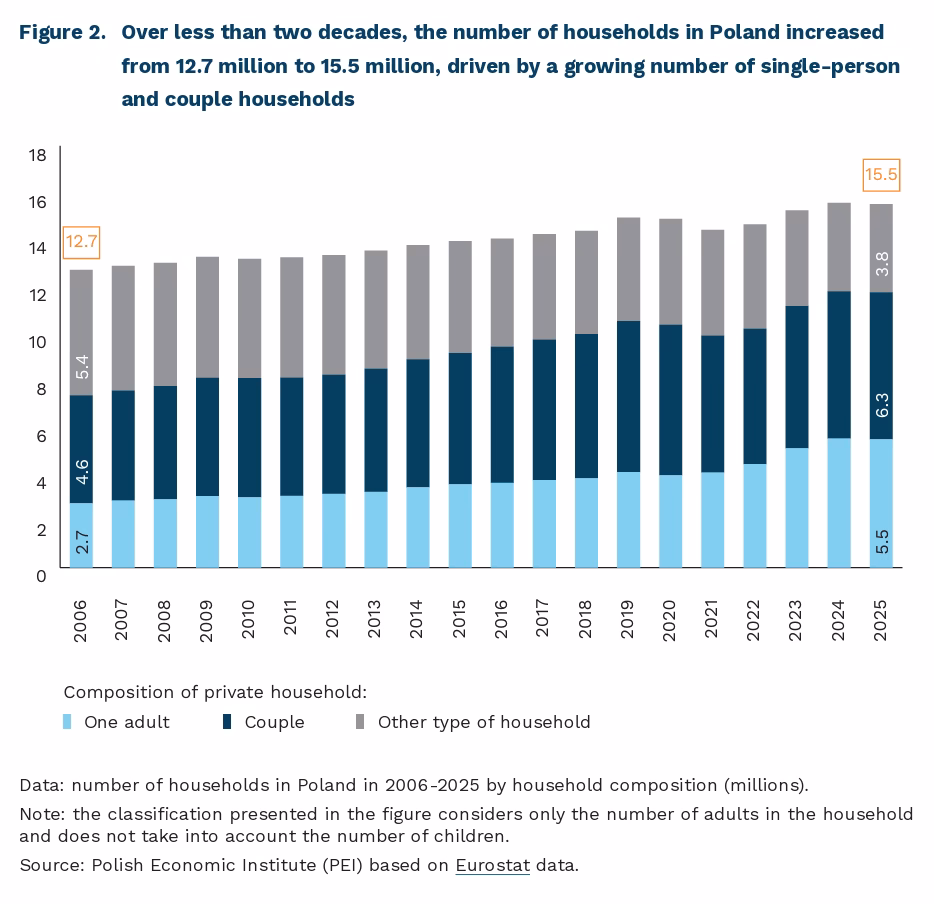
Although Poland’s population is declining, the number of households continues to grow. According to Eurostat, a household consists of an adult person or a group of adults living in the same dwelling (not necessarily related), who share resources, expenses and daily needs. Between 2006 and 2025, the number of households in Poland increased from 12.7 million to 15.5 million.
The structure of households has shifted primarily towards single-person households and couple households (in both cases regardless of the number of children). In 2025, single-person households accounted for 35% of all households (up from 22% in 2006), while couples represented 40% (compared with 36% in 2006). At the same time, the share of other household types fell by almost half, from 42% to 24%. These include households composed of at least two adults who are not a couple, as well as households with more than two adult members.
The number of households with children has declined markedly. In 2006, children were present in 37% of households, compared with only 25% in 2025. The distribution of households by number of children has nevertheless remained relatively stable. Throughout the period, households with one child were the most common, accounting for 52% of households with children in 2006 and 51% in 2025. The share of households with two children increased slightly (from 34% to 38%), while the share of households with three or more children declined (from 14% to 10%).
Multigenerational households, where older people and children live together, have become less common. In 2006, 15% of people aged 65 and over lived in a household with children; today, this figure has fallen to just 6%. By comparison, across the EU only 3% of people aged 65+ live in households with children.
Young people are increasingly forming separate households, either on their own or with a partner. Among people aged 18-24, the share living alone increased from 3.5% to 9% over the period analysed, while the share living as a couple rose from 6% to 11%. For comparison, across the EU in 2025, 12% of people aged 18-24 lived alone and 7% lived as a couple. As discussed in one of PEI’s Economic Weekly reports, young Europeans continue to face significant housing barriers. Poland remains among the EU countries with the highest levels of housing overcrowding, a situation in which the number of occupants is too high relative to the available living space. Growing aspirations for residential independence are colliding with limited access to adequate housing.
These trends are likely to continue, creating increasing challenges for public policy. They are partly the result of cultural change and growing aspirations for independence, and partly a consequence of long-term demographic processes, including migration, rising life expectancy and declining fertility. Reduced co-residence weakens informal family support networks, both for families raising children and for older people requiring care. As a result, a growing share of caregiving responsibilities is likely to shift from families to public institutions and the market for care services. At the same time, the growing demand for residential independence will place increasing pressure on housing policy to facilitate the creation of independent households among young adults.
Iga Rozbicka
In 10 years, data centers in the EU will need nearly twice as much energy as the entire Polish economy
2.5 to 5 times the factor by which EU data center capacity could increase by 2035
11% the possible share of data center demand in Poland’s total electricity demand in 2040, according to PSE
up to 408 TWh of electricity per year will be consumed by EU data centers by 2035
One of the goals of the Sovereignty Package presented by the European Commission is to support the development of data centers in the European Union. In the first pillar of the Strategic Roadmap for the Digitalization and AI of the Energy Sector, the European Commission sets out actions related to ensuring energy supply for data centers. The proposed changes include creating a framework for flexible connection agreements, moving away from the “first-come, first-served” principle, and introducing an EU rating scheme for data centers. The latter will cover energy efficiency, water efficiency, clean energy use, waste-heat reuse and flexibility, as well as launching the process of establishing minimum EU energy performance standards.
The need to develop data centers is also addressed by the Cloud and AI Development Act (CADA). Under Article 10, Member States should designate at least one data center acceleration zone on their territory, taking into account, among other things, network connectivity capacity, available and future power grid capacity, the use of low-carbon energy, and a preference for reusing brownfield sites.
According to the International Energy Agency (IEA), in 2025 global data center energy demand grew by 17%, and that of data centers focused on AI models by 50%, relative to 2024. Intense growth is also to be expected in the following years. The IEA’s base-case forecast assumes that energy demand will rise from the current 485 TWh to 950 TWh in 2030 and over 1,200 TWh by 2035.
In 2025, the total capacity of data centers in the EU was 12.4 GW (13.9 GW including public-sector data centers). According to the forecasts in the CADA impact assessment, this figure will reach between 31 GW (in the low scenario) and as much as 60 GW (in the high scenario) in 2035. This translates into an increase in electricity demand from the current ~100 TWh to between 314 TWh [2] (in the base scenario) and 408 TWh per year in 2036 [3]. This is more than twice Poland’s entire current annual demand (167.5 TWh) and nearly double the demand forecast by polish transmission system operator Polskie Sieci Elektroenergetyczne (PSE) for 2036 (230 TWh).
In 2025, 200 GW combined capacity of data centers were located in Poland. According to the PLDCA (Polish Data Center Association), mapping the planned and already-initiated investments of the largest providers points to exceeding the 500 MW threshold by 2030, which is, merely 1.8% of the EU-wide demand forecast by the European Commission (28 GW in the base scenario). More than 60% of Poland’s total commercial server space is located in Warsaw, and according to the PLDCA this share may increase by 2030. According to PSE’s forecasts, in 2036 data centers could consume nearly 17 TWh per year (7% of Poland’s total demand) and 29 TWh in 2040 (11% of Poland’s total demand).
In light of the recommendations of Article 10 of CADA, an advisable course of action could be to develop data centers in southern Poland (especially in regions covered by the just transition) or in the north, where most of the newly built capacity will be located (led by nuclear power and offshore). At the same time, the expansion of data centers in Poland is yet another burden on the power system, which in the first half of the 2030s may struggle with a generation gap arising from the decommissioning of some coal-fired power plants before new wind and nuclear capacity comes online. In light of the Commission’s new recommendations, the dynamic growth of data centers may be a further argument not only for accelerating the development of renewables and gas-fired power plants, but also for the Commission’s extension of derogations for older coal-fired power plants.
2. The expansion (build-out) scenarios do not map one-to-one onto the range of electricity-demand scenarios, because the latter take into account a larger number of factors, such as differing improvements in data centre efficiency.
3. Data on data centre development forecasts: page 44, based on the forecast by Technopolis et al. Data on electricity demand: pages 161-162.
Adam Juszczak
Open-source software is becoming a part of Europe’s digital sovereignty
92.4% of the public administration entities surveyed in Poland use Microsoft office suites
5 countries are currently members of the Digital Commons Consortium for European Digital Infrastructure
41.8% of the surveyed public administration entities in Poland that use Microsoft office suites are taking into account the implementation of open-source software
The Polish public administration relies heavily on Microsoft products, according to a new study conducted by the Ministry of Digital Affairs and the Centre for Information Technology [4]. As many as 92.4% of the surveyed Polish public administration entities (both central and local government) use Microsoft office software suites, and 46.5% use email services provided by Microsoft.
The use of software controlled by entities outside our jurisdiction, however, carries certain risks, including those related to access to sensitive data. Emerging legal opinions on U.S. regulations (including the Cloud Act), as well as statements by representatives of U.S. companies themselves, indicate that, in the event of a justified request from U.S. authorities, companies are legally obligated to hand over foreign users’ data to U.S. agencies. In response to growing concerns among European users, companies are striving to reassure their customers about the security of their solutions and the processing of data on servers located in the European Union.
Growing European awareness of dependence on U.S. technology providers and a desire to support local solutions are driving the development and implementation of European and open-source software in public administrations. The German state of Schleswig-Holstein has become a pioneer in this regard, having migrated the work of tens of thousands of public servants to open-source software, including switching operating systems to Linux. Efforts toward digital resilience are underway simultaneously in many countries; for example, the openDesk office suite is being developed in Germany, and LaSuite in France. The adoption of open-source software by the public sector is also supported by the new European Open Source Strategy, which is part of the Tech Sovereignty package. According to the regulatory impact assessment, such measures can also yield measurable budget savings.
However, independent software development by each interested Member State is not the optimal approach. For this reason, five EU Member States (France, the Netherlands, Luxembourg, Germany, and Italy) are jointly establishing the European Digital Infrastructure Consortium for digital commons, which aims to build a European community and secure funding for the development of open-source software. Poland participates in the Consortium as an observer, along with six other interested EU countries and regions.
Among the surveyed Polish government agencies that reported current use of Microsoft office software, 41.8% indicated that they are open to implementing open-source software under the right conditions. Support for the use of open-source software by public administration is included in Poland’s National Digitalization Strategy. The Ministry of Digital Affairs has also recently launched consultations on the guidelines for a tender for pilot implementations of open-source office software in local government units. The consultations are approaching the issue from the ground up, starting with establishing an appropriate definition of open-source software.
Europe’s pursuit of digital sovereignty through the development of independent software appears to be a promising solution on many levels – it combines independence from the influence of non-European entities, subjection to local jurisdiction, and the development of software development and maintenance capabilities. At the same time, it is important to recognize that developing software independently is a more challenging path, one that shifts costs from license purchases to the ongoing maintenance and development of one’s own ecosystem. Meanwhile, for the largest non-European providers, the EU market is too lucrative to simply “let go” of. They are therefore modifying their offerings in an attempt to align with the trend toward “sovereign” services, taking into account both data localization and access control.
Jakub Witczak
Public procurement as a tool for achieving the EU’s strategic objectives
in 2022, European providers accounted for 15% of cloud solutions supplied to European organisations
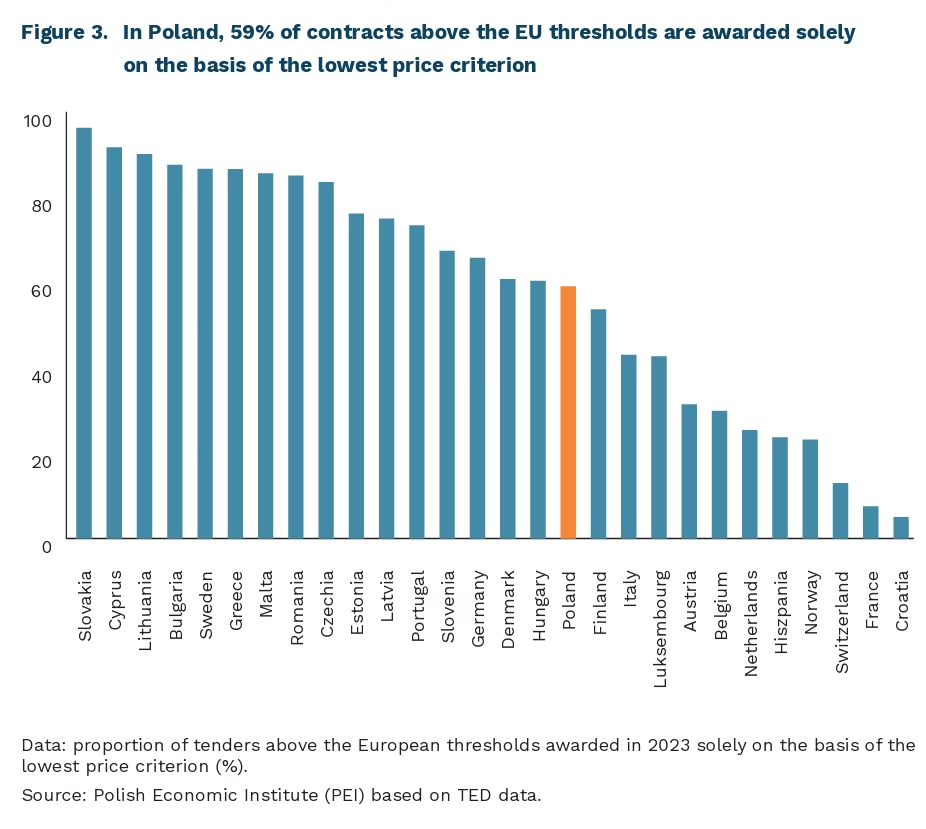
in 2023, 59% of Polish tenders above the EU thresholds were awarded solely on the basis of the lowest price criterion
Public procurement is increasingly recognised as a tool of European industrial policy. Successive proposals for EU legislation emphasise the need for public contracting authorities to make greater use of non-price criteria in the procurement process. The Net Zero Industry Act (NZIA), concerning zero-emission technologies, introduces preferences for supplies offering European added value in situations where the EU is dependent on a single supplier of a given technology. Meanwhile, the proposed Industrial Accelerator Act introduces two non-price criteria – EU origin (‘Made in Europe’) and a zero-emissions criterion – for procurement in energy-intensive industries, the automotive sector and zero-emission technologies. The proposal for the Cloud and AI Development Act (CADA), announced in June this year, provides for the inclusion of the share of European added value as an additional qualitative criterion to be taken into account when evaluating tenders. However, the obligation to apply this criterion applies only to contracts for innovative cloud services and AI systems. At the same time, the Commission has announced a review of the EU public procurement framework, including a focus on giving greater weight to non-price criteria in procurement.
The growing emphasis on European contracting authorities taking non-price criteria into account is intended to help achieve the European Union’s strategic objectives. These objectives include reducing the European economy’s dependence on non-European suppliers in areas critical to Europe’s security and building the competitiveness of its economy. The existence of this dependency is highlighted, amongst other things, by the fact that the share of European suppliers of cloud solutions to European organisations fell from 29% in 2017 to 15% in 2022. This raises concerns about the dependence of the European public sector and economy on suppliers subject to foreign jurisdictions. The real scale of this threat is confirmed by the unilateral restriction introduced by the US government on 12 June, limiting the availability of Anthropic’s most advanced LLM models to entities outside the United States. Meanwhile, in the field of carbon-neutral technologies, China currently controls 80% of global photovoltaic module production and 85% of global battery production.
Achieving the aforementioned objectives through the public procurement mechanism may face two main obstacles. Firstly, it is argued that giving greater weight to non-price criteria in public procurement could lead to higher prices for contracting authorities and place an excessive burden on public budgets. Secondly, attention is drawn to the reluctance of public contracting authorities to apply non-price criteria, which are perceived as less objective and, at the same time, more risky. This approach stems from contracting
Paula Kukołowicz
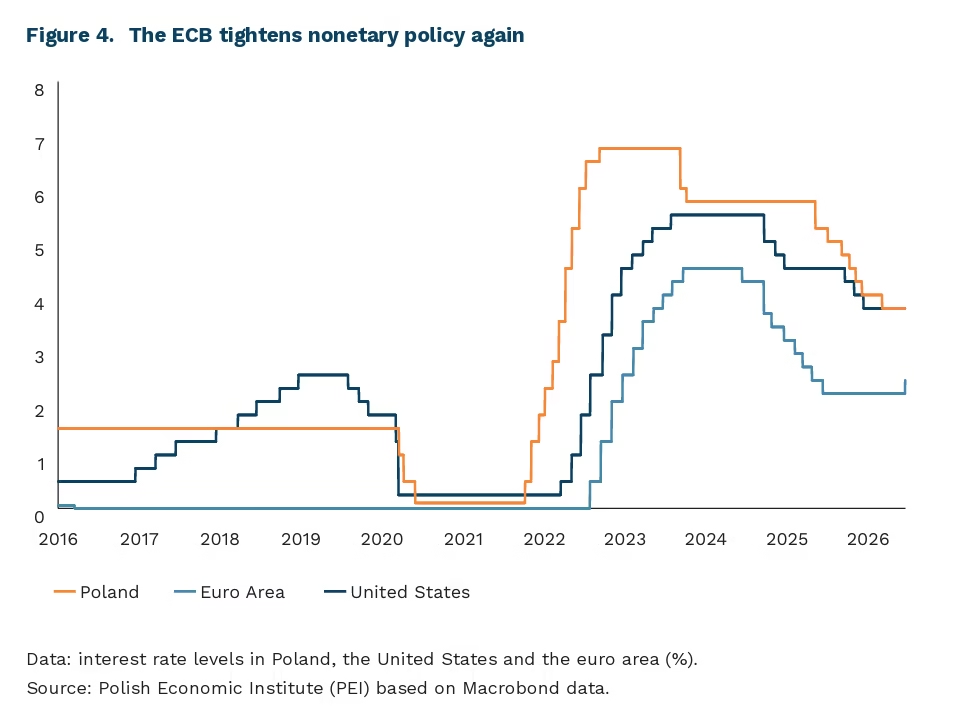
In response to the energy shock, the ECB raises interest rates for the first time since 2023
25 bp this was the scale of the ECB interest rate hike on 11 June, the first increase since September 2023
3.0% this is the projected average inflation rate in the euro area in 2026, compared with 2.6% in the March projection, according to the ECB’s new projections
The European Central Bank (ECB) raised interest rates by 25 basis points for the first time in more than two years. The deposit facility rate increased from 2.00% to 2.25%, the main refinancing operations rate from 2.15% to 2.40%, and the marginal lending facility rate from 2.40% to 2.65%. Christine Lagarde rejected the description of the decision as an “insurance hike”. As she said: “this is not an interest rate decision taken as an insurance policy, but simply a good decision from the point of view of monetary policy.”
The rate hike was motivated by rising inflation and its increasingly visible spillover beyond energy prices. HICP inflation in the euro area rose to 3.2% in May 2026, the highest level since September 2023, while services inflation accelerated to 3.5% from 3.0% a month earlier. Core inflation, excluding energy and food, increased to 2.5% from 2.2%. The ECB revised its inflation projection for 2026 from 2.6% to 3.0%, and for 2027 from 2.0% to 2.3%. At the same time, it lowered its GDP growth projection from 0.9% to 0.8% in 2026 and from 1.3% to 1.2% in 2027.
The ECB rate hike will increase the cost of financing in EUR, but its impact will be uneven. Variable-rate loans and new liabilities taken on by companies and households will feel the effect most quickly. In the euro area, this applies especially to countries where a large share of mortgages is linked to money market rates such as Euribor. Higher interest rates will also increase the cost of debt issuance for companies and governments, although the scale of the effect will depend on the maturity of debt and the structure of interest rates. In Poland, the direct impact on households will be limited, as the domestic mortgage market is based mainly on financing in PLN. More important transmission channels include higher costs of EUR-denominated corporate debt, more expensive servicing of eurobonds, and a weaker PLN through the impact of the ECB decision on the EUR/PLN exchange rate.
Some central banks are moving in the same direction in response to the commodity shock. On 16 June, the Bank of Japan raised its interest rate from 0.75% to 1.00%, the highest level since 1995. Bank Indonesia raised its reference rate from 5.25% to 5.50% at an extraordinary meeting on 9 June, defending the rupiah against further depreciation. At its first meeting under new Chair Kevin Warsh on 16-17 June, the Fed will probably keep rates in the 3.50-3.75% range, despite US CPI inflation of 4.2%, the highest since 2023. We wrote about monetary tensions in the US in the PEI Economic Weekly. The common denominator behind these decisions is the energy shock following the war in the Middle East, whose effects persist and are likely to continue, despite the recent peace agreement between the US and Iran.
In Poland, the Monetary Policy Council remains closer to a scenario of stable interest rates than rate hikes. Some Council members have signalled that the probability of changes in interest rates by the end of 2026, or even by Q1 2027, is low. This approach reflects both the assessment of domestic data and the improvement in the oil market. CPI inflation fell to 3.1% y/y in May, while the market had feared a much higher reading of 3.7%. At the same time, the prospect of a lasting agreement between the US and Iran pushed Brent oil prices down to around USD 80 per barrel, from levels above USD 100 in previous weeks. This means that part of the external cost shock may fade faster than assumed back in May. In this environment, keeping interest rates at 3.75% reduces the risk of a premature response to a temporary supply shock, while still leaving the NBP reference rate 150 basis points above the ECB deposit rate.
Sebastian Sajnóg
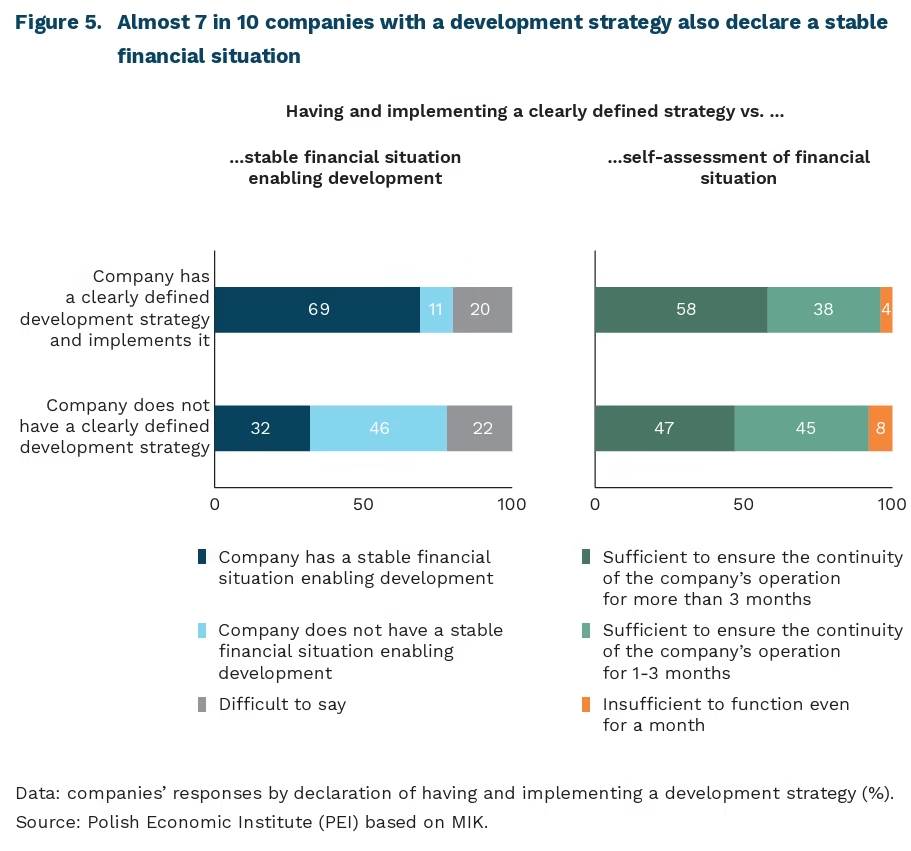
Companies with a development strategy are more likely to have stable finances and larger reserves
73% of surveyed companies agree with the statement that they have a clearly defined development strategy and are consistently implementing it
59% of firms have a stable financial situation that enables their development
69% of enterprises that have and implement a strategy declare a stable financial situation that enables development
Nearly 75% of surveyed companies agree with the statement that they have a clearly defined development strategy and are consistently implementing it, according to the June Monthly Business Climate Index (MIK) survey. The share of firms agreeing with this statement increases with company size. A clearly defined strategy and its implementation are confirmed by 86% of large firms compared with 69% of micro enterprises. Service companies (82%) and manufacturing companies (77%) are more likely to agree with the statement on having and implementing a strategy than enterprises in the TSL sector (63%). These opinions confirm earlier observations that, despite an uncertain economic environment, companies are trying to plan their activities beyond day-to-day operations.
At the same time, 59% of surveyed firms indicate that they have a stable financial situation enabling development. Here, too, large companies indicate financial stability more often than microenterprises (72% vs. 51%). It is also more frequently reported by service firms than by manufacturing companies (65% vs. 52%).
Among companies declaring that they have a clearly defined development strategy and implement it, as many as 68% also have a stable financial situation that enables further development. By comparison, among enterprises that do not have a strategy and/or do not implement it, this share is more than twice as low (32%). This indicates a relationship between having and implementing a development strategy and the company’s financial condition. A stable financial situation enabling development does not necessarily mean having large financial reserves. Among companies that have and implement a strategy, 58% declare that they have sufficient funds to maintain business continuity for more than three months. Among firms without a clearly defined strategy, this share is lower, at 47%. Some enterprises may assess their financial condition positively due to current revenues, order books, profitability or access to financing, even if their available funds would allow them to continue operating for only 1-3 months.
The survey results do not allow us to state clearly whether strategy leads to an improvement in the financial situation, or whether a better economic condition makes it easier for a company to develop and implement growth plans. However, it can be assumed that these mechanisms influence each other. Enterprises with a more stable financial situation have greater capacity to plan investments, develop new products, expand into new markets and build reserves in case of an economic downturn. In turn, a clearly defined and implemented strategy supports better risk management, stronger cost control and more effective use of available resources. Strategy can function not only as a development plan, but also as a tool for building business resilience. In conditions in which uncertainty about the economic situation was a barrier for more than half of surveyed companies (58%), this approach fits into the concept of dynamic capabilities, according to which competitive advantage is built by companies able to integrate and reconfigure resources in response to changes in the environment.
Aleksandra Wejt-Knyżewska