
Economic Weekly 28/2026, July 17, 2026
Published: 17/07/2026
Table of contents
Students in regional capitals achieved better school-leaving examination results than those in smaller towns and cities
7.38 points higher in the basic-level English examination than students in counties outside regional capitals
6.31 points higher in the basic-level mathematics examination than students in counties outside regional capitals
4.02 points higher in the basic-level Polish examination than students in counties outside regional capitals
This year, 81.1% of all students passed the school-leaving examination. The pass rate was 85.9% among graduates of general secondary schools and 71.3% among graduates of technical secondary schools. The mathematics examination was passed by 86% of students, the Polish examination by 94%, and the English examination by 95%.
The school-leaving examination results reveal differences between students attending schools in regional capitals and those studying in other locations [1]. On average, students in regional capitals scored 7.38 points higher in English than students in counties outside regional capitals. The difference amounted to 6.31 points in mathematics and 4.02 points in Polish [2]. A similar pattern was observed one, two and three years ago. In each of those years, English exam was the one with the largest difference in average results between students from major cities and those from other locations.
The fact that English is the subject associated with the largest disparities between major cities and smaller towns may be attributable to several factors. Larger cities may offer easier access to private tutoring, while English is also likely to be chosen more often for extracurricular classes. Proficiency in English is more commonly perceived as useful in everyday life, for example as a component of human capital or a skill required in the labour market, than knowledge of other school-leaving examination subjects. The differences may also result from greater access to English-language cultural content in larger cities, for example through cinemas and libraries, more frequent contact with foreigners, or differences in parents’ cultural capital.
The largest observed differences concerned the mathematics examination in the Lower Silesian (Dolnośląskie) Voivodeship. Students in Wrocław scored, on average, 11.1 points more than students in the remaining counties of the voivodeship. In the English examination, the largest gap was recorded in the Masovian (Mazowieckie) Voivodeship and amounted to 10.5 points. Only in the Polish examination did students outside regional capitals achieve marginally better results than those taking the examination in regional capitals. This was the case in the Greater Poland (Wielkopolskie) and Silesian (Śląskie) voivodeships.
The largest difference in the overall school-leaving examination pass rate was recorded in the Opolskie Voivodeship, where the gap between the regional capital Opole and the remaining counties amounted to 10.95 percentage points. Greater Poland (Wielkopolskie) was the only region in which the difference ran in the opposite direction. The proportion of students attending schools in regional capital Poznań who passed the school-leaving examination was 1.64 percentage points lower than in the remaining counties of the voivodeship.
Regional inequalities in the education system may have many causes, including greater access to private tutoring in larger cities. However, substantial differences in educational outcomes between major cities and smaller towns are a serious concern. Such disparities threaten equality of opportunity in education, as young people have no influence over where they are born or where they live, while moving away from the family home for educational purposes is not always possible or desirable. As a result, these differences may affect young people’s future careers and contribute to widening socio-economic inequalities.
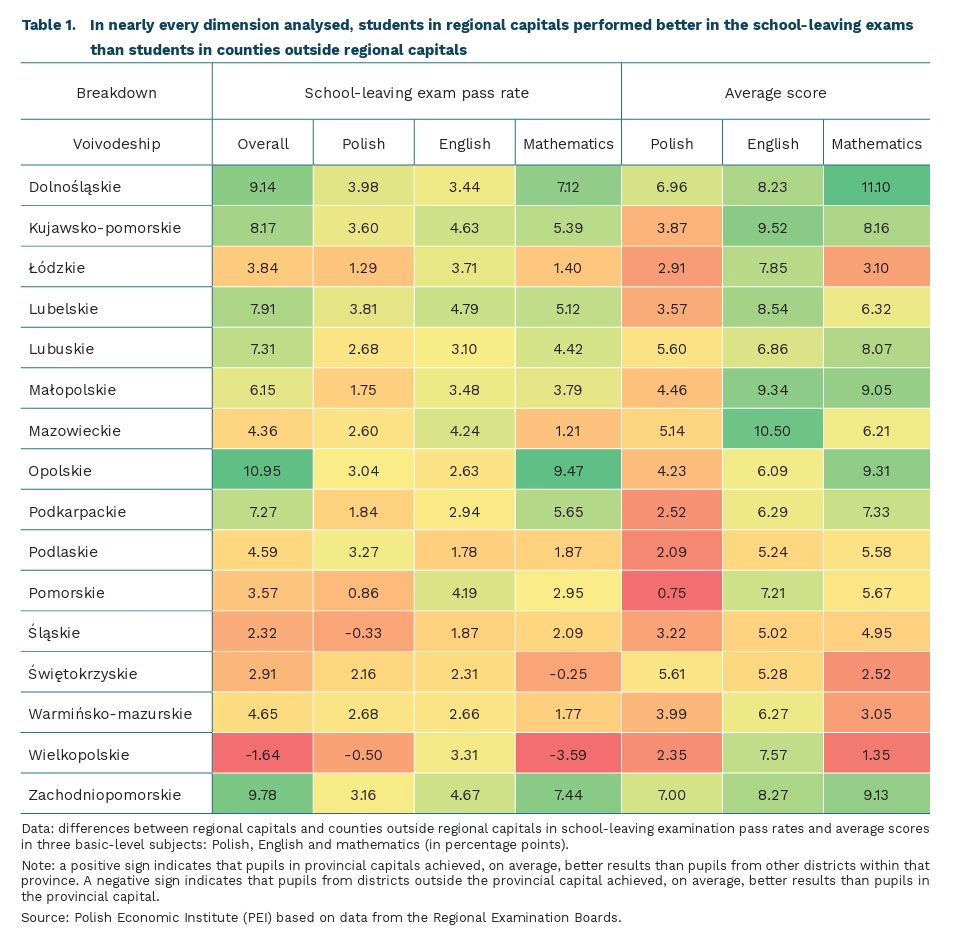
- Based on data for all counties provided by the Regional Examination Boards (OKE), we calculated differences in average pass rates and examination scores for three subjects taken at the basic level: Polish, English and mathematics. For each voivodeship, we calculated the difference between its capital and the remaining counties
- In each case, the figures are calculated on a scale from 0 to 100.
Łukasz Baszczak
The locations of data centers in Europe should take their end uses into account
94% of the EU’s computing power is located in ten countries
12.4 GW was the estimated computing power of data centers in the EU in 2025
3% of Europe’s computing power is located in Poland
The European Commission aims to triple the EU’s data center capacity within five to seven years, according to the proposed Cloud and AI Development Act (CADA). The total capacity of data centers located in the EU is estimated at approximately 12.4 GW in 2025, while the supply gap in computing capacity at that time is estimated to have been nearly 3 GW.
Computing capacity is not distributed evenly across the EU, with 10 countries accounting for approximately 94% of installed capacity. Leading the way are Germany (19%), France (15%), and the Netherlands (15%). Also worth noting is Ireland, which ranks fourth in the EU in terms of total installed data center capacity (13%), but has three times the installed capacity per 100,000 residents than the Netherlands, which ranks second. In fact, such rapid expansion of data centers in Ireland has led to concerns about overloading the power grid, a one-year moratorium on connecting new facilities, and the eventual imposition of strict requirements on new data centers. Capacity located in Poland accounted for approximately 3% of the EU’s supply, with facilities in the Warsaw metropolitan area playing a dominant role.
Given both the specific needs of various data center users and the potential negative impacts of building such facilities, it is advisable to use a variety of tools to support future investments. The solutions proposed by the European Commission, aimed at increasing the supply of data center capacity in Europe, do not distinguish based on the end use of this infrastructure. This decision is justified by the lack of differences in the existing administrative and technical barriers that limit the creation of new computing facilities.
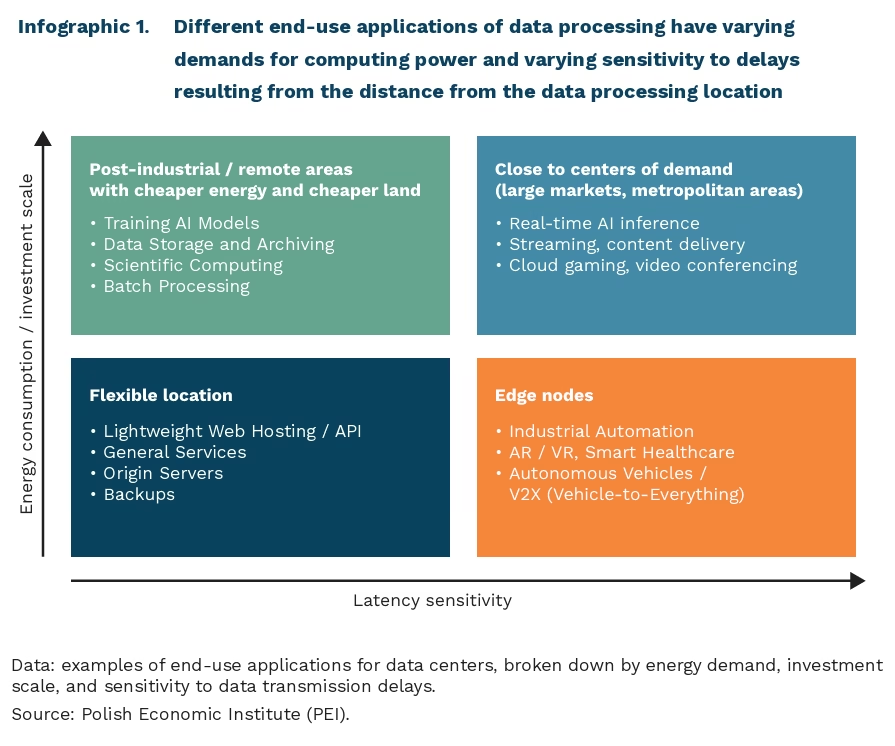
Certain types of data processing, such as training artificial intelligence (AI) models or scientific computing, require a large amount of computing power to be concentrated within a data center or cluster, but do not require the computing center to be physically close to the user. Due to their scale, such centers require significant land area, a large supply of electricity, suitable power grids, and cooling capabilities – making them well-suited for industrial and post-industrial areas that can provide the necessary infrastructure without competing for limited resources with large urban agglomerations. In contrast, data processing where relatively small latency is critical poses a greater challenge – the distance to the data center becomes significant for real-time streaming services, online gaming, or artificial intelligence model inference. In this case, it is reasonable to locate such facilities relatively close to large population centers. Industrial applications are even more sensitive to latency, but in their case, the physical proximity of data centers can be partially offset by decentralized edge computing, the development of which in the EU is one of the goals of the Digital Decade.
Data centers should not be viewed as neutral infrastructure, but rather as a new type of industrial facility – essential to the digital economy, yet one with significant external impacts. Given their limited direct economic benefits, the environmental costs they generate, their energy consumption, and local increases in land prices, locating computing infrastructure near large urban centers is only partially justified. For other applications, national, regional, or even continental data centers may prove sufficient, located in such a way as to maximize the economic benefits resulting from the development of the digital economy, while minimizing the impacts felt by Europeans.
Jakub Witczak
Polish companies rarely use external financing
46% of large companies consider access to external financing an important factor in the company’s development
2/3 of companies do not undertake any investment activity – according to the MIK survey
22% of Polish companies finance their investments from external sources – according to the EIB report
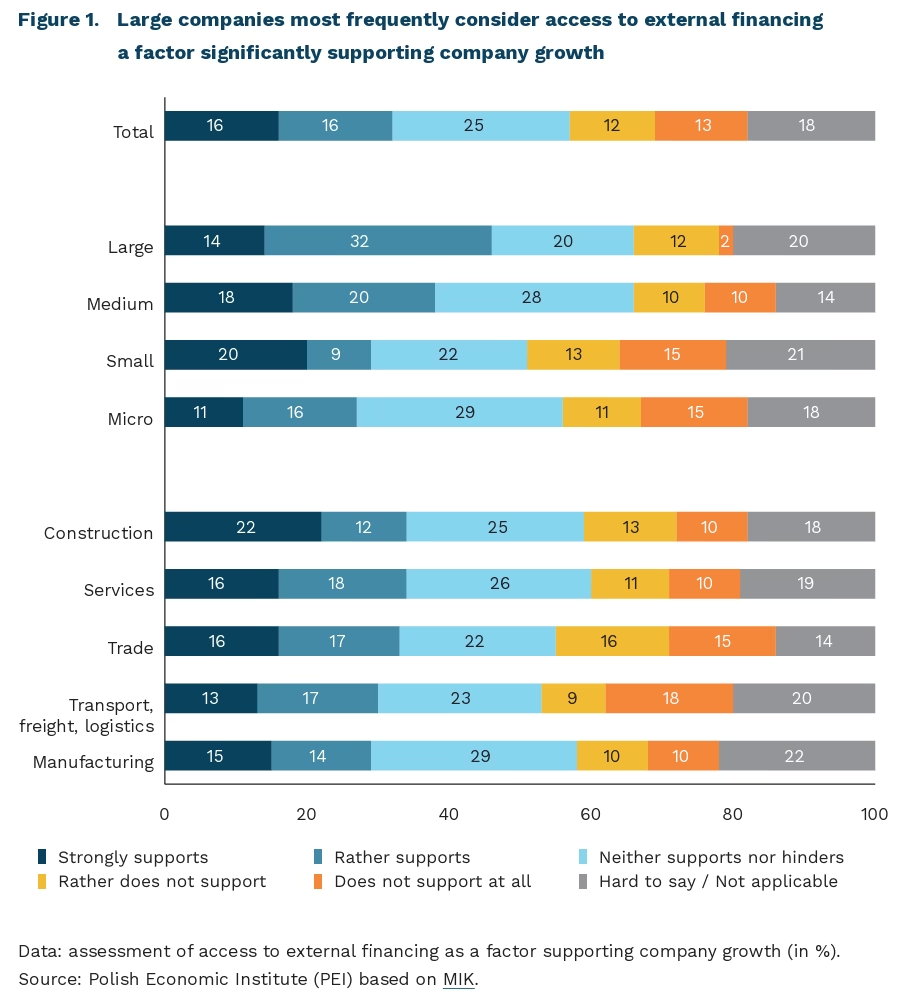
One third of companies believe that access to external financing supports their company’s growth – this follows from the July MIK (Monthly Business Climate Index) survey. Micro and small enterprises were significantly less likely to identify this link (29% and 27% respectively), whilst medium-sized enterprises were more likely to do so (38%). By contrast, among large companies, as many as 46% considered access to external financing an important growth factor. In the case of large companies, the greater use of external funds stems from the fact that the scale of their investments often exceeds the capacity of their own capital. Smaller businesses also often find it more difficult to access this type of financing. Differences between sectors were relatively small – the transport, freight and logistics sector and construction sector cited the importance of external financial resources slightly more often (34% each), while the trade sector did so least frequently (29%). In transport, freight and logistics, the need for continuous fleet investment often exceeds a company’s own resources, and payment bottlenecks are also a frequent problem. A similar situation occurs in construction sector, where intense competition forces companies to reduce their margins. A large share of companies participating in the MIK survey do not use external financing. In June, when asked to assess the availability of external financing, as many as 40% of companies declared that this was not a matter relevant to them, which likely means they neither use it nor consider it.
Although companies draw on external sources of financing relatively rarely, this does not appear to affect their propensity to invest. Since the beginning of the year, around 2/3 of companies participating in the MIK survey have declared no investment activity, but this has more frequently resulted from a lack of need to invest than from a lack of funds. Among companies that have not invested throughout all months of the survey, the clear majority have refrained from investing due to no such need arising, with only around 25-30% citing insufficient financial resources. Moreover, access to external financing is the second least frequently cited barrier to business activity, after product unavailability.
Companies finance their investments primarily from their own funds, which is also confirmed by international research. According to the EIB report, an average of 66% of companies in the EU allocate their own funds to investments, while only 25% declare using external funds. In the case of Polish companies, the figure is even higher – as many as 74% use their own financing, with only 22% using external funds. At the same time, in the same survey 42% of Polish companies declared using external financing at all (EU average: 42%), and problems with access to external financing were also the least frequently cited barrier to activity among Polish companies (43%).
Polish companies use external sources of financing less frequently than companies from other EU countries. This stems from the low-risk appetite of Polish entrepreneurs. In a survey conducted by PEI in 2022, a negative attitude towards risk was held not only by entrepreneurs with prior adverse experiences related to it, but also by those who had never previously used risky solutions. This may point to a strong psychological barrier – entrepreneurs want to avoid the emotional burden associated with taking on a liability that they will have to repay regardless of whether the investment succeeds. There is therefore a need to increase companies’ interest in external financing and to develop credit instruments that will minimise the perception of risk among beneficiaries.
Anna Szymańska
Countries are subjecting foreign investment to increasingly stringent scrutiny
52 countries had an FDI screening mechanism in place in 2025, compared with 21 in 2016
nearly 40% of the restrictive measures introduced in 2025 concerned FDI screening
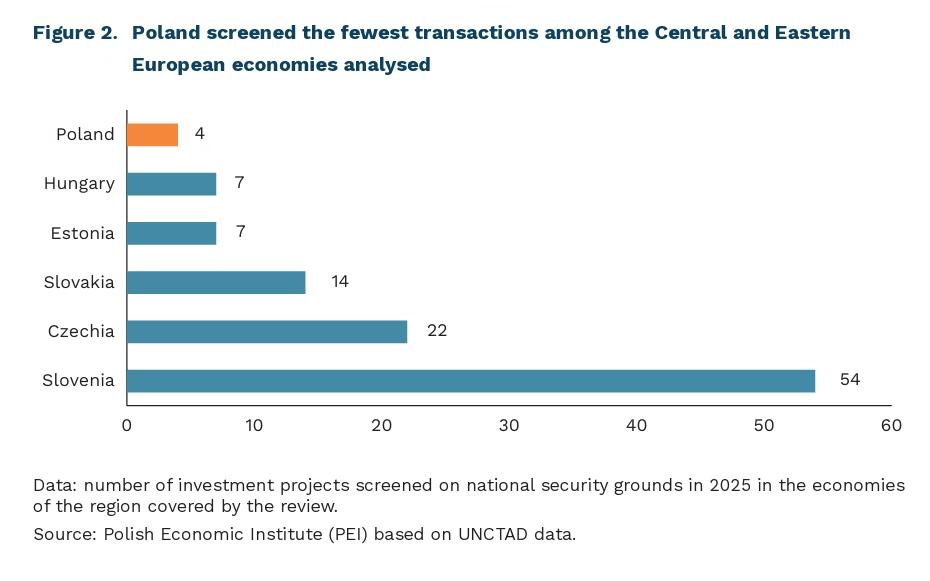
4 transactions were subject to screening in Poland in 2025; none were blocked
National security has become an important consideration in foreign direct investment (FDI) policy. In 2025, screening mechanisms enabling authorities to assess individual transactions for potential security risks were in place in 52 economies – 31 more than in 2016. This reflects a shift in the approach to FDI: alongside its economic benefits, the potential risks associated with it are increasingly being taken into account. In 2025 alone, new screening-related measures accounted for nearly 40% of all restrictive measures introduced with respect to foreign investors. All of them were adopted by developed economies.
The changes introduced in 2025 followed three main directions: establishing new mechanisms, expanding the scope of screening and strengthening state powers. New systems were adopted or launched in, among others, Albania, Croatia, Cyprus, Greece, Ireland and Switzerland. Czechia and Moldova expanded the range of activities subject to screening; Australia, Canada, Japan and South Korea tightened oversight of sensitive sectors or technologies; and Hungary granted the state a right of first refusal, allowing it to acquire the subject of a transaction on the same terms as would have applied if it had been acquired by the blocked foreign investor.
Despite the growing prevalence and expanding scope of screening, the proportion of cases rejected or blocked remains low. In the 22 countries analysed, 60 of the 9,503 cases subject to review were rejected or blocked, equivalent to 0.6%, while 221 were modified or approved subject to conditions. Among the 1,259 cases subjected to an in-depth review, the corresponding shares were 4.8% and 17.6%. Screening therefore led much more frequently to transactions being modified or made subject to additional conditions than to their being blocked. This overall picture does not necessarily reflect the practice of every country, however. In the EU, final decisions remain within the remit of national authorities, while screening mechanisms differ in their scope and restrictiveness, limiting the international comparability of the data.
In 2025, Poland decided to make permanent the additional controls on foreign acquisitions that had been introduced temporarily during the pandemic. As a general rule, they apply to investors from outside the EU, EEA and OECD that intend to acquire a significant stake in or control over selected companies based in Poland. The controls apply, among others, to listed companies, entities holding assets forming part of critical infrastructure and companies operating in strategic sectors, provided that their revenue in Poland exceeds EUR 10 million. In 2025, four cases were subject to screening; all were referred for an in-depth review, none were blocked, and three resulted in unconditional approval.
Dominik Kopiński
Further MPC decisions will depend on the escalation of the conflict in the Middle East
3.2% y/y projected CPI inflation in Q4 2026, according to the NBP projection and market consensus
above USD 85 the price of crude oil futures per barrel following the renewed escalation of the conflict
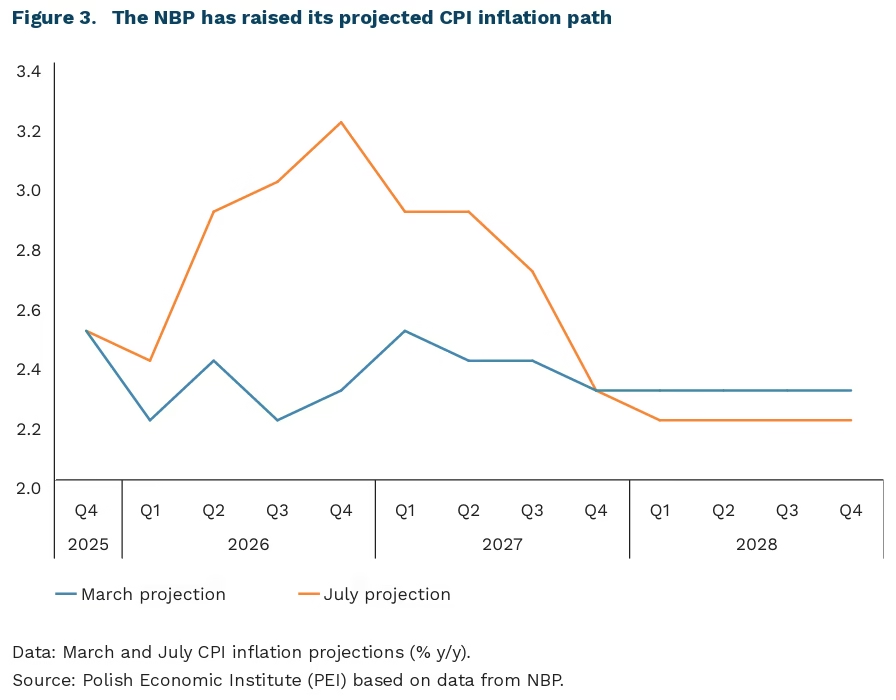
The Monetary Policy Council (MPC) once again left interest rates unchanged. However, the narrative concerning the future direction of monetary policy has shifted markedly. During the post-meeting press conference, the NBP Governor declared readiness to implement one interest-rate cut later this year, although such a scenario had previously been ruled out. Financial markets reacted immediately: the EUR/PLN exchange rate rose to 4.33, reaching its highest level since November 2024. The NBP’s July inflation projection assumes that CPI inflation will increase to 3% y/y in Q3 and 3.2% in Q4. This increase is expected to be temporary and primarily related to the termination of the CPN programme. At the same time, the projection is based on the assumption that supply conditions in global energy commodity markets will gradually normalise, which remains one of the key risks to the forecast. Other domestic factors, including economic activity and labour market conditions, should not currently generate strong inflationary pressure. This is confirmed by slower wage growth, which stood at 5.8% y/y in May. Recent developments in the Middle East, however, raise considerable doubts as to whether this positive scenario will materialise.
Further MPC decisions will largely depend on how the conflict in the Middle East develops and how it affects energy prices. The scenario presented by the NBP Governor could materialise if hostilities in the Middle East come to an end and conditions in energy commodity markets stabilise. Another important factor would be the absence of divergence between the direction of monetary policy in Poland and abroad. Differences between the decisions of major central banks and the policy pursued by the MPC could increase pressure on the Polish złoty to depreciate. Recently, the European Central Bank decided to raise interest rates, as discussed in the PEI Economic Weekly. Some members of the Federal Open Market Committee have also begun supporting the possibility of raising interest rates in the United States in response to higher inflation. Nevertheless, inflation surprised on the downside, reaching 3.5% y/y in June, 0.3 percentage points below market consensus. For the time being, the depreciation of the złoty therefore remains moderate. However, the pressure could intensify if interest-rate paths continue to diverge. A weaker złoty would, in turn, increase the prices of imported commodities, fuels and production inputs, amplifying the external inflationary impulse and limiting the scope for interest-rate cuts.
Meanwhile, the renewed escalation of tensions, which was not incorporated into the NBP forecast, has pushed oil prices back above USD 85 per barrel. This pressure coincides with the termination of the CPN package, which could additionally increase inflation in Poland. As a result, the current market consensus assumes that interest rates will not be cut until the first half of 2027. However, the impact of higher commodity prices is expected to be smaller than in 2022, partly because of greater diversification of energy supply sources and the different prevailing economic environment. According to analysts’ forecasts, inflation will average 2.9% y/y in Q3. The consensus also assumes that CPI inflation will remain within the permitted fluctuation band around the NBP’s target, reaching 3.2% y/y in Q4 before declining to 3% and 2.9% y/y in Q1 and Q2 2027, respectively.
Piotr Kamiński
Among the major cities, flat prices fell most sharply in Warsaw
1.7% y/y fall in the price of 1 m² of a flat on the secondary market in Warsaw in the first quarter of 2026
1.0% y/y growth of the price of the 1 m² of flats on the secondary market in the other six largest cities in the first quarter of 2026
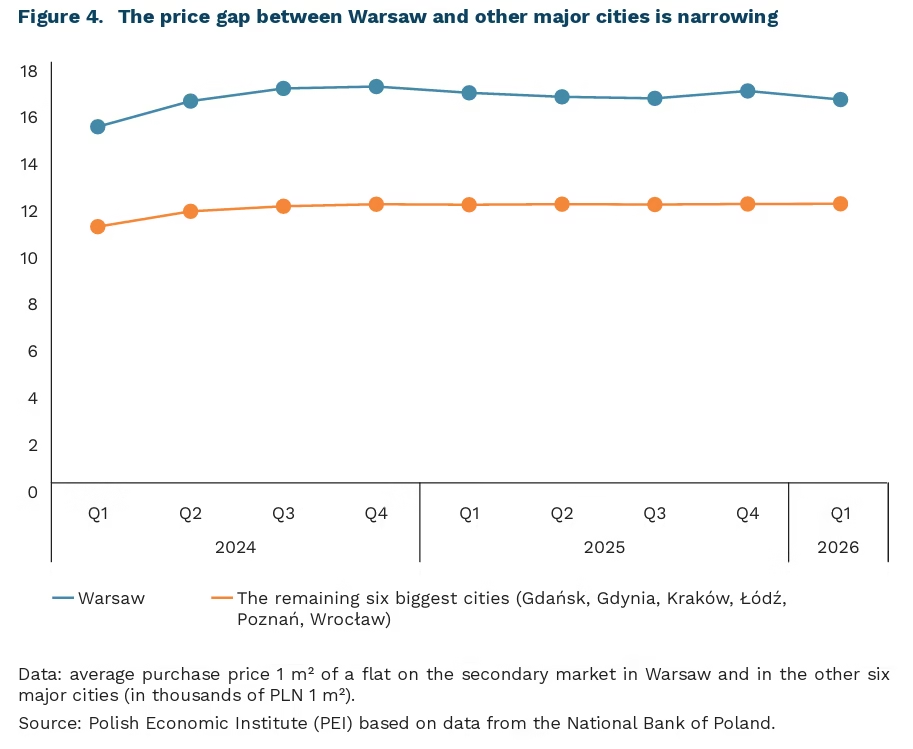
In the first quarter of 2026, transaction prices for flats on the secondary market in Warsaw fell by 1.7% y/y, whilst in the other six largest cities (Gdańsk, Gdynia, Kraków, Łódź, Poznań, Wrocław) they rose by 1.0%. The latest data from the National Bank of Poland (NBP) indicate that, from the fourth quarter of 2024 onwards, flat prices on the secondary market in Warsaw have followed a different trend to those in the country’s other major cities. During this period, the average price 1 m² of a flat in Warsaw fell from 16,900 PLN to 16,400 PLN, whilst the average price 1 m² of a flat in the other six largest cities rose by 1.0%.
The price gap between Warsaw and other Polish cities remains significant, although it has been narrowing in recent years. As recently as the fourth quarter of 2024, flats on the secondary market in Warsaw were 42% more expensive than the average for the five cities, and by the first quarter of 2026, the difference had fallen to 37%. Currently, whilst 1 m² of a flat on the secondary market in Warsaw costs an average of 16,400 PLN, the figure in the six other largest cities is 11,900 PLN. This gap is narrowing mainly due to the price correction observed in Warsaw over the last two years, whilst prices in the other markets have remained stable.
Among Poland’s five largest cities, the highest price growth was seen in Gdańsk. In the secondary market, Gdańsk recorded y/y price increase of 6.2% and a quarter-on-quarter (q-o-q) rise of 2.6% in the first quarter of 2026, whilst the primary market saw a 5.4% y/y increase. This was by far the strongest growth rate among all the cities analysed, well above the average for all six cities (+1.0% y/y on the secondary market and +0.5% y/y on the primary market). However, price growth in the other cities was significantly weaker or even negative. Kraków and Wrocław recorded y/y falls in the primary market (by -1.7% and -2.5% respectively), whilst Poznań recorded a marked quarterly fall in the secondary market in the first quarter of 2026 (by -3.4%). Łódź remains the cheapest and most stable market in the entire group, with changes close to zero in both segments.
Prices on the secondary housing market in Warsaw are falling despite an improvement in conditions for prospective buyers, both in terms of access to credit and their purchasing power. Over the past year and a half, the Monetary Policy Council has cut interest rates by a total of 200 basis points, which has significantly improved households’ borrowing capacity. As a result, there has been a double-digit increase in the number of enquiries for mortgage loans in 2026 (ranging from +29.8% y/y in April, through +32.7% in May, to a record +80.5% in March) (although this is largely attributable to loan refinancing, as we reported HERE). Added to this is a steady, albeit slight, improvement in household purchasing power: in May 2026, the average wage in the corporate sector rose nominally by 5.8%y/y, which, with inflation at 3.1%, represented a real wage increase of around 2.6%. Furthermore, between 2023 and 2024, the rise in flat prices in Warsaw was significantly faster than the rise in incomes – on the secondary market alone, prices rose by over 21% in 2024, which was considerably faster than the growth in real wages during that period. All this may suggest that the correction in the capital is not the result of weakening demand or more difficult access to finance at a national level.
Paula Kukołowicz
The number of users of time-of-use electricity tariffs in Poland is rising
4.8 thousand households in Poland used time-of-use electricity tariffs by the end of 2025.
93% of households in Poland using time-of-use electricity tariffs have signed contracts with alternative suppliers (other than the major energy companies: PGE Obrót, Tauron Sprzedaż, Enea, Energa Obrót and E.ON)
Time-of-use electricity tariffs are indicated as one of the tools for increasing the flexibility of electricity demand among end users. Changing the pattern of electricity consumption helps the national electricity system to operate more efficiently, as the share of electricity generated from renewables is increasing. International Energy Agency (IEA) notes the potential of time-of-use tariffs, but emphasises that – particularly among small consumers (e.g. households) – this potential remains untapped.
By the end of 2025, 4.8 thousand households in Poland used time-of-use tariffs. Their number has increased significantly compared with the start of 2025 (135 households), but they still account for just 0.03% of customers in tariff group G. At the same time, they account for 0.05% of electricity consumption by customers in this group, which shows that households with higher-than-average annual electricity consumption are opting for time-of-use tariffs. Such customers often use energy-intensive appliances (heat pumps, air conditioners) or electric cars.
In Poland, ten suppliers offer time-of-use tariffs. These include both those who are legally obliged to offer such tariffs (companies serving more than 200 hundred thousand end customers) and alternative suppliers. It is the latter who are the leaders in this segment of the retail electricity market – 93% of contracts with time-of-use tariffs were signed with them (as of the end of 2025).
The limited uptake of time-of-use tariffs is due to several factors. These include: a relatively low proportion of households with smart electricity meters (48% by the end of 2025), low awareness of the availability and the benefits of time-of-use tariffs, and the absence of a maximum electricity price cap under such tariffs with some suppliers. Furthermore, time-of-use tariffs can currently only deliver noticeable savings for a select group of consumers – typically households with above-average electricity consumption that use household appliances (e.g. washing machines, dishwashers) or other devices (e.g. heat pumps, air conditioners) with programmable settings, and which own detached houses.
Time-of-use tariffs could be more advantageous if the variable network charge were also differentiated. This is a significant component of a household’s electricity bill, depending on how much electricity is consumed and at what times (under time-of-day tariffs). Unlike fixed charges, which remain the same each month (e.g. the fixed network charge, the supplier’s charge, VAT), the variable network charge under a time-of-use tariff could be calculated flexibly, for example on an hourly basis, in the same way as the charge for active energy (actually consumed). This would enable users of the time-of-use tariff to reap greater benefits and would provide a stronger incentive to adjust their electricity consumption on an ongoing basis. This would help to increase the stability of the electricity system and reduce its operating costs.
Wojciech Żelisko
